Showing posts with label blud. Show all posts

Friday, January 12, 2007

On Options

Well, it was another wreck of a day for da bears (new high on the Dow, once again), so.......let's talk about something else, shall we? Seriously, one of the most frequent requests I have been getting in the comments section has been to talk a bit about options. So here we go.

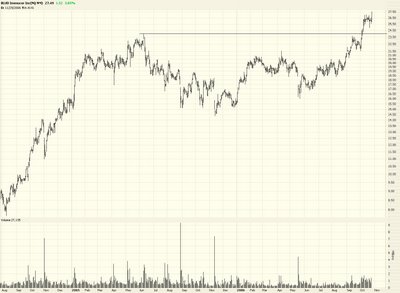
Considering the market's behavior lately, let's make this a happy story and focus on a call option. In particular, a call option for a stock I suggested way back in an October 6, 2006 post. The stock was Immucor, symbol BLUD.


At the time, the stock was at about $25. Now let's suppose you had so much faith in this chart that you didn't just want to buy the stock, you wanted to buy the call option (in order to leverage your investment and possibly enjoy great percentage gains).

Well, let's slow down for just a minute and do the most important thing first: figure out a stop-loss price. In other words, figure out at what price we would consider our speculation incorrect. In the case of BLUD, the deepest point of the most recent dip in this chart was at $21.57, about $4 less than its current price. So we decide that if the price ever dips below this level, we will close out our position at once.


Next we have to pick an option - - we'll want a call option, of course, since we're bullish on the stock. I typically look for a number of properties in the option I choose:


  • I'd like it to be a little in the money; so in this case, we'd want a $25 call, since the stock is a little over that amount

  • I'd like the expiration to be at least two or three months down the road. If you get the "front month", the time decay will eat you alive. But if you buy an option that's a year down the road, the movement in the stock will have a very dampened effect on the price of the option. So right now it's January, and I'd be looking at Marches or Aprils (at the time of the BLUD suggestion, a January option would have been appropriate).

  • I want to see relatively beefy volume and open interest. It's not easy to find with options (except for huge ones like the S&P 500).

  • I want to see a bid/ask spread that's not big enough to drive a truck through. If an option is bid 5.30, ask 6.50, I'm not interested. Focusing on rule (3) will help get you away from overly fat spreads.

So, for instance, here's a chunk of an options screen showing the S&P options; the one I've highlighted is interesting since its volume and open interest stand out above the others, plus, it's in-the-money.


Once the order is placed, I immediately want to get a contingent order placed. This means that if the stock goes above (in the case of a put) or below (in the case of a call) a certain price, a market order will be immediately placed to close that position at the best available price.


Those are pretty much the steps. Once they are in place, one of several things can happen. The stock can move in the direction you anticipated, which will benefit the option even more. Or the stock can move against you, pushing past your stop price, and closing the position at a loss. Or the stock can just meander along, which isn't something you can tolerate for long because the option will expire at some point!


Now let's see the happy ending to this story. BLUD went up about 30% since the suggestion back in October. But the option went up hundreds of percent! That's the beauty of leverage. Now, I admit, this is a fairly idealized example. But the important things to note are: (a) some of the rules to follow (b) the importance of stops (c) the power of leverage, if things go your way!

Thursday, January 04, 2007

Buy Buy!

Two days into 2007, and each of them an up day on the Dow. The bulls are still having their fun. Granted, both days combined don't even equal 20 points. But the bulls are still lovestruck.


OK, that probably woke you up. I hate to be punitive, but no one commented on my gallery of Worst Album Covers yesterday, so I wanted to supplement them.......from the pious.....


...to the romantic....


...to the deepest male emotions.....


....to Ken.....by request. I imagine this is simple a blank vinyl disc.


ABT looks attractive as a buy. This market is really overpriced, I think, but this is still a handsome chart.


HAL, on the other hand, is more symbolic of what's happening. Broken trendlines, weakening stocks, all masked by a strong megacap market


I'm starting to lose faith in GOOG (and RIMM) as shorts. Today was a very strong day on both counts. I've marked by stop-loss price on GOOG here.


DST is sort of fascinating in how it shows trendlines "changing coats" from support to resistance. This kind of thing happens all the time.


BLUD, which I've mentioned many times before as a long, continues to be fantastic. Just look at this strength.


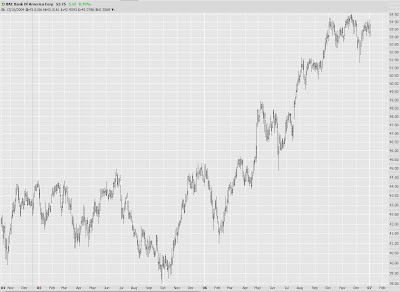
BAC, Bank of America, seems a possible attractive short as it seems to be changing direction here.


QID, the double-inverse NASDAQ ETF, is fascinating in the sense that volume is exploding and the price is finally turning around. Hopefully this is the shape of things to come.


OXY is a good representative of the weakening oil stocks.


Whereas the broad OIH continues to falter. I've been bearish on oil for a few weeks now.


HYDL, mentioned here as a short before, is also enjoying a downdraft.


Although I haven't mentioned HP (the symbol, not the company) in a while, this is a gorgeous example of Fibonacci retracements in action. Magical!

Finally, RTI looks like it may have put in a double top.


See you Friday afternoon......it'll probably be a late posting. It might not even happen until the weekend. But I'll get it done!

Thursday, December 28, 2006

Looking Back at 2006 via TraderTim

There are just a couple of business days left in 2006. I, for one, will be happy to put this year behind me. I just skimmed all my posts for the year (and I did a lot of writing this year.......it would easily fill a book) and the recurring themes seem to be (a) frustration and (b) boredom. Not good.

There is, however, some good stuff in the bowels of this blog. Today I wanted to review some of my "hits" and "misses" for 2006, and tomorrow I'm going to publish a Best of the Blog for your enjoyment.

I'm the sort of guy who, if you have good news and bad news to tell me, I always want to hear the bad news first. So let's look at my misses for this year (on the whole, these are just hyperlinks to the blog entry - I suggest you right-click on them and just open the article into a new tab or new window so you don't lose this list):

The Misses

NTRI is doomed! - NutriSystem has done quite well this year, in fact. An amazing stock.

My overall bearishness - well, my Lord, you can find this in almost every post! But a couple of examples are here and here.

Cult of the Bear - a link to the fascinating three-part article predicting 6,800 on the Dow in 2006 (umm, well, the Dow is about twice that level).

Making too much of losses early in the year - but, wow, wouldn't you love to see a GLOBEX screen like that one again?

Shorting OIH prematurely

Premature prediction as to the demise of HANS - it went much higher before it finally stumbled.

The poo-pooing of Barron's prediction for Dow 12,000 - As you know, it's beat that by a wide margin already.

OK, so I'm an idiot, right? Well, only half-right. I had some hits too. Let's take a look back:

The Hits

Predicting GOOG would sink to $330 - OK, I get to gloat on this a bit. The stock bottomed at $331.55. This was an amazing call. Were that there were more like it!

MTH short - a beautiful head and shoulders pattern

ASYT buy, with a target of $7.50 - it actually climbed even higher, to above $11.

Bullish buy list
- the average gain on this list is over 25% now. Maybe I should do more bullish posts, eh?

GOOG as a buy - the stock is up nearly double since this post.

COF short suggestion

PNRA short suggestion

BLUD long suggestion

I'm honestly not trying to get away with rehashing old material. It's instructive to look back. I hope you enjoy reviewing some of these old posts, even though they only show me in a semi-favorable light!

I'll be back tomorrow with my Best of the Blog list.

Wednesday, December 27, 2006

12,500

Wow. They finally did it. The bulls got the Dow over 12,500. 2006 is definitely going to be a year of great memories for the bulls. Congratulations, longhorns!


If you look at the performance of the various indices this year, you can see that - strangely - the Dow 30 is the king. Clearly mega-caps are on top of the world. The Dow is usually the boring, staid index compared to the likes of the NASDAQ. The laggard here is in fact the NASDAQ 100.


One chart that provides some small bit of comfort to bears is of the S&P 500. Take a look at how the index has behaved within the confines of the channel I have drawn. It certainly seems that the time is pretty ripe for a push downward. We are completely mushed up against the highest bounds of the channel, and the time space between the arrows is calling for a fall.


Anderson (ANDE) is a pretty handsome looking chart to buy (yes, buy). The volume is relatively anemic, however, and that's not a great confirmation sign.


Immucor (BLUD), which I've mentioned many times in the past as a buy, continues to push higher. The higher it goes, the stronger it looks.


Express Scripts (ESRX) actually fell today, in spite of the triple-digit rise on the Dow. I've always enjoyed this one as a bearish play, and I'm in it again.


Google is still looking good for a fall, in spite of recent strength.


Looking closer, one could even suggest a small head and shoulders pattern recently. Today's big upward move was a nice retracement to the neckline.


There are only two days left to the very tough year.......I suspect the bulls are going to just keep padding their gains.

Hope springs eternal. Come on, 2007 - - be kind to us!

Tuesday, December 19, 2006

Beyond Good and Evil

Well, the day started off well enough. A nice initial wallop. Regrettably, the markets clawed their way back up to end in positive territory. Chalk up "Mini Asian Financial Crisis" as yet another thing the markets can shrug off as irrelevant.

Speaking of financial disasters that no one seems to care about, the Financial Report of the United States Government was issued recently. It's nearly 200 pages, but here are a couple of interesting bits:


Despite improvement in both the fiscal year 2006 reported net operating cost and the cash-based budget deficit, the U.S. government’s total reported liabilities, net social insurance commitments, and other fiscal exposures continue to grow and now total approximately $50 trillion, representing approximately four times the Nation’s total output (GDP) in fiscal year 2006, up from about $20 trillion, or two times GDP in fiscal year 2000.

and.......

Given these and other factors, it seems clear that the nation’s current fiscal path is unsustainable and that tough choices by the President and the Congress are necessary in order to address the nation’s large and growing long-term fiscal imbalance.


I found the graph about the Medicare gap particularly interesting. I don't think I've ever seen a y-axis before which measures "billions" of dollars with figures such as $16,000 (e.g. Sixteen Thousand Billion - - otherwise known as Sixteen Trillion). Umm, we are hosed, people. Wake up!


AIV is representative of many REIT stocks, all of which are softening like butter on a midsummer's day.


BAC looks like the uptrend is over.


BLUD, one of my few long suggestions, is still looking mighty purty.


BZH, another long suggestion, seems also poised for a rise.


Although I'm uncertain as to where gold is heading, GFI looks potentially bullish as well. (Wow, three bullish mentions in a row.......)


MDC is easing away from its retracement nicely.


.....as is old favorite MTH.


Many people have asked me to look at QID. I own this now. It doesn't have much of a history to it, but it's a nice double inverse play on the Nasdaq. And check out the volume!


RIMM, which will give everyone a quarterly update after the close Thursday, is starting to slip-slide away again.


And SHLD, long-watched but seldom tried, is looking mighty mushy.


It was disappointing, of course, to see how boldly the markets fought their way back today. The bulls have had a dynamite year (and the dynamite was placed directly under our paws). I guess they're just going to keep pouring salt in the wound until Dick Clark's ball drops at year's end.

Thursday, October 26, 2006

Cut and Paste

I'm starting to think I should just cut and paste a generic blog entry each day: "The economy is on a precipice. The housing market is failing. Stocks are insanely overvalued. And a new high was reached today." It would save me plenty of time and effort.

Today it was reported that houses suffered the biggest year-over-year fall in over three decades. My local market (the crazy SF Bay Area) is looking like this lately:


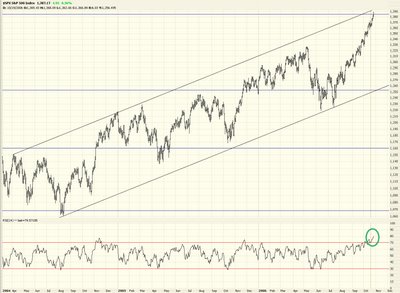
So how did the market react to the news that the principal asset of every American is collapsing in value? It spiked to a new high! Of course! Here's the S&P 500 with the RSI indicator. The index is at the top of a channel and the RSI is in nosebleed territory.


I have no position in Red Hat, but this is an amazing stock. Below is the entire history. You can see broad trends of higher highs/higher lows and lower highs/lower lows over the course of its history. I guess the news that Oracle is going to provide support to Red Hat users at a deep discount tossed a nuclear missile at this stock (which had amazingly high volume - something like over 80 million shares).


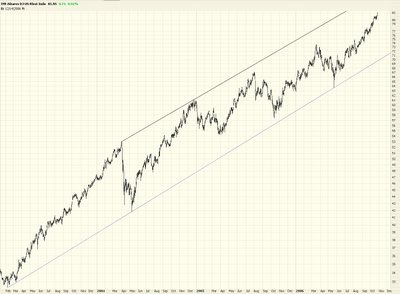
Now here's a chart I simply cannot figure out. It's symbol IYR, which is an ETF for real estate in the U.S. This chart just goes up and up and up. Even on a day like today. Clearly this has nothing to do with domestic housing (I suppose). I would think that the shrinking of the housing bubble would be causing damage here. Not in this market.......


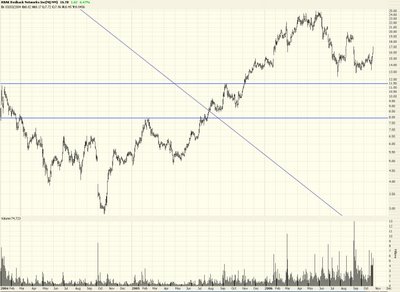
Perversely, in this bearish blog, my "long" suggestions are doing great. Once again, the hotties are Redback Networks (RBAK):


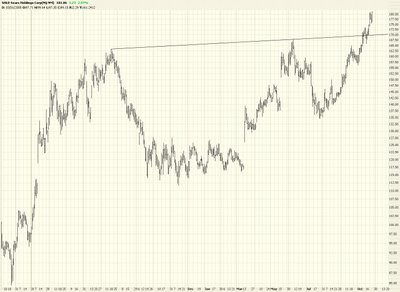
Sears Holding (SHLD):


and Immucor (BLUD):


I am having absolutely no fun in this market at all. You can tell by my posts. I hate not understanding a market, and I absolutely do not understand this one. Not a great thing for me to say in my own blog, but that's the truth.

Friday, October 06, 2006

Bear Goggles

Lest anyone think otherwise, rest assured my bearish view on the market is still quite intact. It's been frustrating. It's been hard. It's been expensive. But I look at a lot of charts, and I am still absolutely convinced there's a lot more potential on the downside than the up. I guess I'm wearing bear goggles.

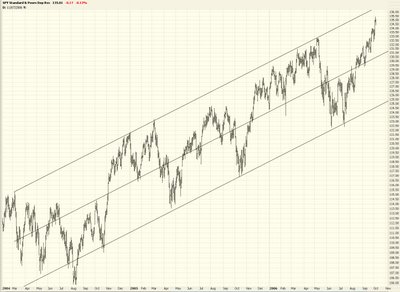
Take a look at one simple chart - the SPY. You can see the channel. You can see the median line. Now, regardless of whether you're a bull or a bear, tell me something: based on the behavior of the past two years, do you think it's more likely this will be lower or higher a few months from now? (dramatic pause) That's what I thought.


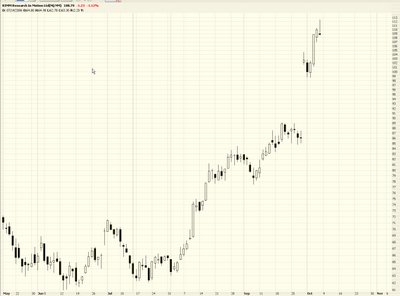
RIMM is looking sweet. It's got a beautiful shooting star candlestick pattern, and I think we can all agree this has had a fast, furious run-up in price.


For balance, I offer something that looks like a good buy. The symbol is BLUD. This is a solid looking pattern.


Here's to a better week next week, ladies and gents. This one can soon be forgotten.