Thursday, August 31, 2006

Somnambulant

Holy God, will someone please make me up whenever everyone gets back from vacation? I haven't had a vacation in years. Where is everyone? This is nuts!

OK, rant over. The market, once again, puttered, farted, and lolligagged all day long. My twin-disc DVD set ("Grass Growing" and "Paint Drying") is providing excellent entertainment in lieu of the markets. I think all market commentators should get time off until Tuesday, September 6th. It's just not right!

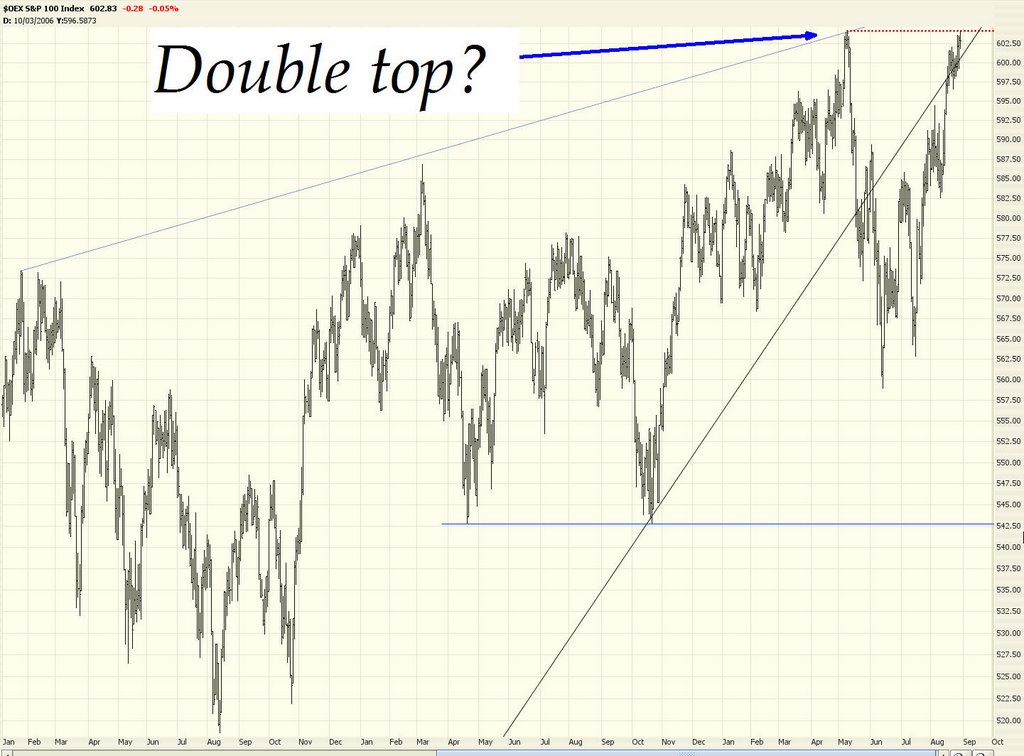
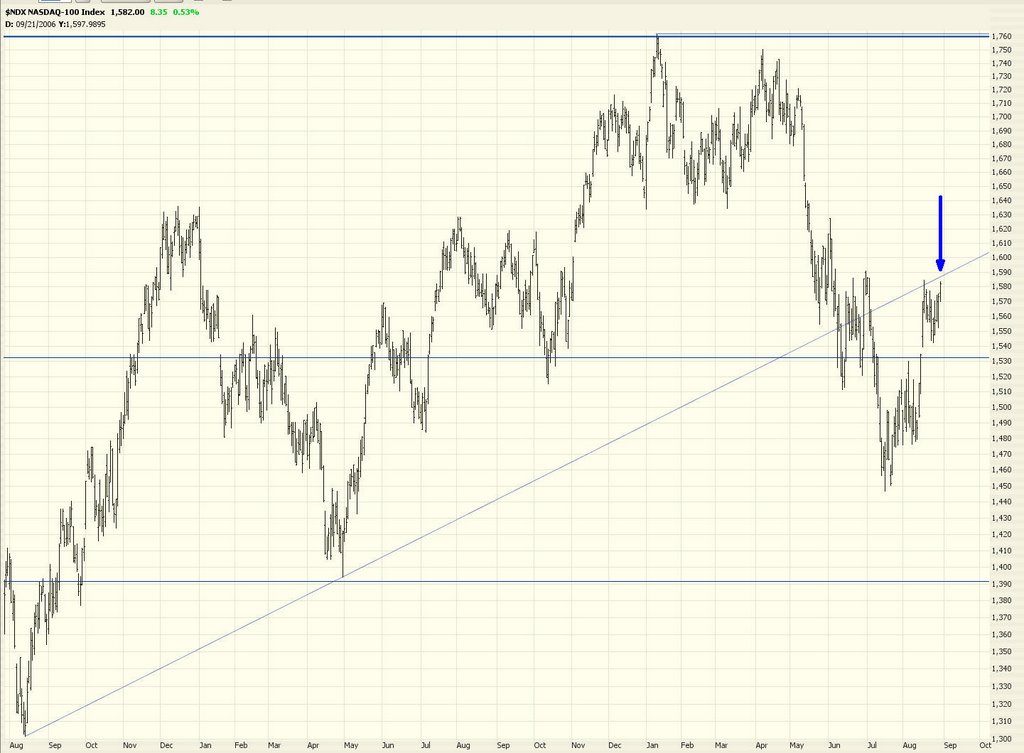
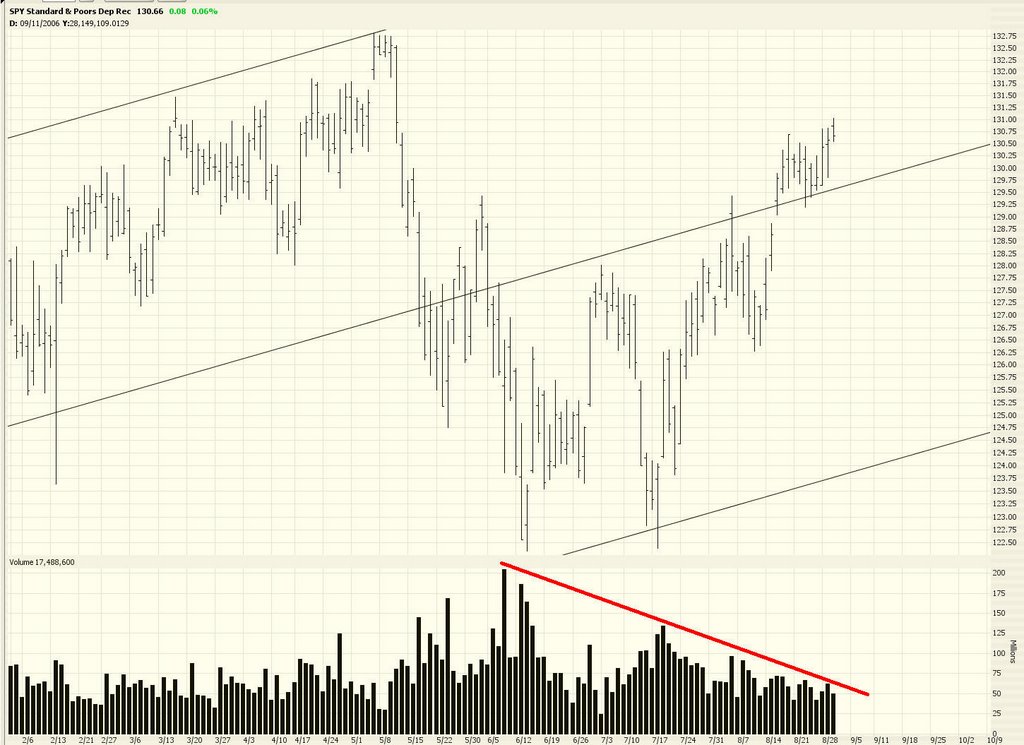
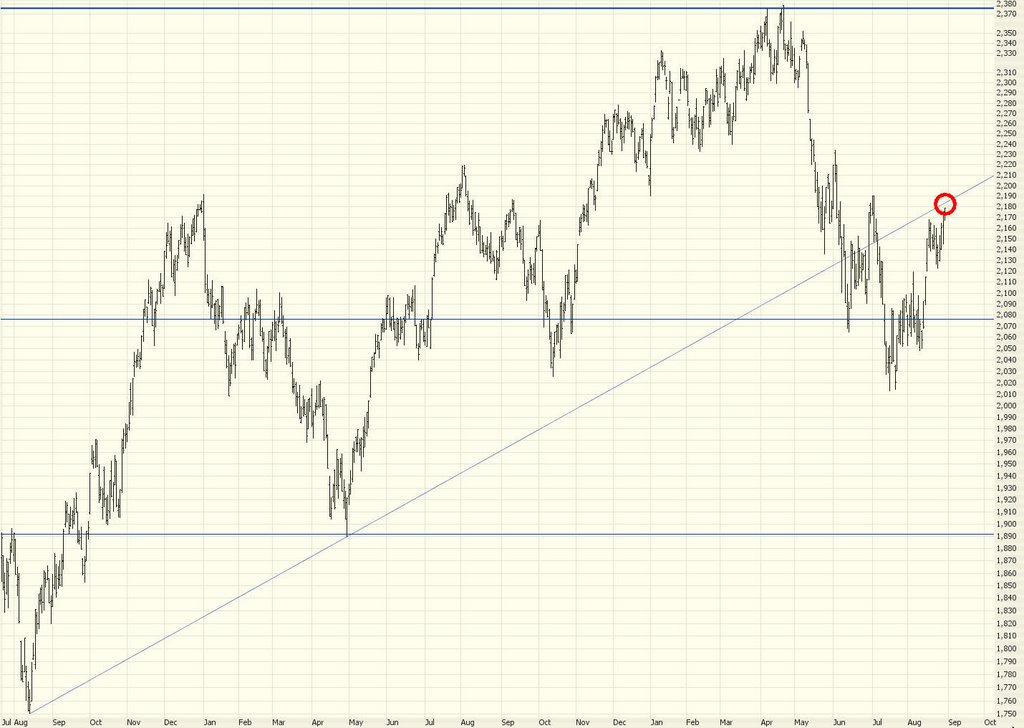
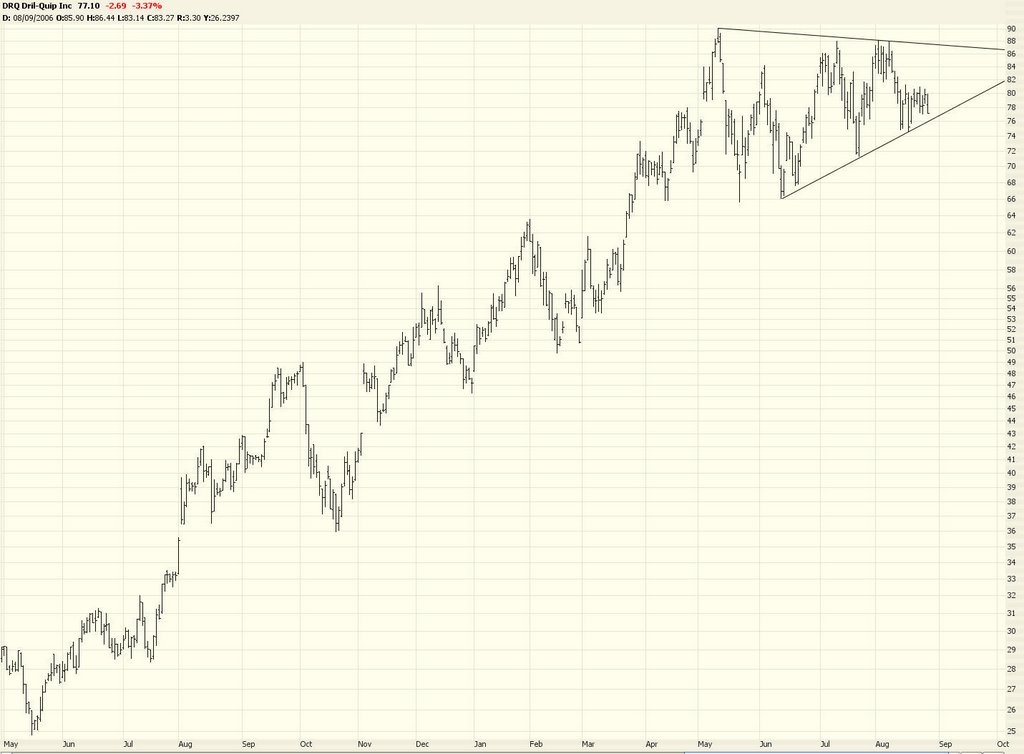
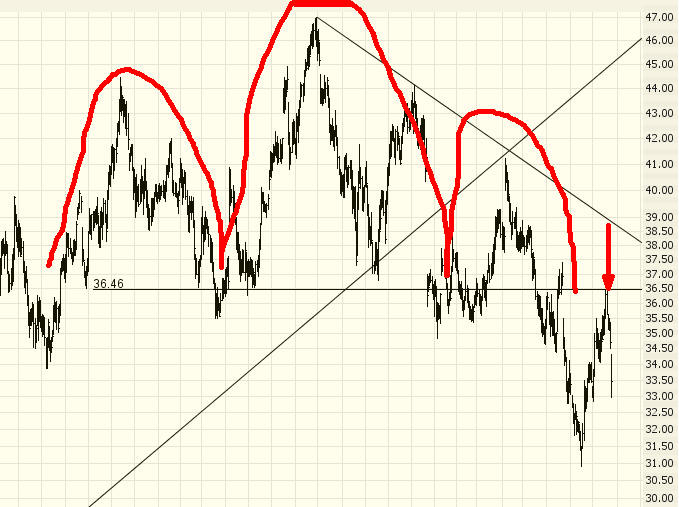
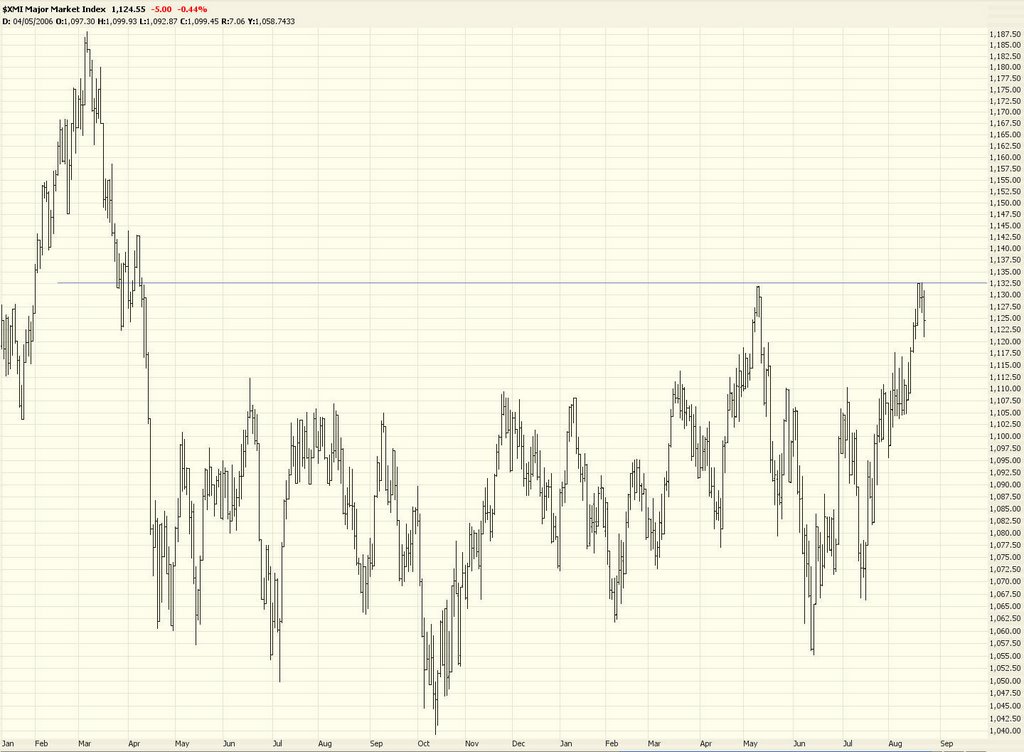
I really have nothing new to say about the markets. If things don't start getting zippier, I'm going to have to start posting old baseball statistics. Here are just a few charts. The latest on the S&P 500...........which way will it go? Hopefully next week, the first post-summer trading, will yield an answer.


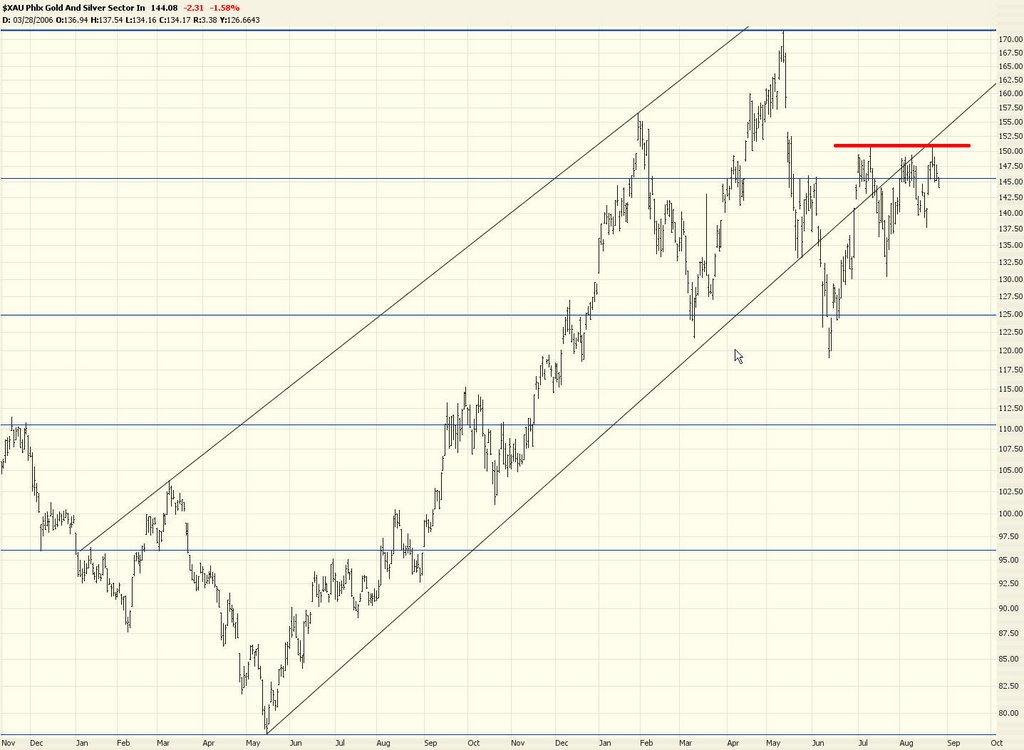
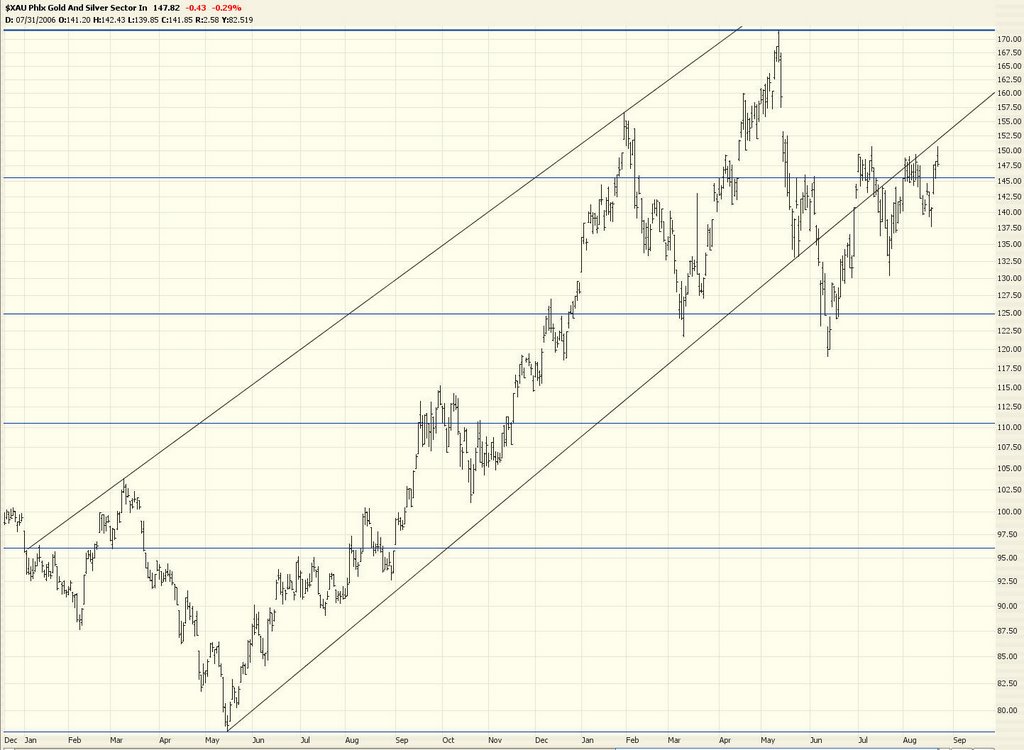
The oil services sector, which fell nicely yesterday, went up a touch today. We still need to break below 130 to make this exciting. I've put a rounded rectangle to indicate the space OIH needs to traverse to make this H&S pattern complete.


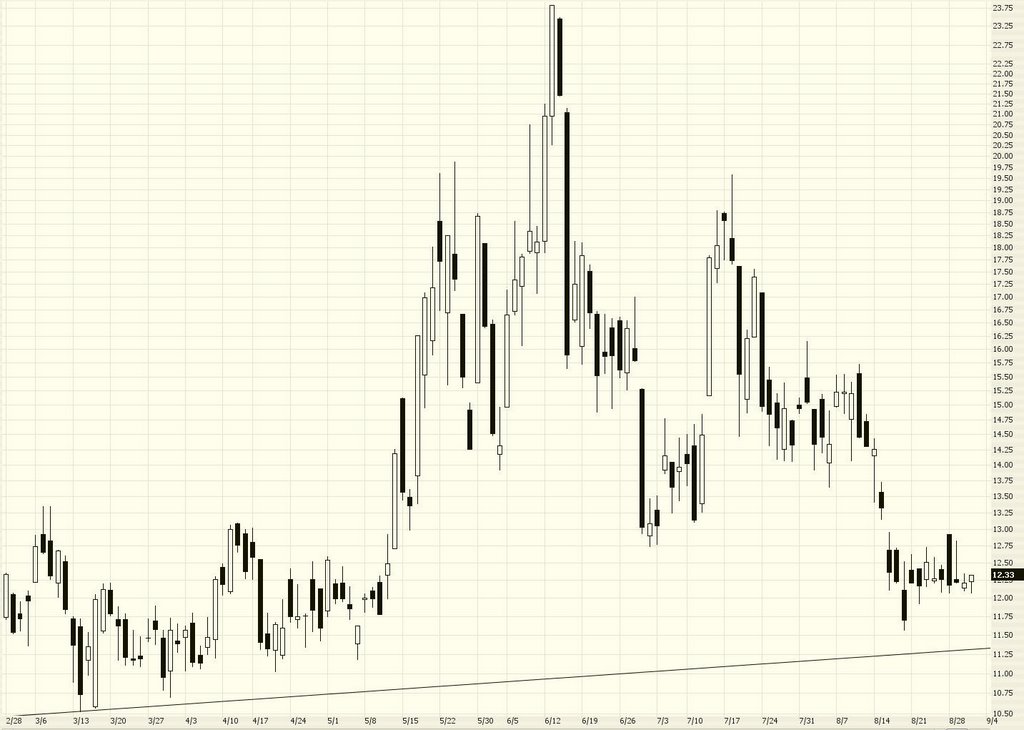
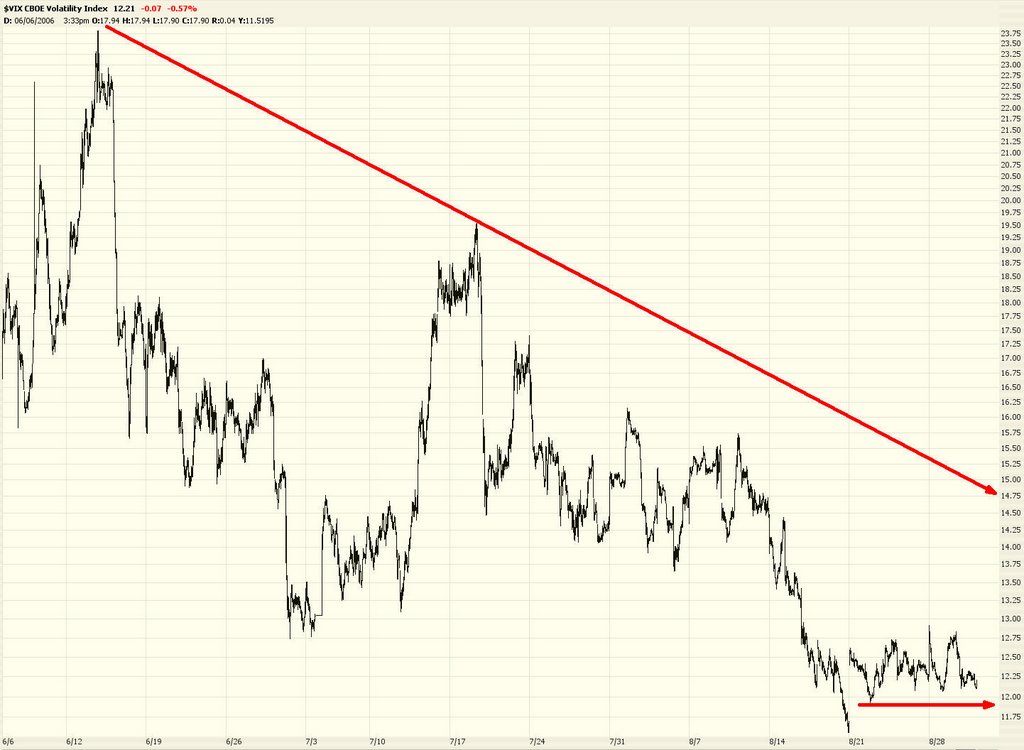
The VIX is still stuck in neutral. Complacency abounds.

Wednesday, August 30, 2006

Oil Slips, Market Blips

It had to happen sooner or later. I'd like to proudly announce the Technically Speaking Shameless Commerce store. There's just a few odds and ends there to proudly display your bearish disposition. Enjoy!

Even though the market rose again (grrrrrr........) my bearish portfolio rose too (hurrah!) mainly because I have so many oil shorts. Oil fell nicely, but it still hasn't broken its neckline. The magic number on the OIH is 130, folks. Go, OIH, go!


Did the S&P 100 double-top as of today? Only time will tell. I think almost everyone who reads this blog is sick of waiting for the market to run out of steam. I certainly am.


The $NDX (NASDAQ 100) is kissing the underside of its former supporting trendline. In fairness to the bulls, it seems the NASDAQ Composite ($COMPQ) overcame a similar trendline today. Here's the aforementioned $NDX.......


If you want to see proof of the volume withering away in this summer market, look at the SPY graph below. It isn't just a "last week of August" situation. For three whole months the volume has been shrinking. How's that for divergence when compared with the price action, eh?


The $VIX is screaming "complacency." It just grinds lower and lower. I guess people expect boredom and smooth sailing until we have active colonies on Mars.


A reader wrote and asked me to take off the bearish headpiece and point out a couple of bullish charts. I'd be happy to do so. The American Stock Exchange's Major Market Index ($XMI) is really good looking. The only reason I wouldn't rush headlong into buying this is because it's a freak. All the other major index charts look neutral at best. But, on its own, this is a fantastic looking chart for bulls.


As for an individual stock, it's not going to make anyone multi-hundred percent gains anytime soon, but Genentech (DNA) has been very firm. A nice saucer shape has been forming.


Now go buy a t-shirt! And I'll see you tomorrow......

Bulls Free to Run

Good morning.

There is - unfortunately! - a fair bit of "open space" for the bulls to roam upward. There's really not much in the way of overhead resistance on the major indexes and, by and large, there's a decent amount of space between current prices and the next Fib level up (which is where they peaked last May). Not a great setup going into what is usually a "bear's month", September.

Take the $SPX (please!) I've marked in yellow the wide open space that bulls could trample upward, if they've got it in them (and, in the past month, they certainly have).


Much the same can be said of the Dow Industrals.


The NASDAQ is a bit more of an exception. It's approaching a fairly substantial trendline from down below.


Being exasperated gets old. I'm just going to keep sitting and puzzling. Weird, weird market....

Tuesday, August 29, 2006

Fingers of Instability

A reader of this blog (Old Soldier) was kind enough to forward me a fascinating article by John Maudlin called Fingers of Instability. It'll take you a little while to read it, but I highly, highly recommend it. It's fascinating.

Extracted from the Comments section - - some other interesting tidbits about the housing bubble and the credit which made it possible:


  • 32.6% of new mortgages and home-equity loans in 2005 were interest only, up from 0.6% in 2000;
  • 43% of first-time home buyers in 2005 put no money down;
  • 15.2% of 2005 buyers owe at least 10% more than their home is worth (negative equity);
  • 10% of all home owners with mortgages have no equity in their homes (zero equity);
  • $2.7 trillion dollars in loans will adjust to higher rates in 2006 and 2007.

Monday, August 28, 2006

Just For Fun

The Dow was up over 100 points today but then started to ease back to close up 67 points. One reader was puzzled by my mention of the market being in the 'doldrums.' I guess the Dow up that much isn't exactly doldrums, but my portfolios were basically unchanged. So it was pretty boring.

Just for kicks, let's take a look at some of the mentality back in 1999. All these books were published within months of each other in late 1999. Great lesson in contrarian thinking........


Not to be outdone.....


And then, in a desperate bid for attention......


Where was the Dow 1,000,000 book? I guess the market crashed too soon.

In last Sunday's NY Times there was an amazing article on the real estate bubble. I know this is a really tired subject, but this one graph is breathtaking. The latest surge in real estate completely dwarfs anything seen in the U.S. (...said the man with two overpriced houses in Palo Alto, California). Scary, scary stuff:

Last Week of the Doldrums?

The market is up fairly substantially this morning (Dow +75 points as of this writing), but my portfolios are pretty much unchanged. The reason is that any losses are being offset by my shorts in oil- and gold-related stocks, both of which are having a down day.

The market has been in a low-volume funk for a long time. Word on the street is that, once Labor Day is passed us this weekend, we'll return to normalcy. I sure hope so. These markets are really dull right now.

The S&P 500 is terrifyingly close to crossing its 78.6% Fib retracement (sort of the last holdout....) at the 1303.80 level. It's less than a point away from it now. Not the end of the world if it crosses it, but it puts another thumbtack into the bearish coffin if it does.

In the meantime, here are some interesting looking short possibilities. I've put a red "stop order if crossed" line on most of these........

ADBE:


DRQ:


EOG:


HAL:


MCK:


RIG:


XAU:

Friday, August 25, 2006

How Many Ways to Say "Nothing"?

Each day I read fellow analysts Charles Kirk (of Kirk Report fame) and Michael Kahn (of Barron's fame). I notice they're in the same predicament I am.....how many different ways can one say, "there's nothing else I can say!" Posts are getting smaller and shorter every day!

Honestly, this has been a completely boring week. Everyone keeps saying all the traders are on vacation. Is that really the case? It's astonishing to me that an entire stock market can be so dulled by a portion of people taking their summer vacations. Oh, well. The volume is more telling than my opinion.

If a light strikes me this weekend and I think of some more good graphs to share, I will. In the meantime, here are a few interesting charts from my forthcoming book. Make of them what you will! (They're from the chapter on Head & Shoulders patterns)


Full Body Cavity Search

If you're ever going through airport security and you spot this Dell laptop.....


be sure to say hello! That would be me.

Thursday, August 24, 2006

A Watched Pot (Again)...

Oh my LORD the stock market is boring lately. Sheesh! I've elected to put up a YouTube movie of paint drying (with grass growing in the foreground) since it's more enticing.

So I'm just going to toss out some more interesting short ideas. The first of which, BBBY, I offered a few days ago, and it's started to leg dow nicely.


CAT (getting near the end, or a trendline break instead?)


CERN


MRO


MCK


MSTR

Wednesday, August 23, 2006

Are We Finally Turning Around?

Below is the intraday S&P 500. Does this look like a top to you? At least for the short term? I think so. I sure hope so. An honest to goodness down day was a pleasant change.


The $VIX has been ungodly low lately, and that also seems to be turning around. It sure makes put options cheap at these levels.


The Dow lost a little more than 40 points today. Looks like it's backing away from that ascending trendline.


The NASDAQ 100 bounced away from its own trendline beautifully......


On a daily basis, the S&P 500 has been quite strong medium-term, but so long as that trendline holds, we've still got a bearish disposition on this one. As always, click on the image to see a much bigger one. This chart is loaded with embellishments, which I hope make sense to the most of you.


Gold hit a medium-term high today before turning around into a loss. This could turn out to be a beautiful short, but it's going to take a couple of months to see. It's been unpleasantly strong until today.


The $XMI has either hit resistance for the third time or is about to produce a marvelous breakout (for the bulls......) This could be a great cup with handle pattern, or we could simply be bouncing off that resistance line again.


Here are positions from two of my accounts (I've got others, but I couldn't fit all the symbols on the screen.......) This time I'm using symbols to make it easy on you.

Your Morning Inspiration

Tough markets call for tough inspiration. Start your day right with two of my favorite clips of all time. The Alec Baldwin speech from Glengarry Glen Ross and R. Lee Ermey's brilliant scene in Full Metal Jacket. Enjoy!

Tuesday, August 22, 2006

Socionomics and Frank Quattrone

For those who didn't notice, Frank Quattrone basically got a walk for whatever his sins of the past may have been. I think fans of socionomics may seen a bit of a pattern here. When the market was insane and sky-high, Quattrone was a hero. When the market took a huge dump, he was a villain.

Indeed, do you want to know when his trial was? That's right - October 2003- the bottom of the market.

Now that the market is - yep - insane and sky-high again, society gives him a walk. Coincidence? I think not.


Also, a tip of the hat to The Kirk Report. I appreciate the mention!

Monday, August 21, 2006

Empty Motion

Yawn. Oh, is the market closed now? OK. Yeah, the market was down a bit today. Big deal. There's still clearly no firm direction.

I've noticed things have become so placid that there are instances where puts many months in the future are basically free. Take a look at the chain below. At the time this was taken, the intrinsic value of a $30 put was $6.61. And what's the bid/ask of the April 2007 put? 6.60 by 6.70. (The 5 contracts you see are mine - I was the only volume). Notice also that the ask price is the same month after month. How's that for low volatility? If you take a look at the stock chart, you'll see maybe it shouldn't be so...


And what's the most boring stock of all? How about multi-billion dollar powerhouse Google? This used to be all the rage. Now it's just sinking into a modest sine wave of nothingness. Look at the past ten months on a percentage scale, shown below. 0% change. Whoo-hoo!


Here are a few more short ideas on this otherwise ho-hum day........Adobe (ADBE):


AIG International (AIG):


Black & Decker (BDK):


Chicago Mercantile Exchange (CME):


And even Microsoft (MSFT) which seems to be bumping against the other side of its long-ago broken trendline.