Friday, September 29, 2006

Give It Up!

“To the last, I grapple with thee; From Hell's heart, I stab at thee; For hate's sake, I spit my last breath at thee” - Melville

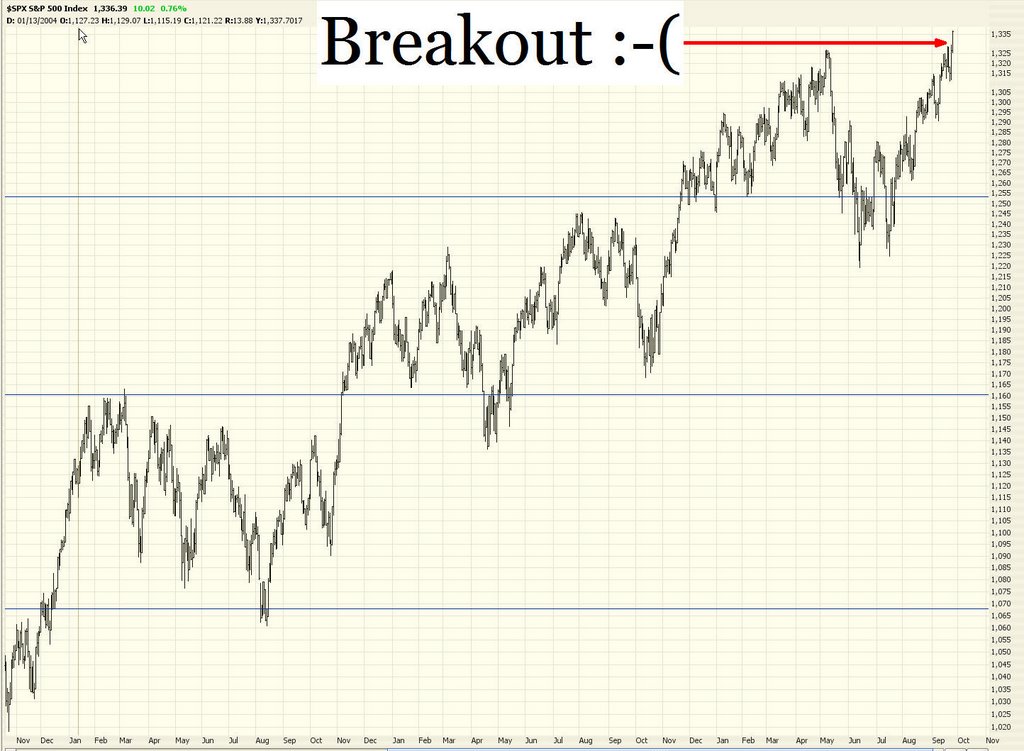
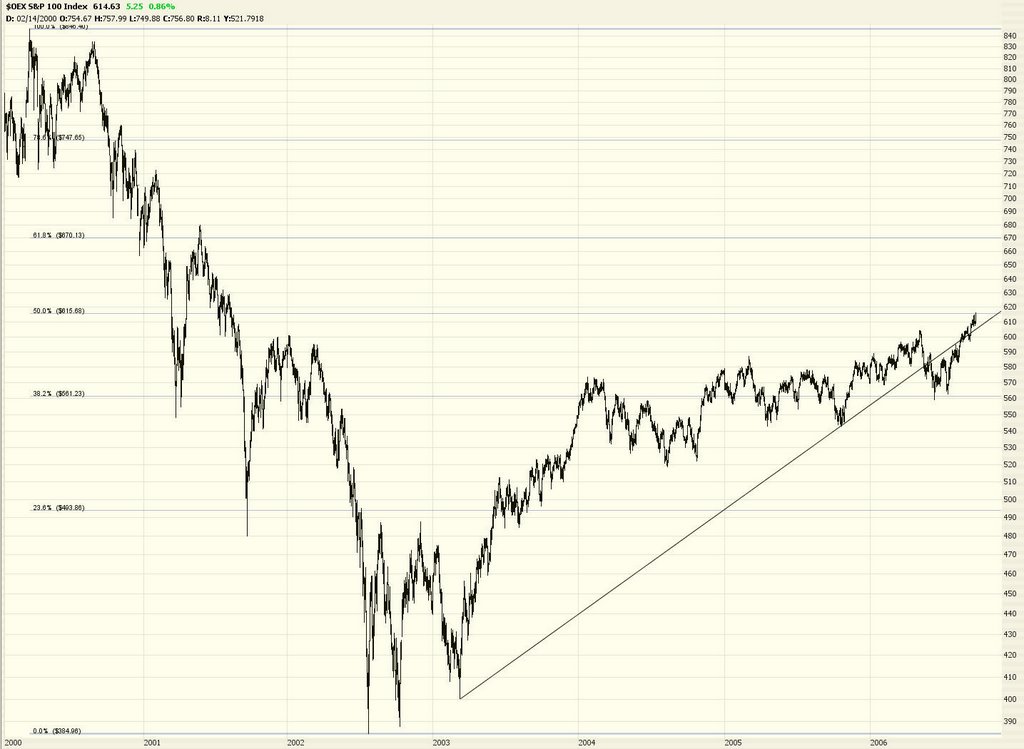
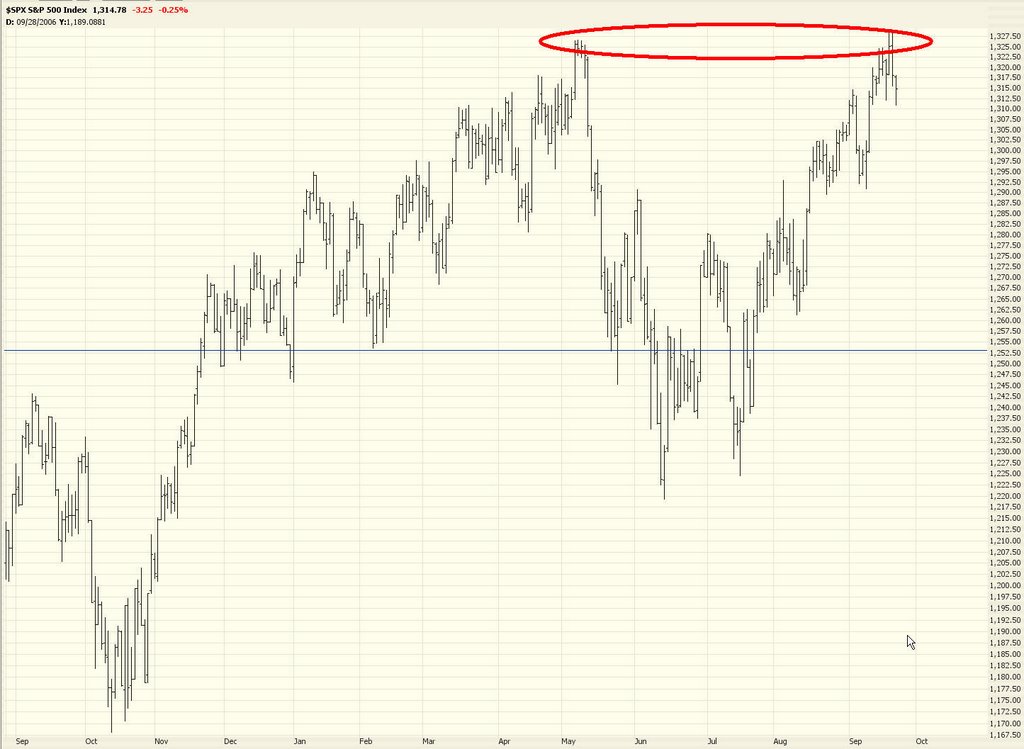
Well, bulls, you had all week to try to make your new high, but it didn't happen. In spite of having the entire world on your side, as well as CNBC, you couldn't pull it off. I saw some articles torture the data so they could try to make news out of the week. For instance, I read that the high price on Wednesday exceeded the closing price from January 14, 2000. And they tried to spin that as a "new lifetime high." Who cares? Give it up!

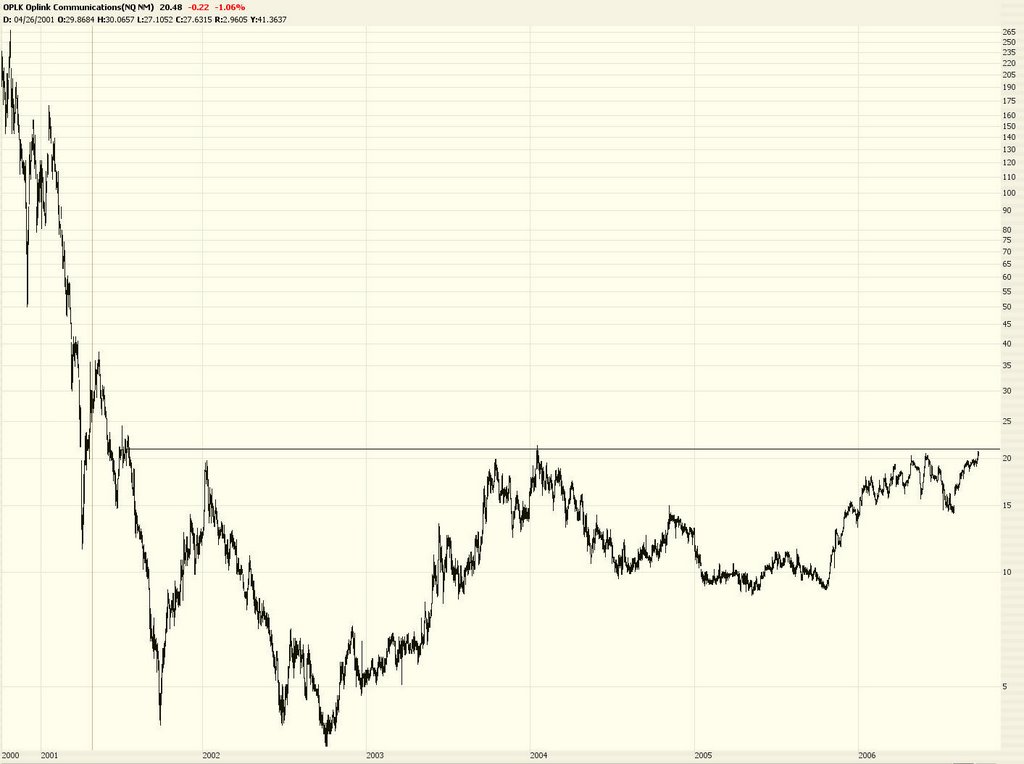
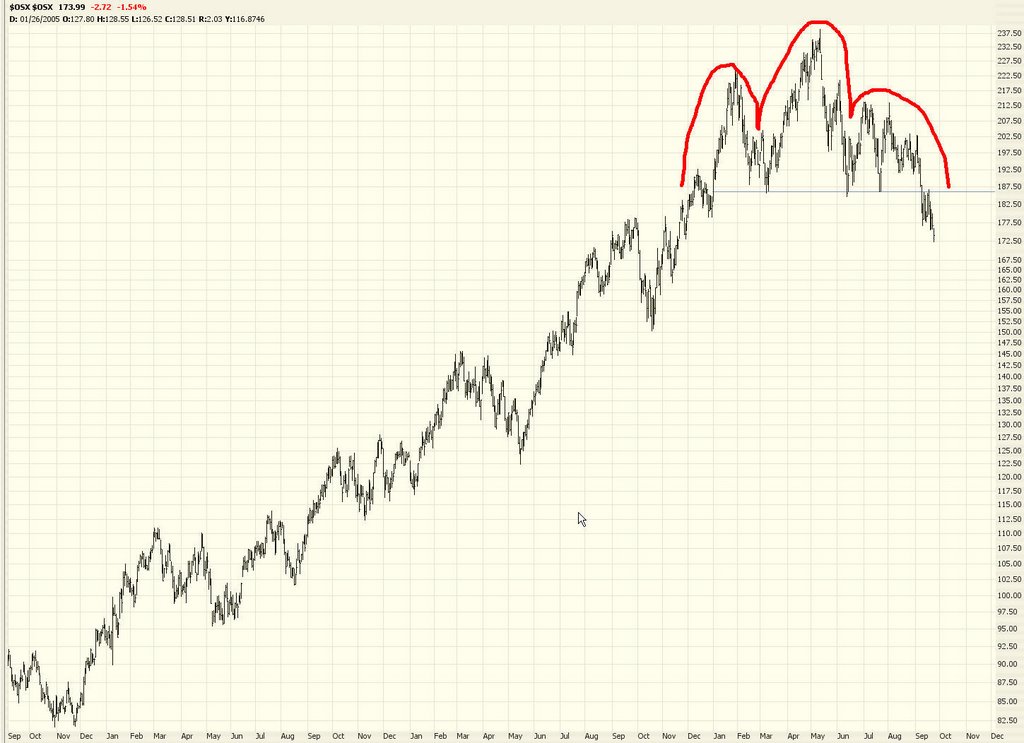
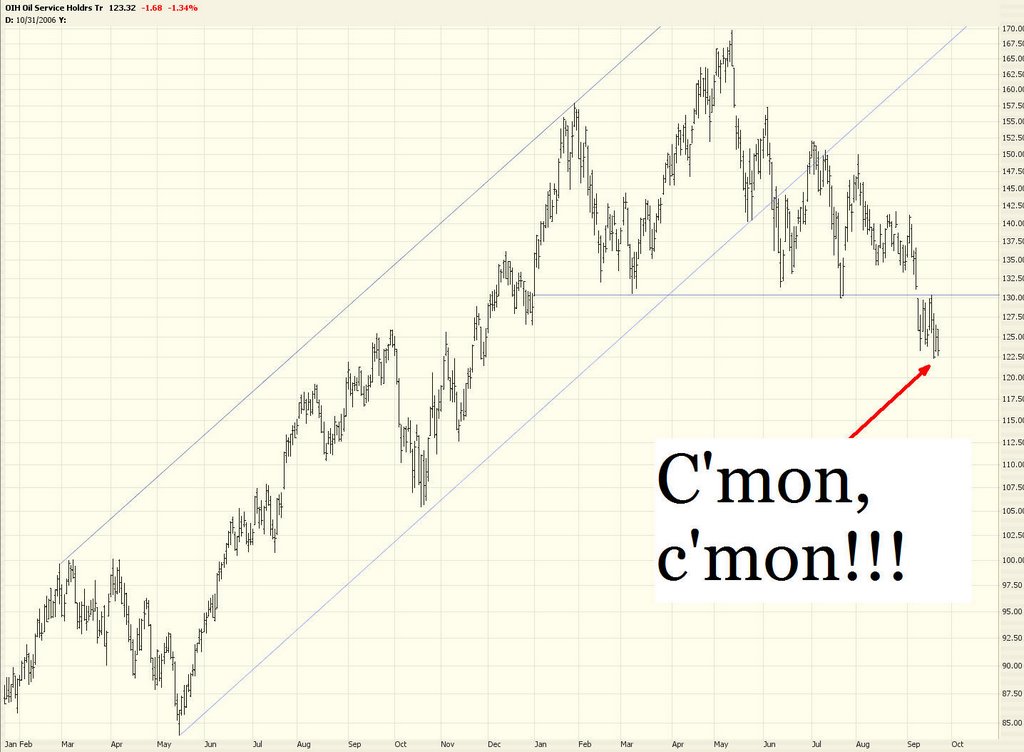
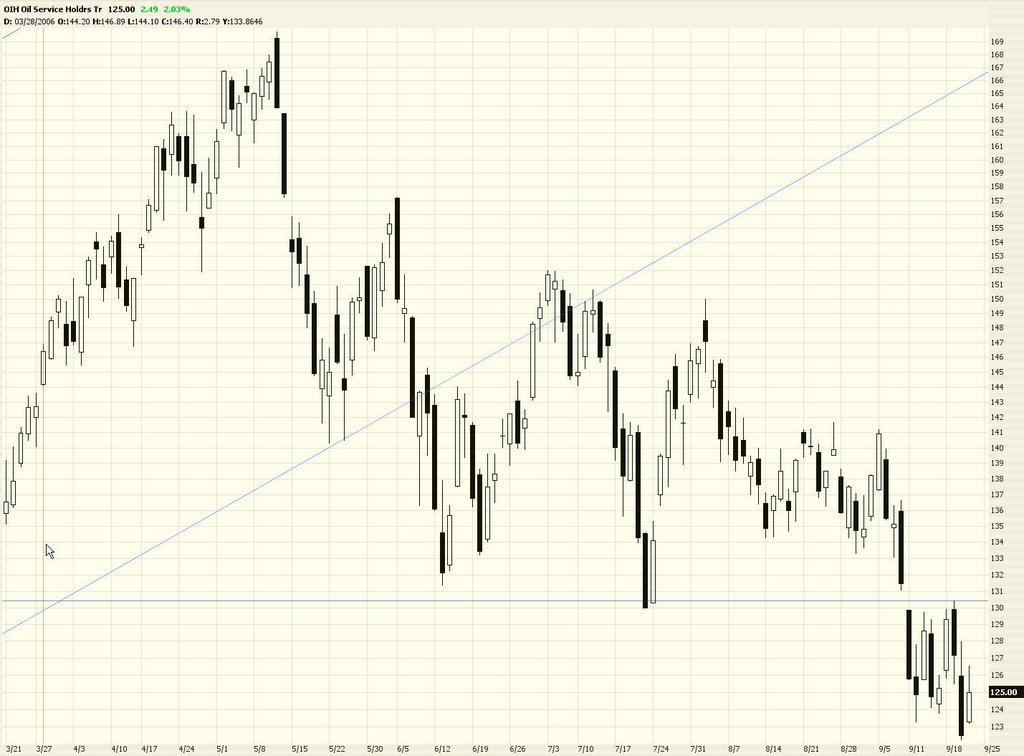
Before going into stocks, let's take a peek at our beloved OIH. I wasn't too happy with today's action. My 131.07 contingent order didn't get taken out, but I'd prefer seeing the price fall away from the retracement. We're still in play, however, and so long as we don't violate our stop, we remain positioned in puts galore.


The Federal Government started hiding the M3 figure earlier this year, but some intrepid souls have been able to compute it in any case. The graph below illustrates how the Feds have poured cash into the economy to keep things floating. They're eventually going to run out of this fuel, you realize. This house of cards can't stay propped up forever.


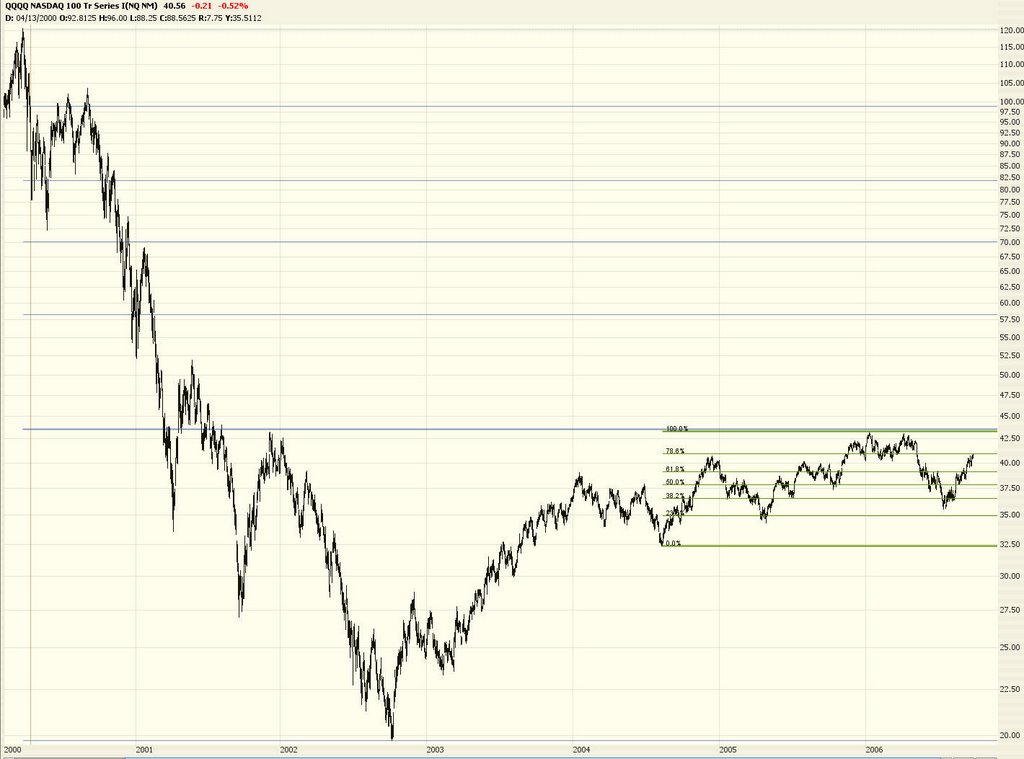
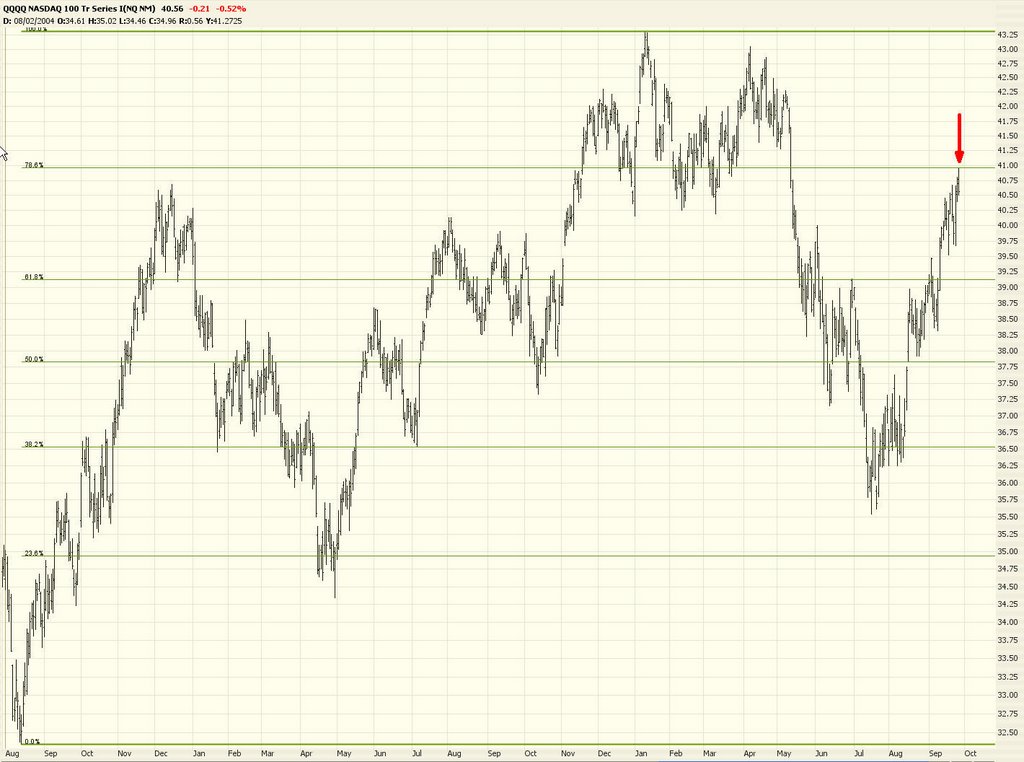
I've got puts on QQQQ and $NDX. Today was a nice bearish engulfing pattern. In mid-July we had a different (bullish) candlestick, the hammer, which proved quite prescient.


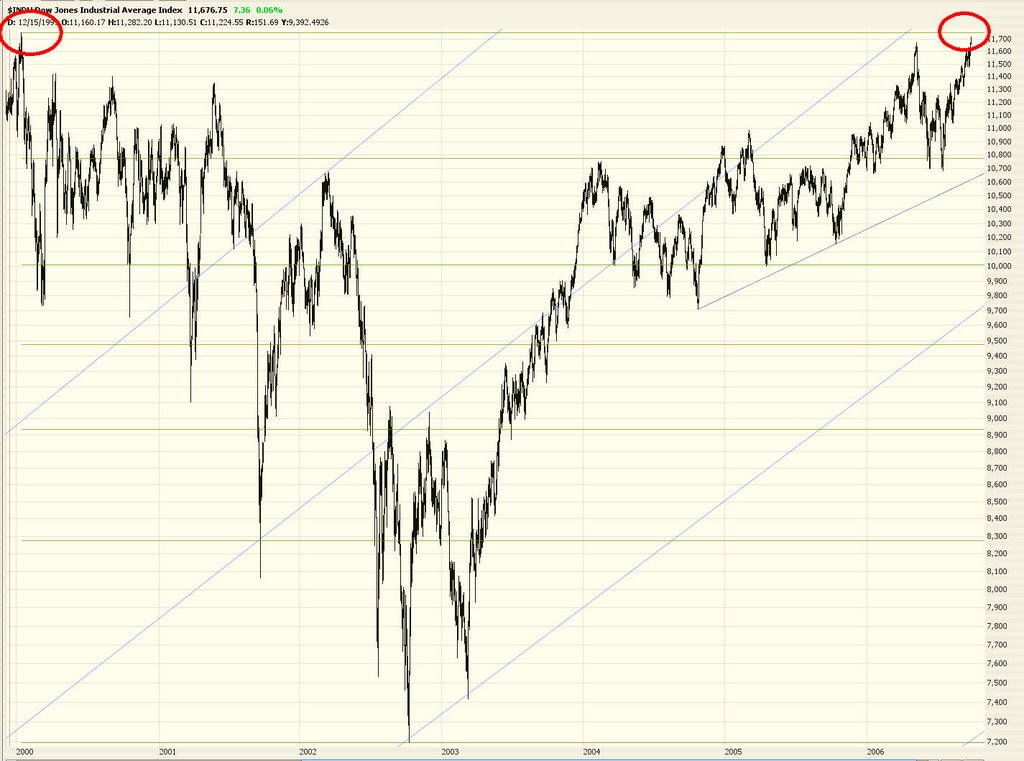
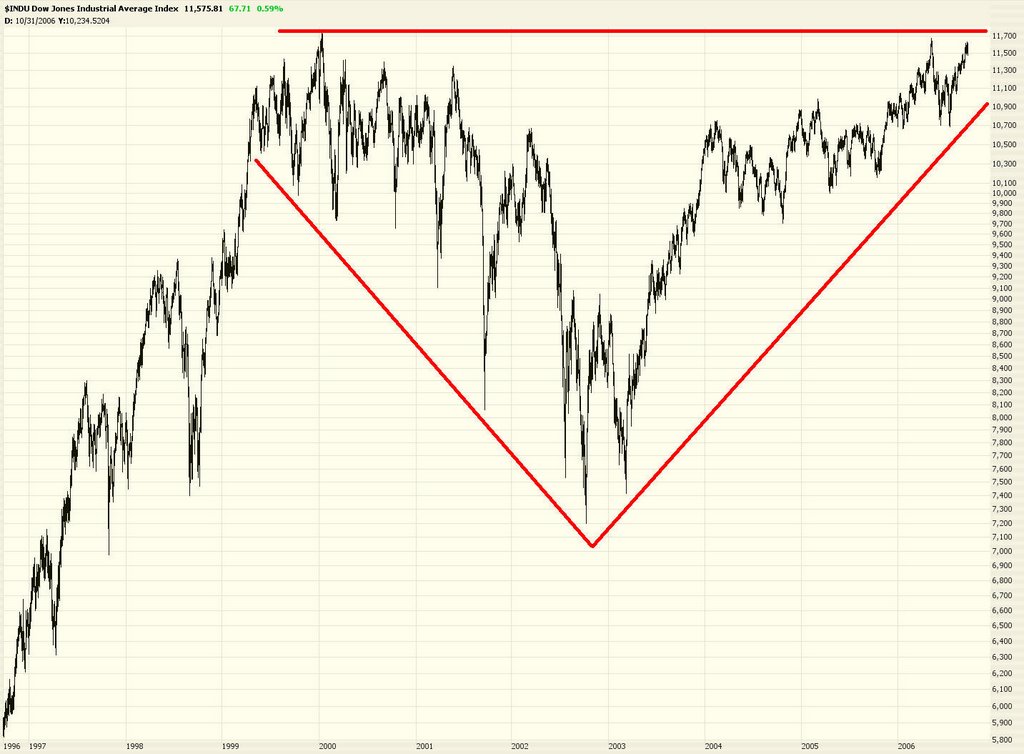
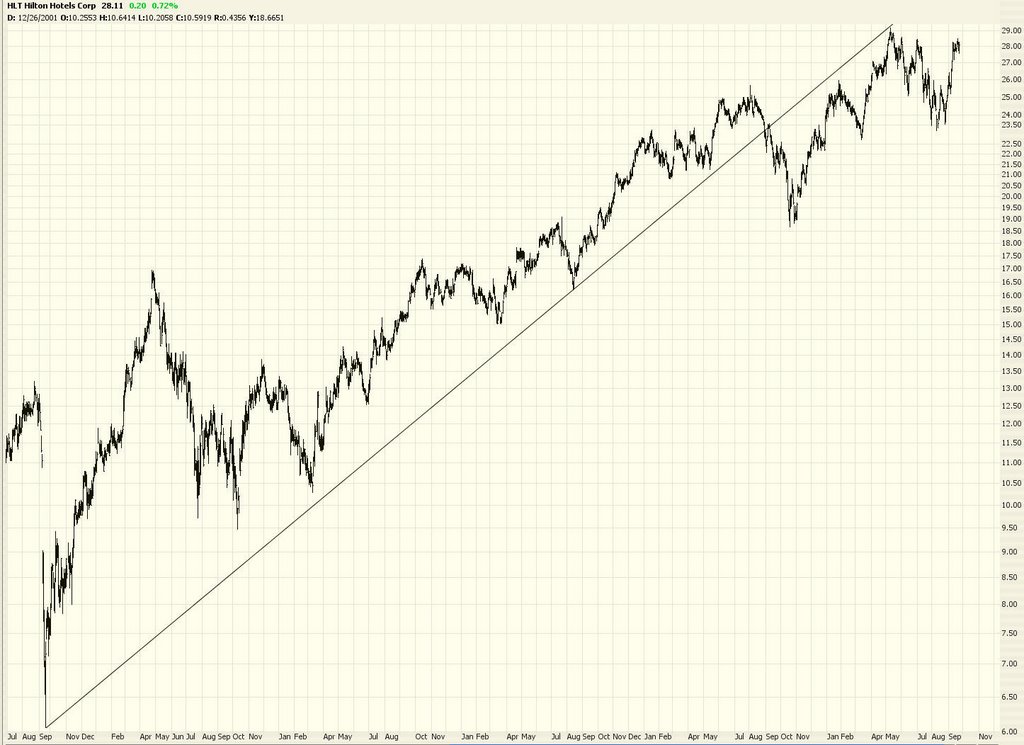
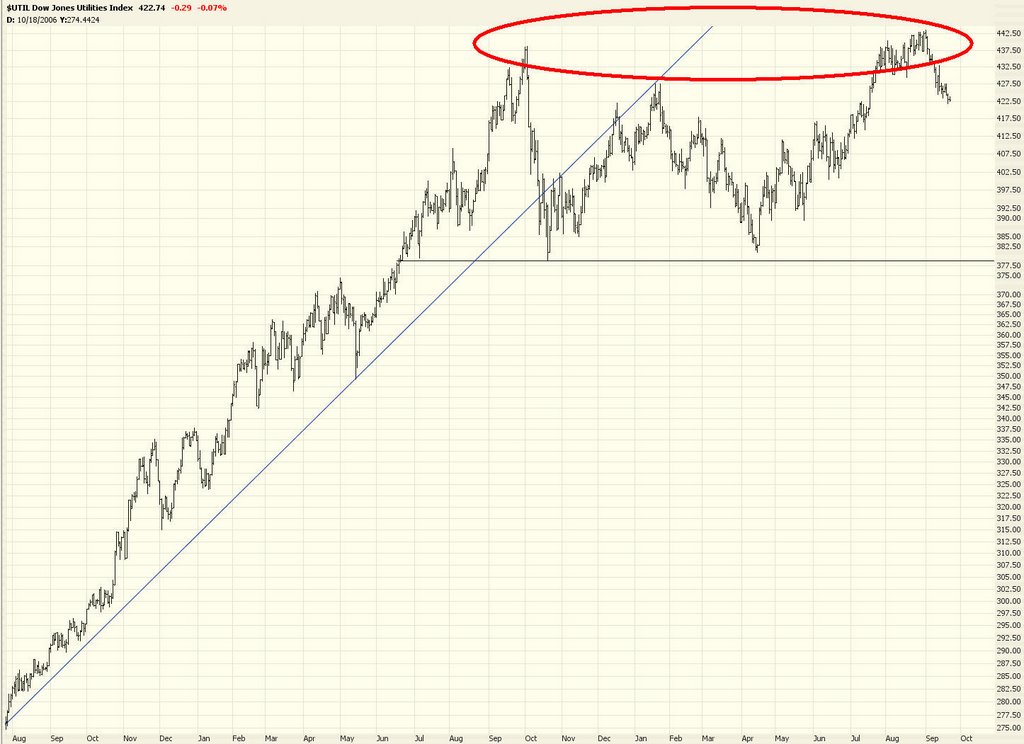
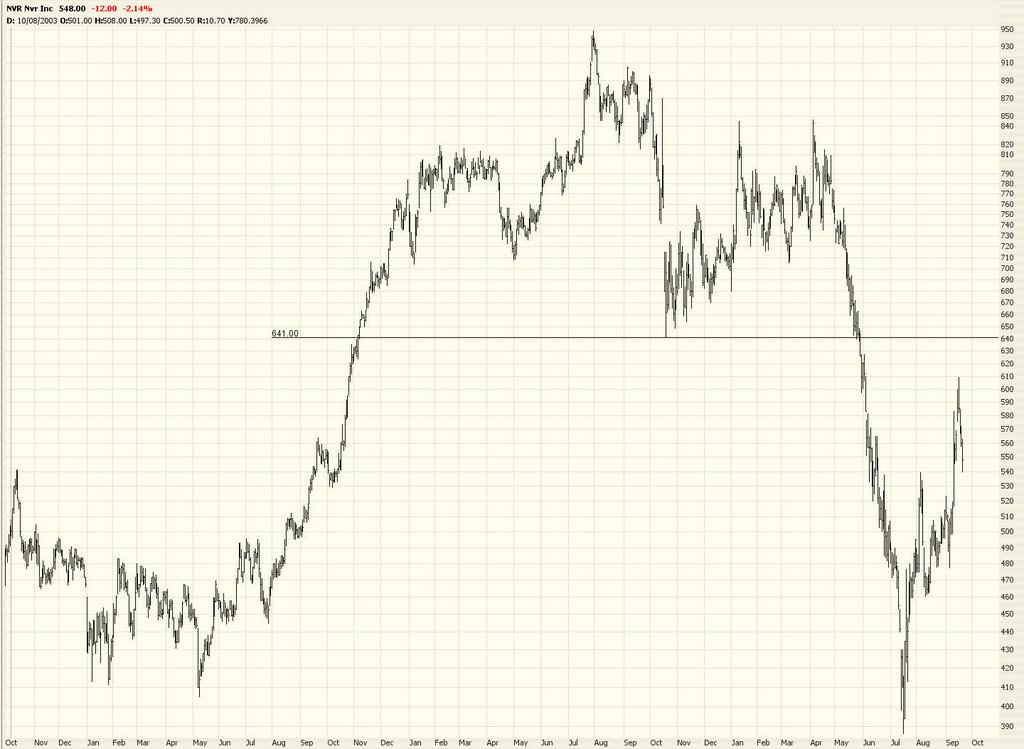
The Dow, which is what everyone has been watching, fell 40 points today. It came within 9 points of its all time high at one point. Hey, bulls! Psych! All the same, there's no doubt the past few years have been good to them in general. Notice the huge push up in 2003 and the less pronounced push up since then.


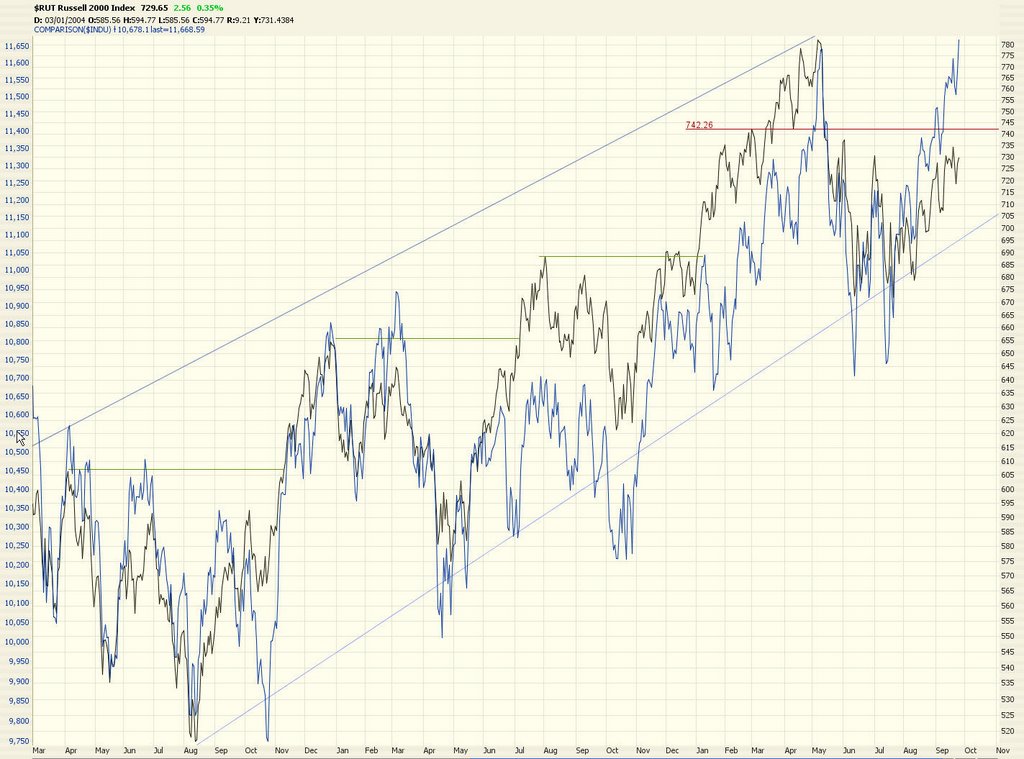
I am trusting Mr. T to keep the markets down on the Russell 2000. The most recent horizontal line drawn is my line in the sand. We want to see prices fail below this line to affirm the death of the bull market.


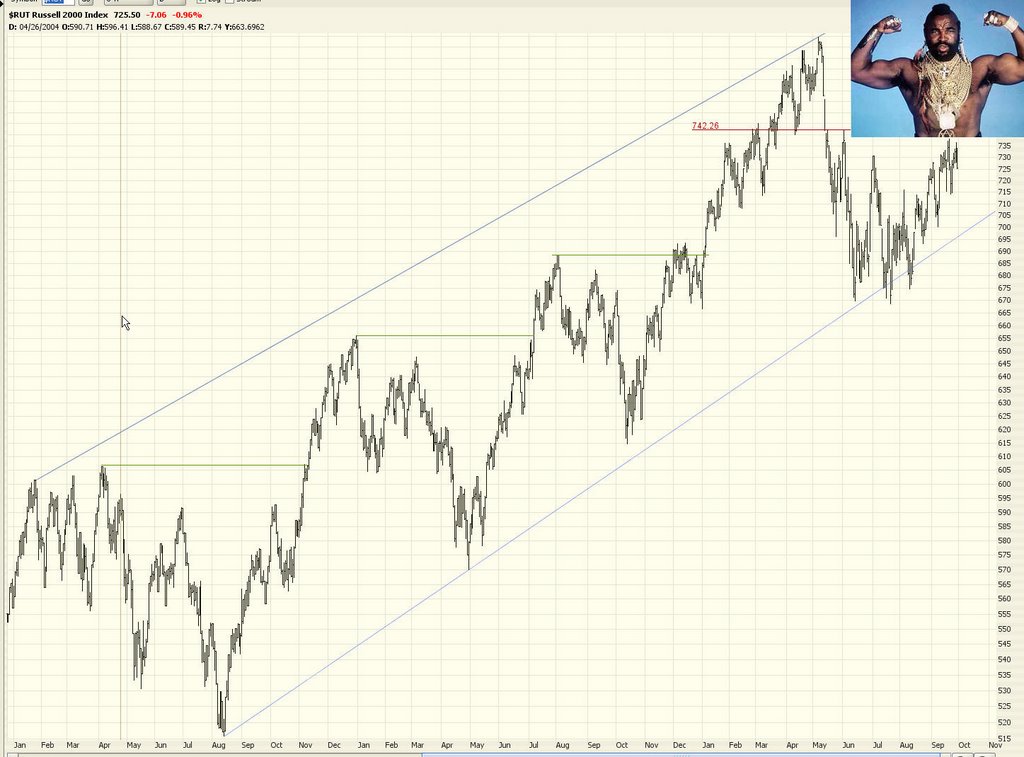
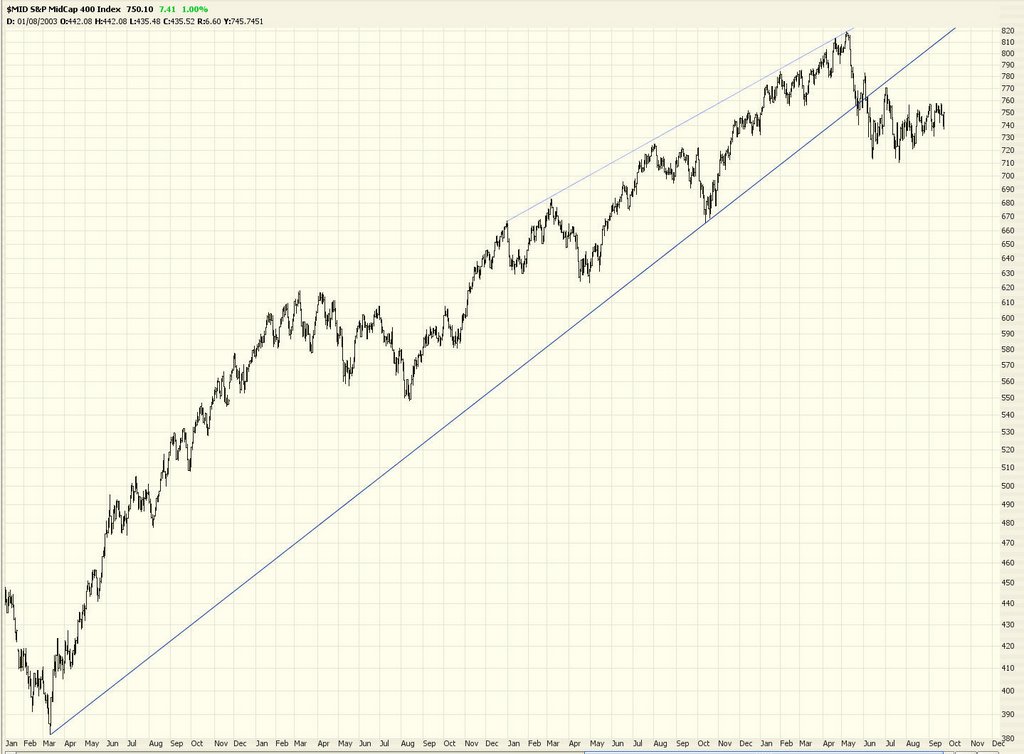
Meanwhile, the $XMI, which had the most bullish of all the index patterns, seems to be pooping out.


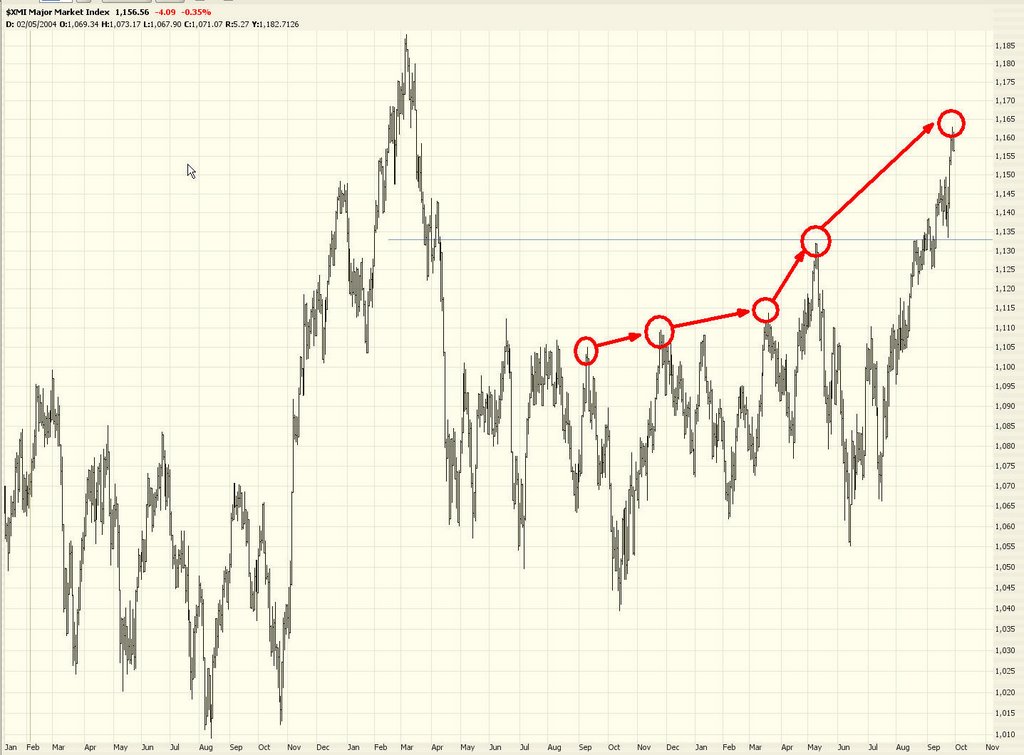
Now for some specific stocks on which I own puts and obviously feel good about from a bearish perspective. Cummins (CMI):


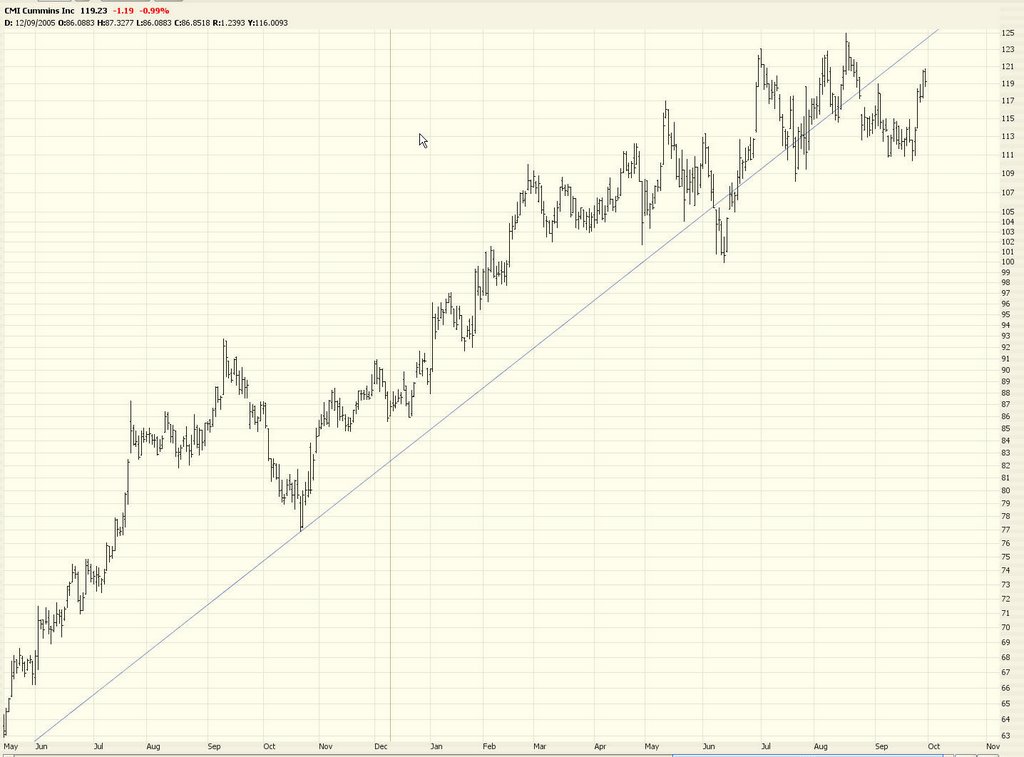
Capital One Financial (COF):
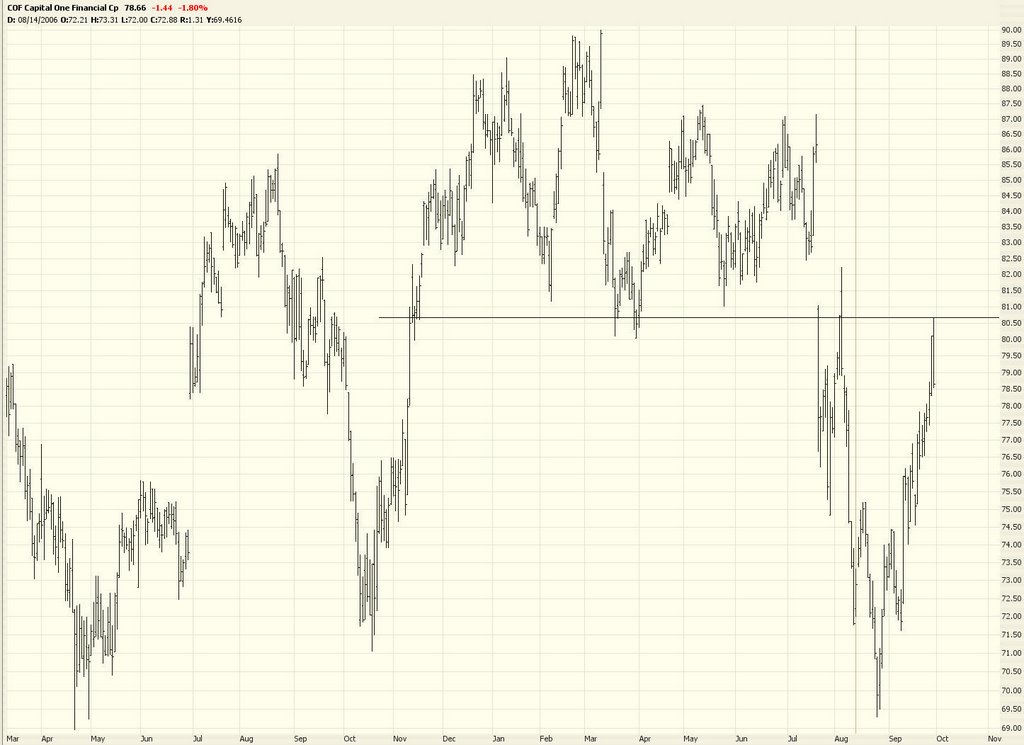

Monsanto (MON):


Panera Bread (PNRA), which a blog reader said was too dangerous to short. Well, so far, so good.


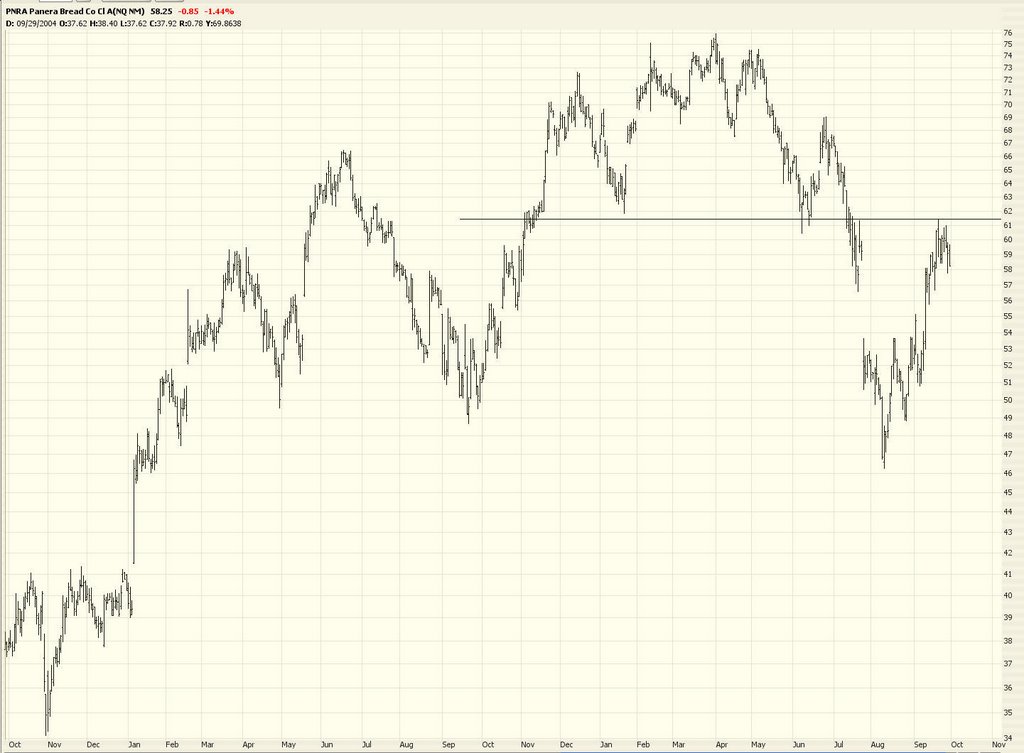
And old favorite Sears (SHLD). I mean, come on, people. It's Sears. Have you walked around a Sears lately? Not unless you're shopping for a lawnmower or mattress. What a hole!


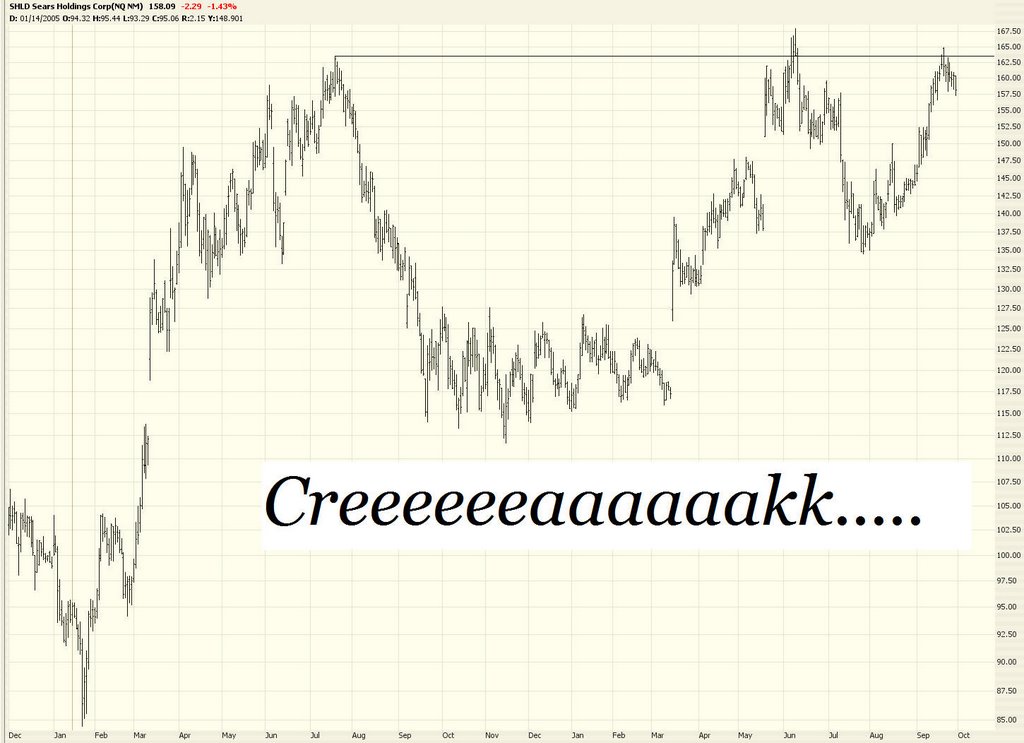
See you next week. Victory, come visit us in October!

Thursday, September 28, 2006

Let's Get This Over With!

OK. Please get to a new high, Dow. Please! I'm so sick of this media obsession. Get it done. Cross over 11,750, even by just a point or two, and let's move on with our lives. That would probably be enough to start a sell off.

Once again, the market wasn't able to grab the brass ring today. It got within 22 points this time.


Watching the intraday on the $INDU over the past couple of days is really interesting. You can see very clearly the shoving match going on. The bulls made a breakout happen today, briefly, but it eased back again. The vast majority of people (like 99.9%) want to see a new lifetime high. That would be big, easy news.


For me, all I can say is one word: oil. Specifically, OIH. I'm sick and tired of stocks right now - - general stocks, at least. OIH and those related to it are doing great for me. I'm going to ignore the madness and focus on oil. My stop on OIH is any price over 131.07. The high today was 131.00, and it eased off from there. Phew!

Wednesday, September 27, 2006

Pfft.

I'm not sure if you've heard, but the Dow came within 30 points of its lifetime high set on January 14, 2000. That's right, you heard it here first. Or perhaps this is the 5,000th time you've heard it, since everyone in media is jumping up and down about this non-event. The bulls didn't pull it off today, but good try, buddy....


Looking back over the past decade, you can see what a wide range we're dealing with here, spanning nearly 5,000 points from 7,200 to 11,500. What would you rather be doing right now - buying or selling?


This obsession with Big Numbers isn't new. From 1966 to 1982, Dow 1,000 was all anyone could talk about. Take a look at this article from Time magazine 40 years ago.....click the image so you can read it, particularly the highlighted parts.


Things don't really change at all, do they? Here we are, 40 years later, and in the face of an unpopular war, tax concerns, economy concerns, and all the rest, the Dow is blasting to ungodly highs. Check out what happened after this article, though, marked by the arrow.


Six years later, as Dow 1,000 was approached yet again, we can see the obsession had not died down. This kept happening until 1982, when Dow 1,000 was cut through once and for all and became a dead obsession. Now we've moved on to Dow 11,750 as the new obsession!


Take a look at something really interesting, though. Here are the QQQQs with retracements drawn. Notice how they peaked exactly at the retracement point.


But here's an even more interesting point. Zoom in to a smaller retracement, and notice what happened today. It touched the 78.6% retracement to the penny. The fact that the $NDX actually went down today in the face of all this excitement is telling.


I tried to look for any stock worth buying - - anything at all - - and came across this one. This is how deeply I had to dig, coming up with something deep from the bottom of the barrel. All the same, it's an intriguing pattern.


Well, two days of window dressing left in this "month of the bears." September, you have really blown it. You're fired.

Tuesday, September 26, 2006

The Dow Moans

Sung to the tune (briefly) of "Try to Remember" from The Fantasticks:

Try to remember the kind of September
when bears would rule, and bulls would burrow

Try to remember the kind of September
when stocks would tank, and bonds would follow

Try to remember the kind of September
when you were a wealthy and ursine fellow

Try to remember and if you remember, then follow.....


Well, another session, and the bears got totally owned. Jesus H. Christ. To quote the philosopher C3PO, "Will this never end?" September has completely lost its place in the heart of bears as lovely. This month is totally in the hands of the bulls. We're getting our skins handed to us.

As the media wasted no time in reporting, today brought us within 60 points of the all-time, peak-of-the-Internet bubble high for the Dow Jones Industrial Average. Maybe the lifetime high event will happen tomorrow. My gut turns thinking about the jeans-creaming that's about to take place over that one.

The S&P 500 broke out, no doubt about it. This is nasty. Both the $OEX and $SPX have shown indisputable strength lately. Chilling.


If you compare the Russell 2000 with the Dow, you can see how weak the small caps have been lately. I've got puts on the Russell right now. (This is a Left Scale/Right Scale chart shown by the resplendent ProphetCharts, the greatest charting platform in the world.........)


AutoDesk, recommended here recently, took a tumble today - - which is nice considering the push upward in the market. Fib fans are guiding the way with this one.


McKesson looks sharp. I've laid down some Fib fans on this one too. Me likee.


I still feel good about my SHLD puts. This is a fantastic, gorgeous, bullish cup with handle pattern, yes. I know that. But my nose is twitching about this one. There's just something about it, particularly its inability to join the recent bull party. Plus the risk is very limited, since the stop price is so brain-dead obvious.


Better luck tomorrow, ladies and gents. Remember: everyone hates the bears. We're the underdawgs.

Monday, September 25, 2006

Bad News Bears

Today started off well enough. The market's modest rise in the morning got blown to smithereens by the drop in housing prices (for the first time in 11 years), and oil services was down hard. It was enough to make a bear's heart go pitter-pat.

Sadly, the bulls took charge and stampeded most of the day. The Dow was up over 100 at one point, although it eased back to close up "only" 70 points for the day. OIH, $OSX, and other oil-related stocks formed hammer patterns, signaling a short-term bottom. So what started off as an "A" day wound up a "C-".

Let's take a step back and look for the past decade at the Dow 30. You can see why people don't really know what's going to happen next. We're at the very top of a large upside-down triangle. Busting through lifetime highs would take ungodly strength (and would cause me to jump off the nearest bridge). Sinking into another stairstep-down pattern seems completely elusive at this point, although that's the only thing that will make this "our" market.


The SPX, a broader index, isn't nearly as close to its lifetime highs, but it certainly received the "all clear" signal from the bulls today. There is a meaningful amount of upside between the current SPX price and the next Fibonacci retracement level. That isn't good news for us bears at all. Today is the kind of day that shows the bulls are still firmly in charge, even in September, historically the weakest month of the year.


The $OEX is pretty much perfectly at the 50% retracement level.


The $MID to me is looking sort of alluring as a potential put purchase. The stop price is pretty tight. Mind you, today's action is not encouraging. But if it's a one-day wonder, looking for shorts at these lofty levels is a good exercise.


One honest-to-goodness down market that's been really good to me lately is oil. The $OSX, shown below, is very similar to the OIH, and you can see its squeaky-clean head and shoulders pattern. Things might have bottomed out for the short term (like the next week or so), but it's been great so far.


I recommended Massey Energy, for example, weeks ago. It has taken a terrific tumble.


But take a look at today's candlestick pattern. A honkin' big hammer. That spells short term bottom to me.


The NASDAQ 100 is extremely close to the make-or-break point for bears. Crossing above the line shown here would spell bad news for at least a little while for the bears.


Hilton (HLT) caught my eye today as a short candidate.


As did NOV, which is in my (obviously) favorite pattern, the H and S.


For those skeptical about the still sky-high REIT market (in spite of all the bad real estate news), take a look at SPG.

Saturday, September 23, 2006

The Case for a Double Top

It wasn't a bad week. The bulls wanted this to be The Week of New Highs, but it was not to be. The more we can take away a new prize for the bulls, the more discouraged they will get. Which, let's face it, is all they deserve.

Oil is tantalizing close to an all-out breakdown on OIH. Within pennies, really. I like what I see.


As I look at the major U.S. stock indexes, I see some pretty big double tops. Could they be rendered moot by a pierce through to new highs? Of course. But if the earnings season, starting in early October, disappoints, we may have already seen the highs for quite a while. Here's the Dow, which got within spitting distance of a lifetime high this week.


The oft-ignored but still important Dow Utilities (interest-rate sensitive) likewise has a double top, although not quite as clean.


The S&P 500 is of particular interest to me since I own so many puts on it. I'm feeling pretty good about where this index is positioned.


Here are all the positions I've got that will fit onto on screen. I manage four accounts, two of which are shown here. Every one of these has a sizeable put position. God help me. (As always, since these images can be illegible, click on 'em to see a bigger, more readable version, then click your Back button on the browser to return to this lovely little blog).

Thursday, September 21, 2006

Stop New High Mania!

They just couldn't let us have a triple digit down day, could they? The Dow was down about 115 points earlier, but we closed down 80. Oh, well. Not a bad day, particularly since the media is all ga-ga over the possibility that the Dow is within spitting distance of an all-time high. It would be nice for that not to happen.

My portfolios were up today, but not as much as they might have been if oil had cooperated. OIH was up about 2% as oil and related companies tried to recover from its recent bashing.


The aforementioned $INDU gave back yesterday's gains and is clearly showing some respect for that trendline that it is under.


The $RUT is hopefully stuck in a rut. That horizontal trendline is the "throw in the towel" zone, and we do not want it to cross on the upside. This is a nice bearish engulfing pattern at this point.


More short ideas. Here's DST......


ESRX, offered up a week or two ago, is doing nicely.


As is NVR, also suggested a while back.


One I discovered today was Panera Bread, PNRA.


That's it for now. As always, good luck in your trading.