Showing posts with label oih. Show all posts

Thursday, June 14, 2007

Nattering Nabobs

It's a pretty predictable trend. It the market goes down hard, the comments section is filled with kudos, praise, and huzzahs. And if the market goes up big, the comments section is filled with barbs, told-ya-so's, and permabulls. Either way, it's pretty tedious.

As I've said many times, this blog's purpose is for one person - me - to share his thoughts about the market via some charts. Nothing more. You can get ideas from it. You can take those ideas and turn them upside down (short everything I buy and buy everything I short). It's really up to you. All I hope for in the comments section is a place for other people to offer other ideas. Because there's plenty of interesting opinions out there.

Today, like yesterday, was another "up" day (although not nearly as dramatically). That's fine by me. Now, if tomorrow is up too, I'm going to start to worry. A healthy snap-back rally is terrific in the scheme of establishing lower highs and lower lows. But a continuous push higher can result in what we saw back in early March, where the allure of a drop was squashed and the market simply sashayed its way on to new lifetime highs. My view of the S&P 500 right now is along these lines:


I've got some puts on the DIA with a contingent stop at 136.16.


Symbol CEG has a nice series of lower lows/lower highs. I'm short.


Malaysia (EWM), mentioned here before, continues to look toppy in spite of recent strength in Asia.


I mentioned Goldman Sachs (GS) before. It had pushed its way to a new high yesterday, but once earnings were released, the stock fell on the news. It's not that the earnings were bad - on the contrary, they blew away expectations. But "buy the rumor, sell the news" is as true now as ever.


My puts in JC Penney (JCP) continue to do well, although nothing really great is going to happen unless/until the neckline shown on the pattern breaks. But it could be soon.


Gary mentioned my "bearish" energy suggestions; not at all. I think in passing I mentioned CVX and/or XOM for those who considered energy overbought. But I've devoted whole entries recently (such as "Sheer Energy") to the fact that this is the one sector that looks really bullish. The new high on the OIH today is no surprised, nor is the strength of such stocks as APA, SLB, and SWN.


PEG is another promising-looking stock to short, similar to CEG's pattern.


Finally, your clip of the day. This beautifully captures how I've been feeling about the comments section (especially the TTT situation). There comes a point when I just want to jump off the train.

Monday, June 04, 2007

How Now, Mao Dow?

There was a time, not long ago (like, ummm, early last week) that I would have felt cheated and flustered by the Chinese market's tumble not having a bearish effect in the U.S. But at this point, I am so utterly distrustful (and numbed) by this market that I'm not at all surprised.

The Shanghai index fell the equivalent of over 1,100 Dow points last night, and our market - of course - went up. I truly believe - and I am seriously not exaggerating - that a nuclear bomb on a major city would not cause a major disruption in this bull market. I swear to God, this market is insane, and even the death of a million people would not stop it. It has lost its mind.

So. Having said that, let's look at a few charts.

Crude oil is pushing higher. Looking at the continuous futures chart, it seems to have plenty of room on the upside.


The strength in crude is obviously good for oil service stocks. The OIH is at a new lifetime high and had a very strong day today.


I mentioned last month how bullish energy looked, and stocks like Apache (APA) have been stars.


Conversely, companies which suffer due to high fuel costs got hurt today. My short recommendation of American Airlines (AMR) is doing well.


One I don't think I've mentioned in the past on the short side is BEA Systems (BEAS).


I have, however, mentioned Bunge (BG) a few times, and this one is shaping up nicely.


Capital One (COF) is sort of stuck right now. I own puts on it, and they haven't done a thing, but I am still hopeful about this position.


Federal Realty Trust (FRT - "don't giggle at our ticker, please") looks like a clean bearish trade to me as well.


I don't mention Google (GOOG) much, but this stock looks like a strong buy (yep, buy). This chart is strong, and the volume has been inching higher. Obviously this company is an ungodly powerhouse and is doing well at the expense of poor Yahoo, which seems to be dying an agonizing death.


I bought puts on Honeywell (HON) today. Maybe a lil' double top here.


The investment banks seem to be edging south, in spite of the market's continued strength. Merrill Lynch (MER) in particular looks good for a short play.

Friday, May 18, 2007

Sheer Energy

Another record. This is getting really monotonous.

One index that hasn't actually reached a new record, but is within a hair's breadth of it, is the S&P 500. It peaked back in January of 2000, and if Monday is up at all, it will almost certainly reach a new record closing high (and I don't need to tell you the financial media will make a huge stink about it).


The $VIX remains very, very low, indicating widespread complacency. You can see how the VIX deteriorated from 2003 through 2005 and has remained low ever since. There was a time when the normal VIX range was between 20 and 50 or so. These days, it's lucky to even stay in the teens.


Real estate has been getting hit, in spite of the market's overall strength. I've got a number of real estate shorts, one of them being AIV.


Akamai (AKAM), which I am short, went up some today, but I am still comfortable that this pattern is safely beneath its neckline.


One days like this, if you see major stocks with weakness, that's usually a very bearish sign. The CME is a good example.


InfoSys (INFY) is an even better example, since its pattern is more clearcut.


The thirty stocks which comprise the Dow 30 Industrials have obviously been very strong, by and large. MMM is no exception, although it seems awfully lofty right now, and it is sporting an impressive shooting star with today's action.


Energy has been incredibly strong. I've mentioned some oil service stocks here recently as good bullish plays. But even looking at the general OIH stock, which represents an amalgam of oil service securities, you can witness the terrific strength lately.


PSB is an other short of mine that has been enjoying the real estate tumble.


Finally, VNO is another participant in the real estate slump, and it features a really nicely-defined head and shoulders pattern.

Monday, April 16, 2007

And So It Goes....

The bears continue to get shot in the head, one by one. The comments section of this blog is a mix of insightful commentary (from both sides) and sophomoric crap from permabulls. Of course, if the market was in a freefall, there would be sophomoric crap from bears like me, so I guess it all evens out.

Many indices and ETFs made lifetime highs today. Not yearly highs. Lifetime highs. Never-before-seen, higher-than-the-bubble highs. Get it? Look at MDY, SPY, $MID, and many others. We're into unchartered bullish waters. The $INDU, while not yet at a lifetime high, is threatening to make the highest level seen in years.


The $OEX pushed above a formidable Fibonacci level today. There's a large opportunity for this to push higher, based on the next Fib level.


The Russell 2000 also pushed to a lifetime high today. It, like the $INDU, is just kissing the underside of the broken trendline.


I mentioned recently that FMT might be a good bullish play. That turned out to be true. The stock was up over 30% at one point today.


Energy continues to be strong, as I've suggested it might many times recently. Here's the OIH.


About a week ago, one of the folks in the comments section asked about ONT. I responded in comments that it looked great, and I repeated that in the next night's post. Although speculative, this stock is doing amazing things, and the volume backs it up.


Energy play Schlumberger (SLB) continues to be strong. I point it out here due to its size and especially strong performance.


I guess one might joke....."How does one make a small fortune being a bear?" Answer: "Start with a large fortune." Things look grimmer than ever for ursine types. Valuations don't matter. Common sense doesn't matter. All the bearish arguments you've heard don't matter. All that matters is that (a) a lot of people with (b) a lot of money (c) don't know what else to do with it. So we go up and up.

Thursday, April 12, 2007

B.T.D. or ABC?

The debate raging around U.S. equities these days seems to fall into two camps (for technicians, at least). Whether the current strategy should be what I would refer to as B.T.D. (Buy The Dips) or ABC (as in Elliott Wave Theory). The latter would fall into the bearish camp, and the former are permabulls.

For those who follow the comments section of this blog - - and I'm addicted to it - - you can see quite a few people point to action like yesterday's as simply another buying opportunity. (Sort of like how Realtors are always saying there has never been a better time to buy a house). In other words, the market will, by and large, go up until the end of time, so buying when stocks go "on sale" is the way to go.

That has worked very well so far. Those who have bought on the dips over the past three or four years have done terrific. So it's beguiling to just keep doing the same thing in perpetuity.

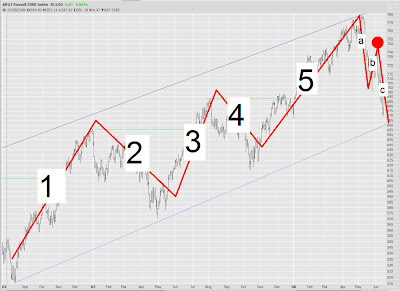
But let's look at the ABC point-of-view. Here's the classic notion of Elliott Wave price action: the 1/2/3/4/5 series shows the bullish phase, whereas the A/B/C shows the bearish phase. (Please note I pride myself on being an accomplished chartist, but I only know enough about Elliott Wave to hurt myself; so I may be a little off the mark in some of this terminology).


As an example of this kind of behavior, let's take a look at the Russell 2000 index from late 2004 until mid 2006. I've drawn some lines here and noted the various phases. As you can see, things line up pretty nicely. I've also drawn a big solid circle indicating the completion of the "b" wave, which is the retracement within a bearish phase. (Newbies: click the image to see a much bigger chart).


Now here is the more recent Russell 2000, going up to the present day. I will say straightaway that the pattern is not nearly as clean and clear. But, as the big circle indicates, the possibility I have been asserting is that all this bullish action over the past six weeks has been a "b" wave retracement. What we bears are (sick and tired of...) waiting for is for "c" to kick in.


I wrote a few days ago about my bullish disposition toward energy stocks. This morning I bought - yep, bought - SLB and SWN based on this point of view. Both of these moved up handsomely. As you can see by OIH, below, there seems to be a nice breakout for these stocks based on an inverted H&S pattern.


Let's see if Friday the 13th (tomorrow) gives the bulls the kind of bad luck we've been waiting for. But today's strength was disconcerting. A push tomorrow above the highs of April 10th would be just another nail in the bearish coffin.

Wednesday, January 17, 2007

When Great News Doesn't Help

After the market closed today, tech bellwether Apple, Inc. announced not just great earnings, but Oh My God blowout earnings. And how did the market react after hours? Well, both Apple and the NASDAQ fell. GLOBEX is down too. When stocks soften on amazingly great earnings, that's a good sign for us ursine types.

Some indexes pushed to lifetime highs intraday today, but ran out of steam. I do not see any sensational, obvious, the-world-is-coming-to-an-end type pattern. If the market falls, it's going to do so simply because there are no more Greater Fools. As for the S&P 500, shown below, it needs to break below 1,400 before things get interesting.


The Russell 2000 seems to be consolidating right now. I am hoping the current consolidation is similar to the prior one, both of which are shown in light blue highlighting here.


And check out the Transports - aren't trendlines amazing? The prices did a perfect about-face.


My AMLN short - so far, so good. It's down to $40 in after-hours trading. This is a sharp looking graph.


Bear Stearns has had an ungodly amazing run. Again, this isn't a slam-dunk bearish pattern, but more of a "this is stretched to the max" situation. But some maxes can out-max themselves, as we painfully know.


The same logic holds true for Goldman Sachs.


I rarely mention Nvidia, but puts on this stock could benefit greatly from any general downturn in tech stocks, given its huge runup.


Lastly, a suggestion for a buy (or calls)......Oil Services (OIH). My view is that the drop in crude prices has had its run. Take a good look at how strong volume has been recently, in the midst of the stock consolidating in the upper 120s. Stop-loss price on this one would be $125.80, in my opinion.

Monday, January 08, 2007

Grease the Pig

The market tumbled about fifty points earlier today, but it recovered to close up twenty-five on the Dow. I think the bulls are trying to mount a comeback. We will see if the nascent lower highs/lower lows has any legs to it.

One market that intrigues me on the long side is oil (as a short-term play). I think the recent tumble has been fast, and the "common knowledge" that we're in a very warm winter has permeated the media so thoroughly that it strikes me as a contrary indicator. This minute bar graph suggests a possible consolidation, with a stop-loss price on the OIH of 128.94.


The market, as measured by the Dow Jones Composite, seems to be in a trading range, and today we were near the bottom of it. I wouldn't be surprised at all if, by and large, this was an upward-pointing weak.


The Dow Jones 30 has a clearer "lower lows/lower highs" pattern going on, although it's not been that way for long. I've tried to use arrows and circles to simplify the pattern.


The NASDAQ 100 also suggest a medium-sized trend change.


One index I'm eyeing as a short - - although I might let it ride higher for a bit - - is the Russell 2000.


The S&P 500, whose puts I sold early in the day for a nice profit, may have topped out recently. But - you know me! - the guy who predicted 17 of the last 3 bear markets! But even a bull would agree the past couple of weeks have been on the downslope.


Another indication that we may have a bit of an upsurge is that the $VIX is relatively high, based on the activity of the past couple of months. It has typically softened once it reaches these levels, and the market tends to swell higher during that softening.


I've just got three stocks I wanted to point out tonight. Autozone (symbol AZO) looks like a potential double top. I bought puts on this today.


My fascination with Google (GOOG) goes unabated. A petite head and shoulders seems to be intact here.


Finally, MDC, which I have been short a few days, is behaving nicely, moving away from its neckline.


I'll be traveling tomorrow, but hopefully I'll get time to post an update at the airport. Thanks for dropping by!