Friday, May 27, 2005

The One Stock I Like


Lest anyone think I only short stocks, I'd like to point out a chart which I really like for a long position - GLW (Corning). It's a beautiful dish pattern breakout on good volume - just the kind of pattern typically preceding a nice upward movement.

Kissing the Underbelly


The $MID (S&P 400 index) continues its slow grind upward. The interesting thing is that it remains just beneath the massive two year trendline it broke last April 12th. So it's technically still in a bearish state even though, paradoxically, it's going up pretty much every day.

I will remain bearish on this major index until it gets onto the other side of that trendline, which might not happen. Until then, I simply see these higher prices as even more profitable places to short the MDY. For more aggressive traders, there are a large number of equity puts on the MID, although they are not very heavily traded.

Tuesday, May 24, 2005

Drum Roll, Please!


The month of May have not been at all merry for bears. In fact, it's been a fairly relentless upward push.

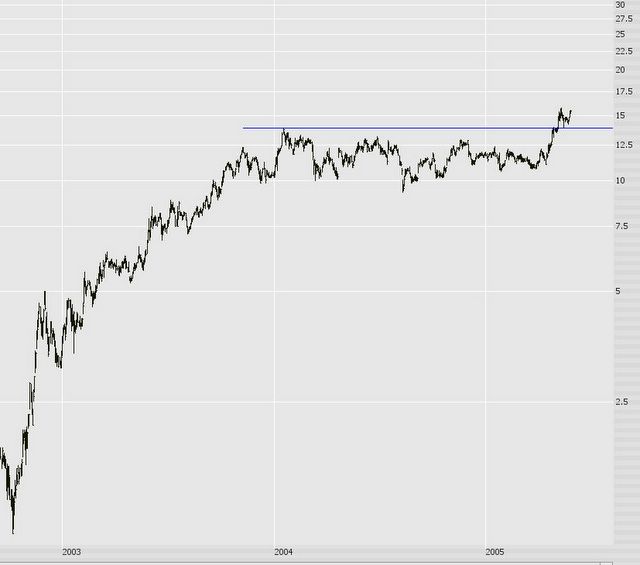
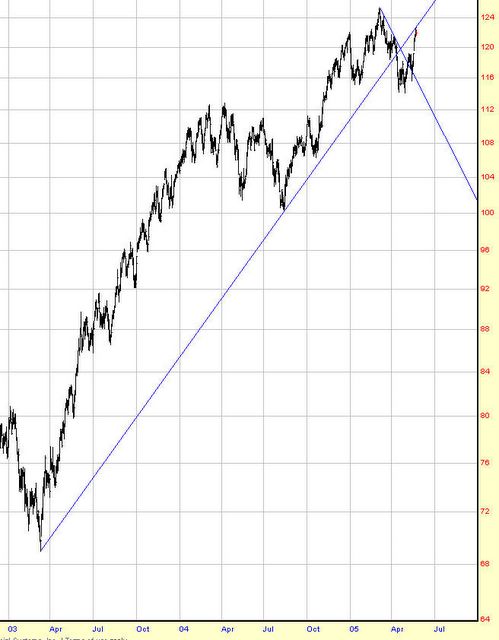
I have been focusing on the $MID (the mid-cap S&P 400 index) for a number of reasons. First, it's technically the cleanest. It has a very solid break of a multi-year upward trendline, which is obviously bearish. Second, it has the furthest to fall; something like the NASDAQ was so bloodied from 2000 to 2002 that it's hard to imagine it falling dramatically. The $MID, on the other hand, is near lifetime highs. The ETF for this index, the MDY, tends to move a bit more sporadically than more popular ETFs such as SPY, QQQQ, and DIA, but it isn't bad, and the volume is reasonable.

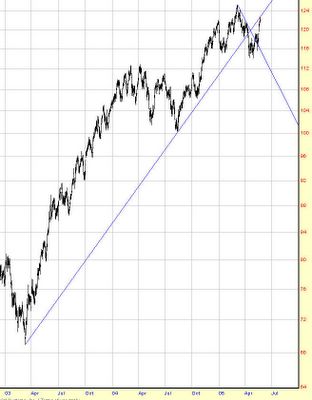
Anyway, the drum roll I'm talking about has to do with the fact that the index has pushed right up against the lower part of its trendline. In other words, this is absolutely the safest place to short it. My hope, obviously, is that it eases away from this level and doesn't see it again for - - well, for years. On the other hand, if it pushes above the trendline, my case of a slam-dunk short sort of falls apart.

A major economic report is coming out before the opening on Thursday, May 26th, and that will pretty much make or break my hypothesis. If the market embraces the report and markets shoot higher, and the trendline is violated by the price, the entire case for bearishness has cold water splashed on it. I'm hoping for the opposite, of course, but we'll just have to wait and see!

Wednesday, May 18, 2005

At the Breaking Point?


This month has so far been very hard on the bears (gee, Tim, a near-vertical rally would have that effect, wouldn't it?) The major indexes are up between four and seven percent just over the past couple of weeks.

The ascent of these indices - including my beloved MDY - has been swift and virtually relentless. If the market continues any higher from these levels, the arguments for near-to-mid-term bearishness start to fall apart. The graph above is the QQQQ, and as you can see, the price level is pushing up against both an important descending trendline as well as the 50% retracement level on the Fibonacci.

I've had a few good longs recently - F, ATI, AIG, GLW - but it's frankly pretty hard to find good longs. There seem to be far better shorting opportunities. But it's somewhat hazardous these days to buck the trend!

Let's see if the indexes start to back off - - - if you're a bear, they had better do so, since continued strength at these lofty levels would not bode well for ursine dispositions.

Thursday, May 12, 2005

Those Amazing Trendlines


Today was a good day for the bears and a fascinating one from a technical perspective. Let me back up a day to explain. Please note the chart above represents the S&P MidCap 400 ($MID) over a period of sixty trading days, shown on an intraday basis.

On Wednesday (see the May 11th post), the market did a sharp 'V' reversal; that is, it initially fell and then sharply rose the rest of the day. This 'fake out' was frustrating for a person with a lot of short positions and puts (such as yours truly).

After the close on Wednesday, I noticed on both the $INDU and the $MID that the low point of the day exactly touched the supporting trendline (see chart above, indicated by the first green arrow). In other words, the long line spanning a period of about 50 days which used to be resistance and had changed to support acting as the floor on which Wednesday's low bounced. Had I recognize that earlier, I would have had a perfect exit opportunity.

Incredibly, Thursday provided me a second chance (and second chances are very rare in this market!) As the chart indicates, the price once again dipped to the trendline, shown as the second green arrow, and at that moment I closed out all my big index shorts with handsome profits. My fear, of course, is that I may have repeated the same mistake made in mid April when the indexes reallystarted collapsing. I'll be watching the markets closely for another opportunity to re-enter these shorts at hopefully safer prices.

Wednesday, May 11, 2005

A Watched Pot.....


After generally pushing higher for seven days in a row, the stock market finally gave us bears some relief by losing over one hundred points on Tuesday, May 11th. This was critically important, because all of the indexes backed away from critical resistance levels which, if overcome, would have made a much weaker case for a falling market.

Regretably, this was a one day wonder, because the markets edged a bit higher on the 12th of May. As the chart indicates, what made this particularly maddening was that the first few hours of the day continued the downward direction, but after a peculiarly quick and deep dip, the markets reversed course, erased all the losses for the day, and tacked on a few points.

We are near or at resistance levels once again, so once more it's quite unclear where things are headed. A break above resistance would be powerful, since it's bumped against it so many times already. What I'd prefer to see (not that the market cares....) is for the lows set on the 11th to be taken out and then the lower lows of April 20th to be violated as well. Until then, we're just bouncing up and down with no clear direction whatever.

Saturday, May 07, 2005

Time to Head Down?


Is this silly rally over yet? Hard to say. As you can see from the chart, the upward thrust over most of the past week started to weaken, and the sharply ascending trendline has been broken (this particular chart is the S&P 500, but most of the big indexes look similar).

The resistance levels reached Friday must not be broken if the bears are to maintain their optimism that the swoon will resume. What we ultimately want to see is the lows set late in April cracked, and the Dow 30 to get beneath the psychologically important 10,000 level. Until now, it's bounced off it.

Thursday, May 05, 2005

Pivotal Point


All of the equity markets have been generally upward for the past four days (April 29 through May 4) and were mixed today, May 5. As a bear, I appreciated seeing some red numbers for a change! The graph above shows the MDY over the past few months. The head and shoulders pattern is still very much in place, but we don't want to see the MDY cross above that horizontal line which equaled today's high.

Anyway, the S&P 500 and the Dow 30 have both broken above their descending trendlines, which although discouraging isn't so horrible since these are relatively short-term lines. The big picture remains unchanged.

At this point, we're going to need to see some pretty earnest downside action to confirm our suppositon that the market is headed much lower. It was unfortunate that the new lows reached early in the morning of April 29th didn't follow through, and the markets actually closed up for that day (this double bottom is shown as highlighted yellow in the graph above).

Tuesday, May 03, 2005

Close Call


The S&P has been moving up toward its descending trendline recently, which is pretty crucial to maintaining the downward bias of this market. The fed announced another rate increase today which, as typical, caused the equity markets to violent lurch this way and that. At this point, the price has not crossed above the trendline, although as you can see it just barely touched it. We need to stay below this trendline in order to remain bearish.