Monday, October 31, 2005

Knowing When You're Wrong

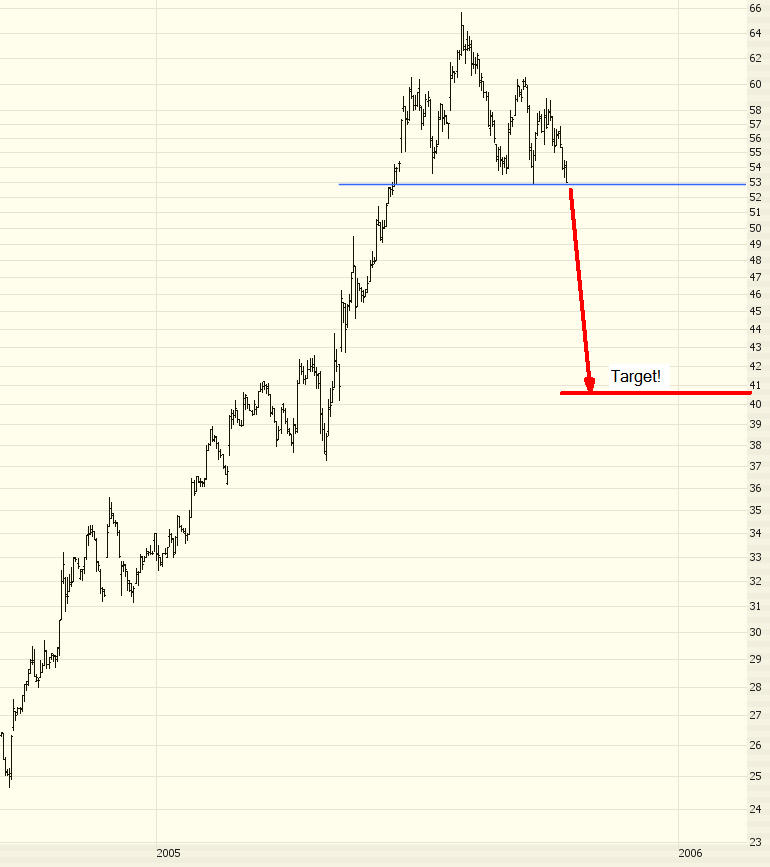
For those of you who follow this blog regularly (and there are millions!) you may recall I made a strong suggestion that Carter's (symbol CRI) was headed for a tumble in this recent posting.

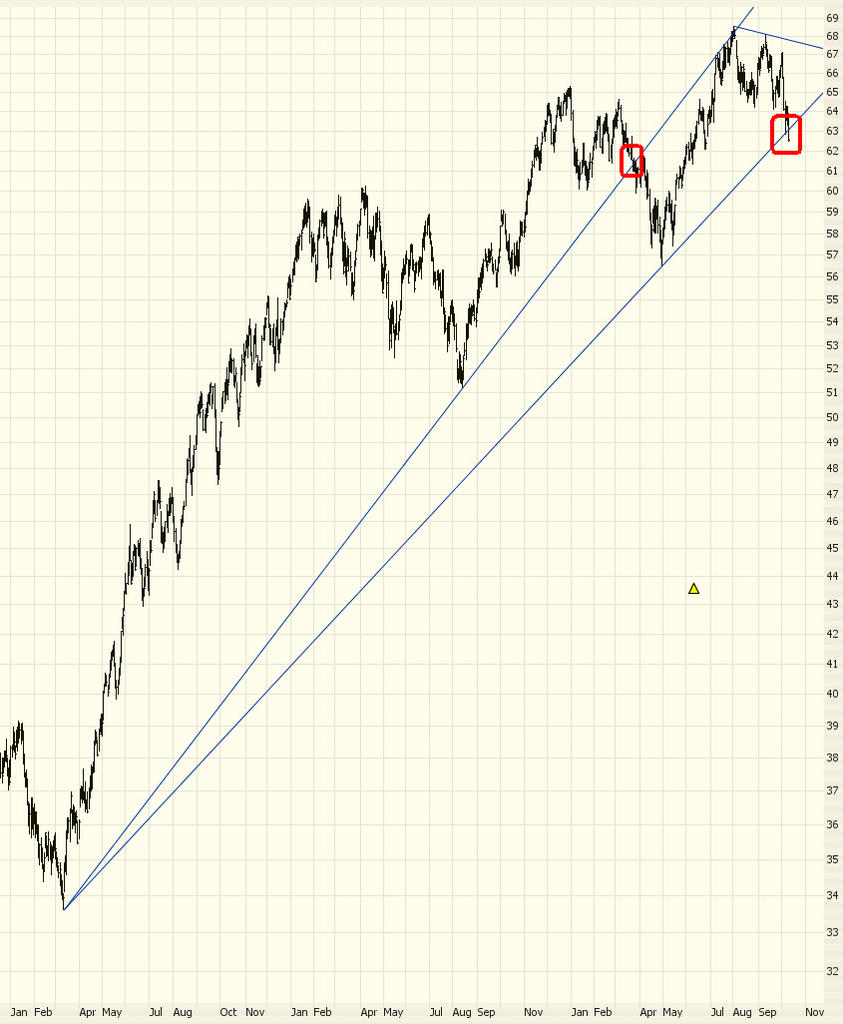
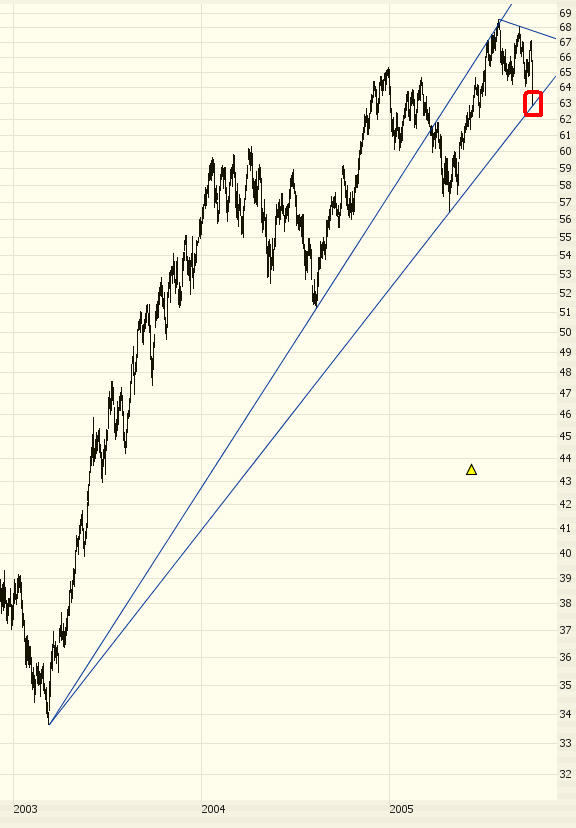
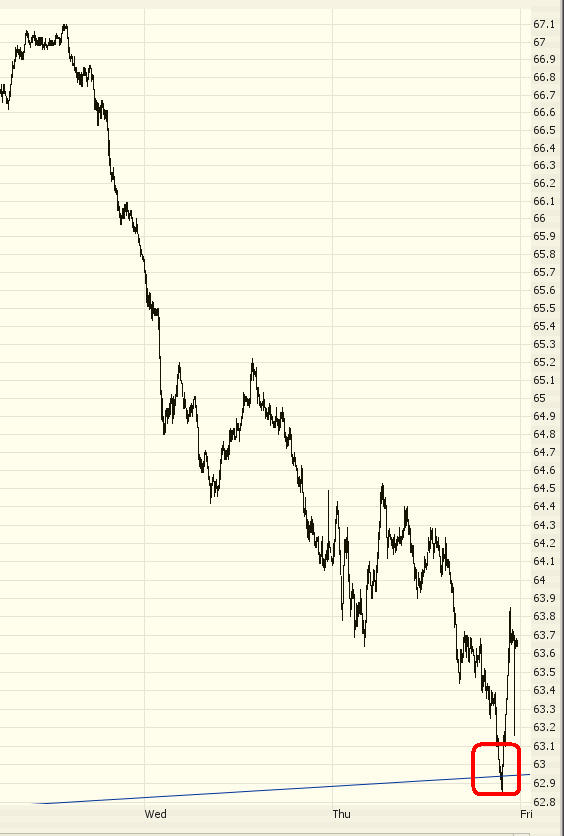
Well, I was wrong. The stock did go just beneath its neckline, and then ZOOM, it shot up like a rocket. Anyone who stuck with this short would have gotten creamed.


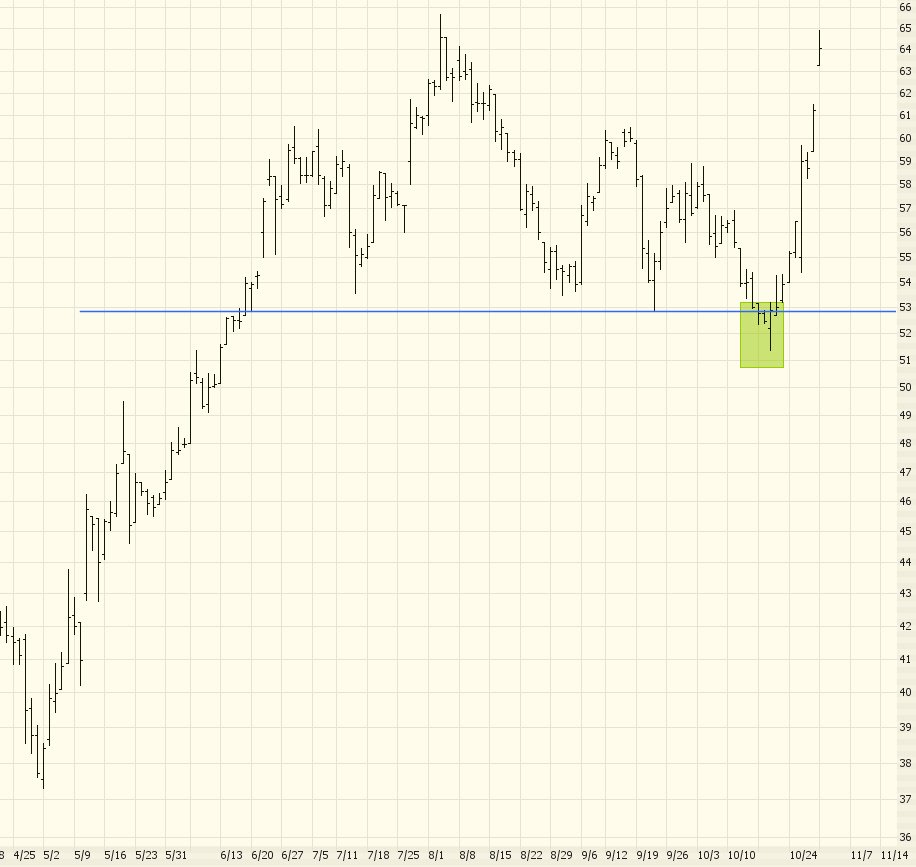
The reason I'm pointing this out is to show that technical analysis has two roles: (1) to indicate trades that have a strong likelihood of moving in a particular direction (2) more importantly, to have a precise point where you know the prediction is invalidated and the trade should be closed. In other words, technical analysis shows you when you're wrong. Other approaches permit you to talk yourself into "hanging on just one more day" until you're broke.

Take the above example. Yes, the stock moved under the neckline. But it moved back above it! At this point, you know that this trade isn't going to work out, and you close it for a small loss. Small losses are totally OK! It's the big ones (which you would encounter if you just blindly stuck with this trade) that kill your account balance.

Modesty is key to successful trading. Part of that modesty is to recognize quickly when you are wrong, get out of the trade, and move on a little poorer and a lot wiser.

Wednesday, October 26, 2005

The Bull & Bear War of 2005

Until Friday of last week, the market was a bear's dream. On Monday the 24th it became what looked like a nightmare, as the Dow rocketed over 160 points and there was strength across the board.

Now that a couple more days have passed, I have had the opportunity to look again at the markets overall. My point-of-view remains utterly unchanged. I still believe we are at the beginning of a major descent, and Monday's action was one of many "one-day wonders" that we are bound to see that will frighten less stalwart bears away.

As you may recall from my earlier postings, the market (specifically, the IWM, which is the broad Russell 2000 ETF) "kissed" the underside of its broken trendline not once but twice (as shown by the down-pointing red arrows on the graph below). On Monday it kissed it again, then it kissed it good-bye as it jumped to the other side.

This was discouraging at first, since it seeemed the broken trendline had been overcome. But look at the graph below. A violent war is ensuing between the bulls and bears. You can practically see the opposing sides shoving the price from one side to another of this "line in the sand" that is so important to the market's future direction.


The key, as always, is which side has more strength. Judging from the charts I am looking at (and I look at hundreds), there is an overwhelming case for a severe downfall. Trendline after trendline, Fibonacci after Fibonacci, they all point to the same thing - - that the market IS broken already, and we're going to keep heading lower in fits and starts.

Since I mentioned my beloved Fibonaccis, I'll point out again how marvelously helpful these can be in trading. OIH, which is representative of the oil group, descended sharply from its wild ride recently. It bounced perfectly off the retracement line, as you can see in the highlighted area below.

The upward bounce has exhausted itself. I re-entered the oil market on the short side in a big way today. Just look at the massive shooting star pattern (for you candlestick fans out there). As always, just click on the image to see a bigger version.

Thursday, October 20, 2005

You Knew This Already

See my post yesterday (click here) and then look at the chart below, which brings you up-to-date:


The market was repelled again. "The kiss of death" - twice - is what's happened this week. And you knew what to do a day ahead of when it actually happened!

Such is the beauty of technical analysis.

Wednesday, October 19, 2005

Kiss Me Twice!

I wrote yesterday about how the IWM had "kissed" the underside of a huge three-year long trendline, indicating how clearly support had turned into resistance.

After an initial softness this morning, the market firmed up and exploded higher. As you can see with the chart below, it once again "kissed" the underside of the trendline precisely!


The key question, of course, is what will it to tomorrow? If it is once again repelled, this will encourage the bears and discourage the bulls. If, however, the line is penetrated, it makes for a more shaky bearish argument, and the line becomes less meaningful for either camp.

I wanted to offer another example of how useful Fibonacci retracements can be. Over the past week or so, I was extremely short various crude oil markets, particularly oil service stocks. These positions (both shorts and puts) did quite well, but it's nerve-wracking to have a position racking of profits if you don't know when it's going to turn and go the other way.

That's where Fibonacci comes to the rescue. All I had to do was take a look at one chart - the XLE - to see that it was approaching a retracement level, meaning that both the XLE and the oil stocks were likely to bounce up.


And bounce they did. I closed out everything (and even bought XLE calls) just as the market whipped around the other direction. Thanks, Mr. Fibonacci!

Tuesday, October 18, 2005

Kiss My Trendline

On Friday, Saturday, and Sunday, I was speaking at a trade show in San Francisco about Prophet.net, and I was enjoying talking to users of our products (both current and prospective) and sharing ideas about the market.

Because I did a lot of demonstrations, I had more time than usual to look at charts, and I was amazed at just how beautifully bearish everything seemed. I can't remember a time when everything seemed to line up so well.

So much so that I told many people my belief of what the market would do when the new week began - - and not in general terms, but in specific, to-the-penny terms.

My prediction was that the market would open higher on Monday, carrying through with its upward momentum on the prior Friday. But that it would "kiss" the bottom of its major ascending trendline and start reversing, and that it wouldn't look back.

My term "the market" is specifically about the IWM, although the market in general applies. Below is the intraday, minute-by-minute graph of IWM. Notice how, early on Monday, it kissed the underside of the now-broken support (which means it's resistance at this point) and fell.


To........the............penny! (I would hasten to add that I don't "adjust" my trendlines after the fact; this is a well-established, multi-YEAR trendline; you are just zoomed in very close to it).

I am writing this on Tuesday afternoon, after the close, and one of the most critical earnings reports has just been issued (Intel, INTC). Revenues and earnings were sensational, and INTC shot up higher shortly after the announcement. Then it was breakeven. Then it's down. Last I looked, it had fallen about 3%, even on that terrific news. They haven't even held their conference call yet, so who knows if INTC will be up or down tomorrow.

But having a down market on bullish news can only bring tears of joy to a bear's big brown eyes.

Friday, October 14, 2005

Oh, Baby!

I could go on and on about the breakdown in the market this week (oh, Tim, please.....) but I won't. This Friday - like last Friday - our dear friends the bulls bid the market up in a one-day rally. Sorry, guys, it's too late. The giant ascending trendlines have been broken, and you were only able to push prices up to the underbelly of your former support. Game over, man. The bears are ready to party.

So while we look forward to next week, let me offer up just a single stock - a short, naturally. This one is baby clothes maker Carter's. A stellar head & shoulders pattern that holds the potential for a terrific drop, as indicated by the chart below.


Oh, and hey - it's optional! (Try .CRIWK) Good luck!

Tuesday, October 11, 2005

Crack.....

The "recovery" from last week's selloff lasted all of one day - - specifically, last Friday. And it could hardly be called a rally. The selling simply abated for a few hours.

The selling has resumed, and chart after chart looks like the one below (which is the symbol IWM), with major ascending trendlines being shattered to the downside:


I've highlighted the point where today's prices punched through the trendline as well as when this last took place in late March of this year. You can see what happened next.

I am short quite a few stocks right now, besides being short the market in general; specifically:

AH
BA
BMHC
BOOM
CMTL
DIA
DNA
FD
GOOG
HANS
HSY
LGF
MAR
PETM
RL
SUN
WCC

I see that Apple reported stellar earnings after hours today, and yet over $4 billion of its market cap has been taken away in after-hours trading. This is exactly the kind of event a bear wants to see: even good news takes the price down, indicating expectations are far too rosy.

Thursday, October 06, 2005

Boing!

Recently a couple of general "bets" I've made have worked out. Specifically:

+ That crude oil was toppy and about to fall, and thus all these sky-high service stocks (AHC, HP, KMG, etc.) were going to drop hard.

+ The market was, in spite of crude's fall, going to plunge as well.

Today I pretty much covered all my oil shorts at handsome profits. I confess I covered my market shorts somewhat prematurely, but they worked out quite profitably as well.

I want to show you something fascinating - look at this graph of IWM (which is the ETF of the Russell 2000). Notice the lower trendline. It is VERY old (about 3 years) and, as the red square indicates, its price was getting extremely close to touching it today.....


Near the end of the day, the price of IWM did touch this trendline, and just look at the incredible and instant turnaround in the price!


Is that not amazing? Think of it! A trendline spanning three years is so strong that the price is only permitted beneath is for about 90 seconds before whipping around!

Don't get me wrong; I still think the market is doomed. But, for the very short term, I'm long the market. I merely think it's oversold for right now, and I'd like to ride a quick bounce up in the meantime.

Wednesday, October 05, 2005

Those Fabulous Fibonaccis

As happy as I am with the market's plunge recently, I'll just have a short entry today to comment about crude oil.

The graph below shows crude oil (specifically, the December 2005 contract) over the past year. I've drawn a Fibonacci retracement on it. Notice how amazingly it forces support and resistance on the price. I've highlighted areas of particular "bounce".......


I am short quite a few oil service stocks now (which already have shown a nice profit), and this chart indicates that crude oil is going to take a fall more due to the nice head & shoulders pattern. I imagine the next stopping point will be at about the $59 Fibonacci level.

Tuesday, October 04, 2005

Five Reasons This Bear Loves This Market

Today's market action was exactly what a bear likes to see: a rise at the early part of the day, a gradual softening, and then a steady fall until the close. This kind of "gotcha!" to the bulls is psychologically key in pushing a bear market forward.

But my fondness of the current market extends far beyond just today's action. Here are five specific reasons I'm feeling optimistic about the prospects for a continued fall in the stock market:

(a) Crude Oil's Not Helping - a lot of people have blamed the softness in the market on the huge increase in energy prices. If that was true, then today would have been a terrific rally, because oil is falling fast. But this isn't the case. Oil's getting cheaper, but stock prices are still soft.

(b) Huge Bearish Engulfing Pattern - all right, this one was just today - but it's important. Take a look at the graph below. There's a marvelous example of a bearish engulfing pattern (this chart is the MDY). The market opened higher and closed beneath yesterday's open. Very discouraging for the bulls.

(c) Bounce Off Resistance - Take another look at the same graph. See the descending trendline at the top? A series of lower highs and lower lows. And today the price couldn't penetrate this resistance line. Just another affirmation of a top.


(D) Major Trendlines are Broken - On all the indices, multi-year ascending trendlines have been broken to the downside. You can see an example of this in the longer-term MDY chart below (reminder: you can click the image to see a larger version). There is another, lower, trendline that hasn't been broken yet, but I'm confident it will be sometime this month.


(e) Utter Complacency - People still think the bull market is intact. They still think that, at worst, the market will return 5% each year (indeed, this is the 'bad news' that is shared in popular circles.....that modest returns must be accepted instead of 25% annual returns). Here, for instance, are the subject lines over the past several weeks from a major technical analyst - look how, day in and day out, every single subject has a positive spin:


As has been widely reported, September is typically the worst month in the market, and it's somewhat discouraging to me that it was actually an 'up' month. But charts are more important than time-based folklore. Let's see how October turns out.