
Those Fabulous Fibonaccis
As happy as I am with the market's plunge recently, I'll just have a short entry today to comment about crude oil.
The graph below shows crude oil (specifically, the December 2005 contract) over the past year. I've drawn a Fibonacci retracement on it. Notice how amazingly it forces support and resistance on the price. I've highlighted areas of particular "bounce".......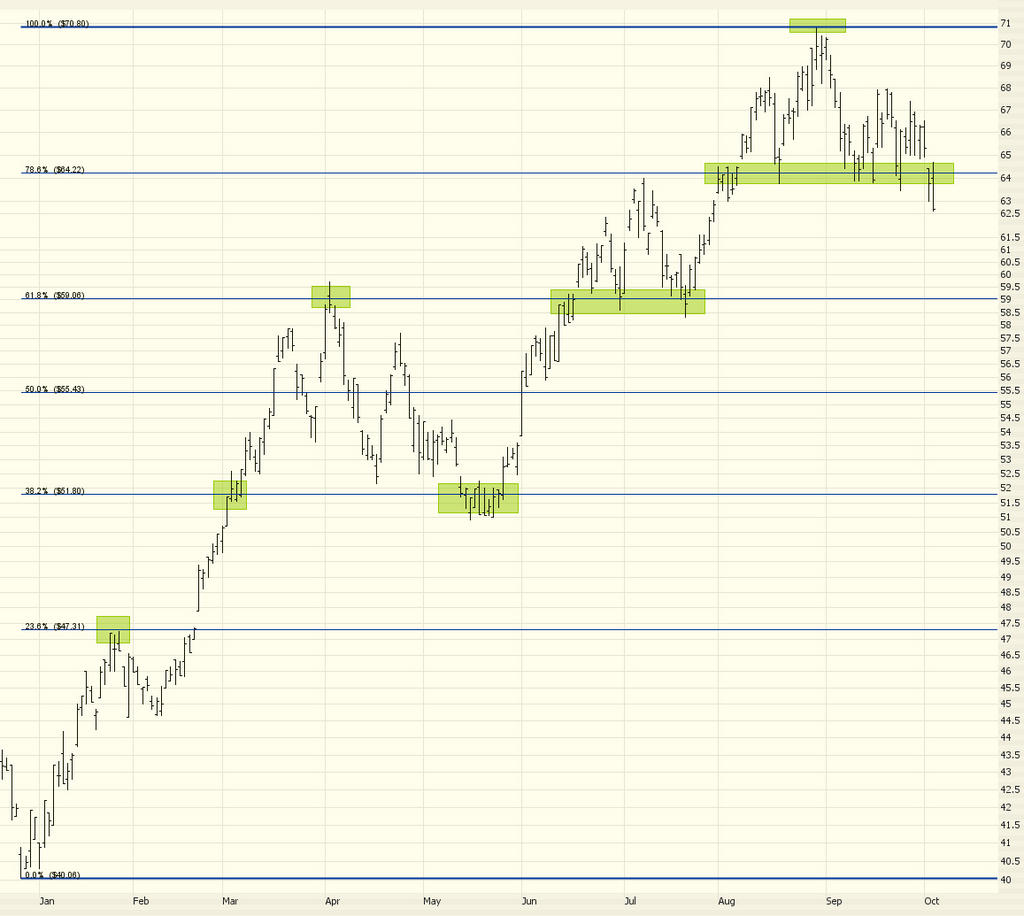
I am short quite a few oil service stocks now (which already have shown a nice profit), and this chart indicates that crude oil is going to take a fall more due to the nice head & shoulders pattern. I imagine the next stopping point will be at about the $59 Fibonacci level.
No comments:
Post a Comment