
Boing!
Recently a couple of general "bets" I've made have worked out. Specifically:
+ That crude oil was toppy and about to fall, and thus all these sky-high service stocks (AHC, HP, KMG, etc.) were going to drop hard.
+ The market was, in spite of crude's fall, going to plunge as well.
Today I pretty much covered all my oil shorts at handsome profits. I confess I covered my market shorts somewhat prematurely, but they worked out quite profitably as well.
I want to show you something fascinating - look at this graph of IWM (which is the ETF of the Russell 2000). Notice the lower trendline. It is VERY old (about 3 years) and, as the red square indicates, its price was getting extremely close to touching it today.....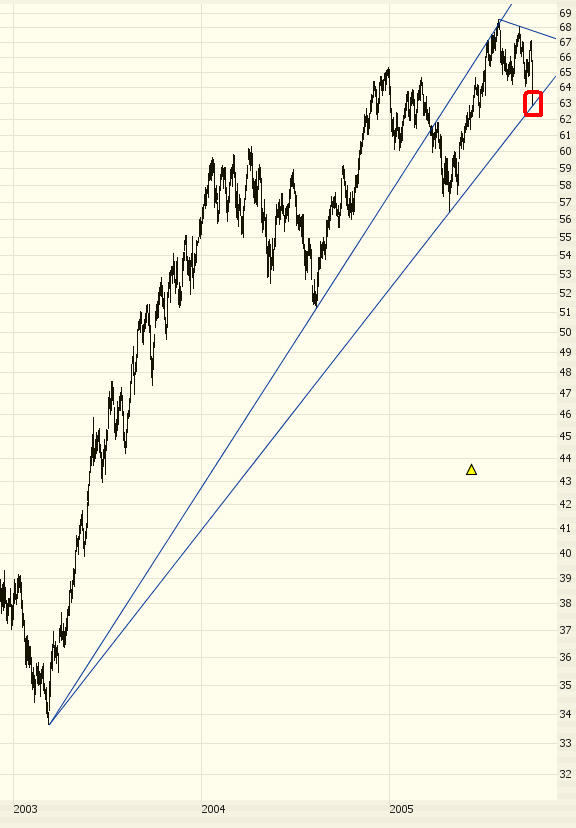
Near the end of the day, the price of IWM did touch this trendline, and just look at the incredible and instant turnaround in the price!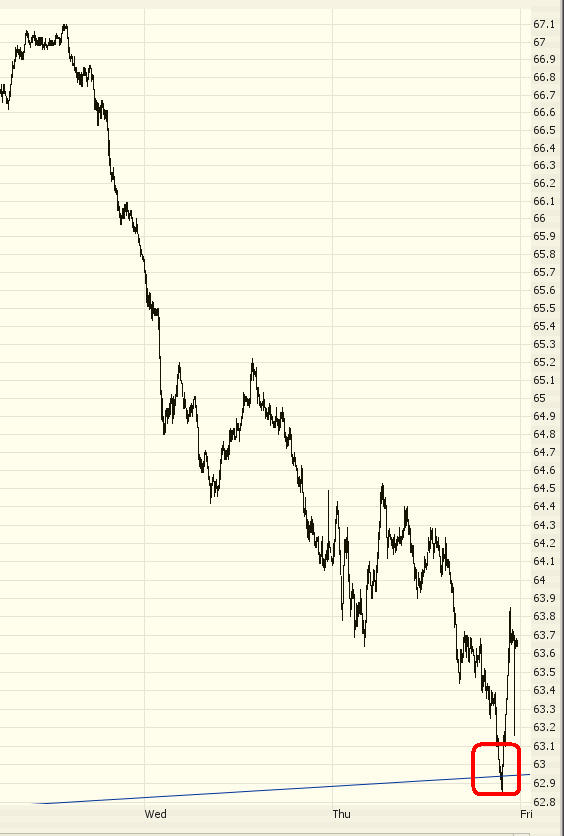
Is that not amazing? Think of it! A trendline spanning three years is so strong that the price is only permitted beneath is for about 90 seconds before whipping around!
Don't get me wrong; I still think the market is doomed. But, for the very short term, I'm long the market. I merely think it's oversold for right now, and I'd like to ride a quick bounce up in the meantime.
No comments:
Post a Comment