
Kiss My Trendline
On Friday, Saturday, and Sunday, I was speaking at a trade show in San Francisco about Prophet.net, and I was enjoying talking to users of our products (both current and prospective) and sharing ideas about the market.
Because I did a lot of demonstrations, I had more time than usual to look at charts, and I was amazed at just how beautifully bearish everything seemed. I can't remember a time when everything seemed to line up so well.
So much so that I told many people my belief of what the market would do when the new week began - - and not in general terms, but in specific, to-the-penny terms.
My prediction was that the market would open higher on Monday, carrying through with its upward momentum on the prior Friday. But that it would "kiss" the bottom of its major ascending trendline and start reversing, and that it wouldn't look back.
My term "the market" is specifically about the IWM, although the market in general applies. Below is the intraday, minute-by-minute graph of IWM. Notice how, early on Monday, it kissed the underside of the now-broken support (which means it's resistance at this point) and fell.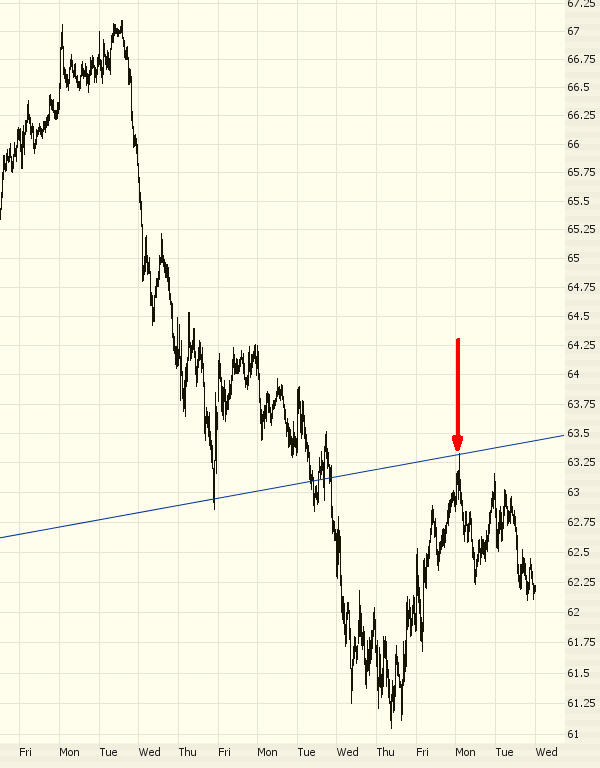
To........the............penny! (I would hasten to add that I don't "adjust" my trendlines after the fact; this is a well-established, multi-YEAR trendline; you are just zoomed in very close to it).
I am writing this on Tuesday afternoon, after the close, and one of the most critical earnings reports has just been issued (Intel, INTC). Revenues and earnings were sensational, and INTC shot up higher shortly after the announcement. Then it was breakeven. Then it's down. Last I looked, it had fallen about 3%, even on that terrific news. They haven't even held their conference call yet, so who knows if INTC will be up or down tomorrow.
But having a down market on bullish news can only bring tears of joy to a bear's big brown eyes.
No comments:
Post a Comment