
Kiss Me Twice!
I wrote yesterday about how the IWM had "kissed" the underside of a huge three-year long trendline, indicating how clearly support had turned into resistance.
After an initial softness this morning, the market firmed up and exploded higher. As you can see with the chart below, it once again "kissed" the underside of the trendline precisely!
The key question, of course, is what will it to tomorrow? If it is once again repelled, this will encourage the bears and discourage the bulls. If, however, the line is penetrated, it makes for a more shaky bearish argument, and the line becomes less meaningful for either camp.
I wanted to offer another example of how useful Fibonacci retracements can be. Over the past week or so, I was extremely short various crude oil markets, particularly oil service stocks. These positions (both shorts and puts) did quite well, but it's nerve-wracking to have a position racking of profits if you don't know when it's going to turn and go the other way.
That's where Fibonacci comes to the rescue. All I had to do was take a look at one chart - the XLE - to see that it was approaching a retracement level, meaning that both the XLE and the oil stocks were likely to bounce up.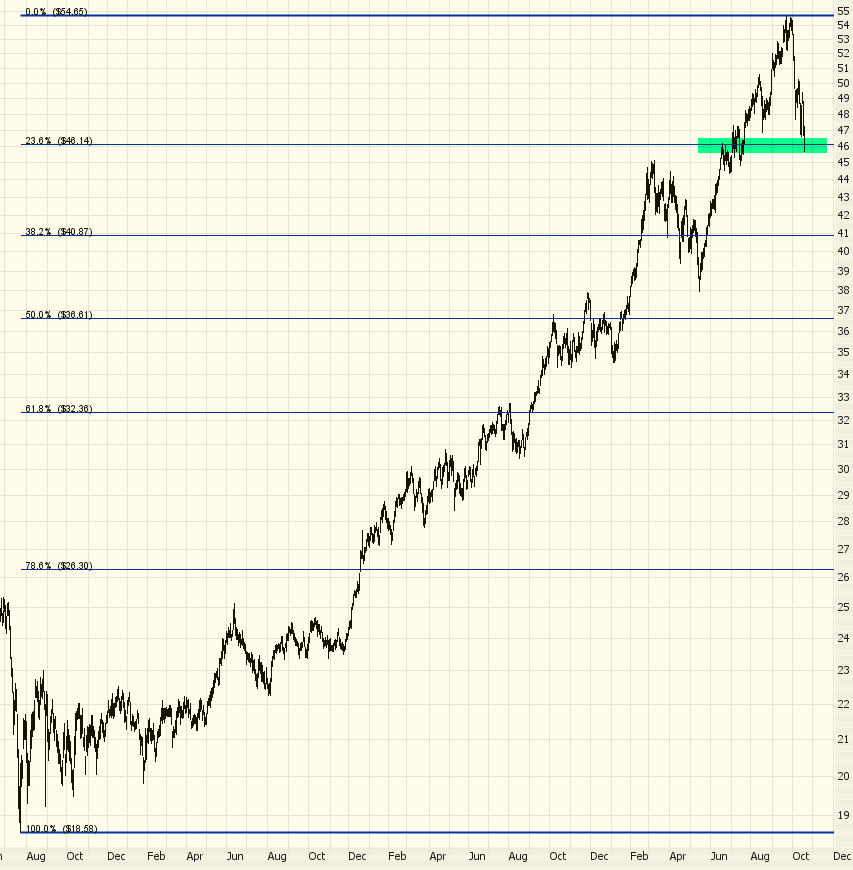
And bounce they did. I closed out everything (and even bought XLE calls) just as the market whipped around the other direction. Thanks, Mr. Fibonacci!
No comments:
Post a Comment