Tuesday, February 28, 2006

$18 Billion in 8 Minutes

I've been watching the stock market a very long time - something like 25 years - but I don't think I've ever seen something like what happened to Google (GOOG) this morning.

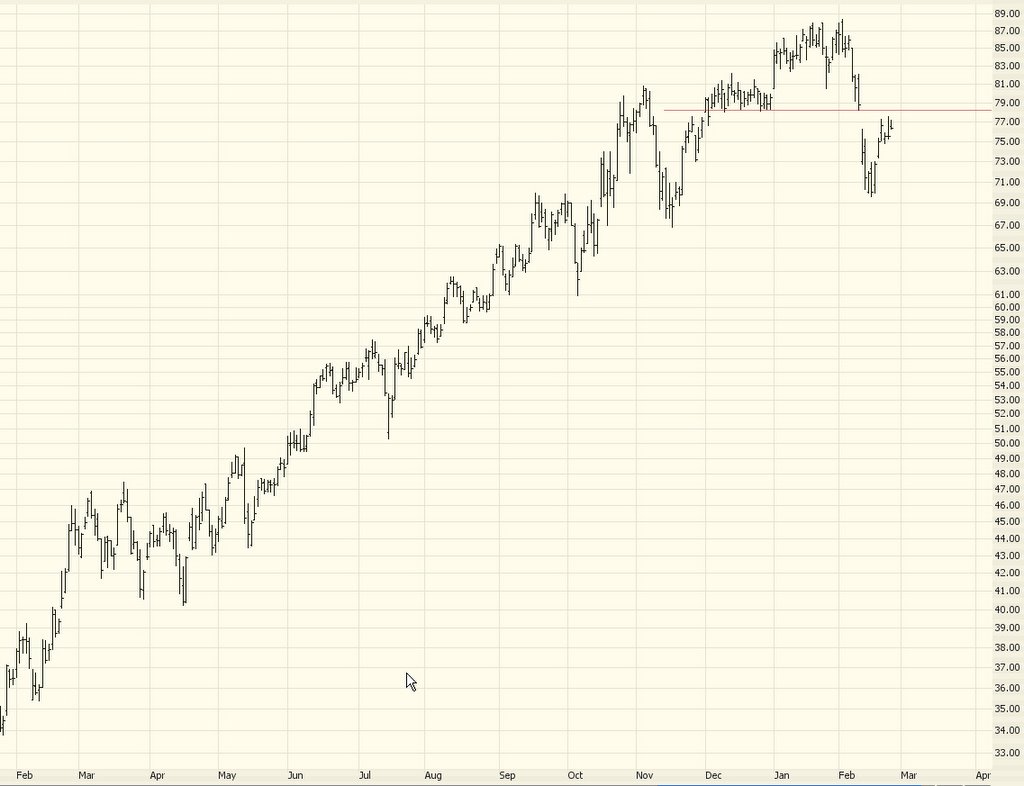
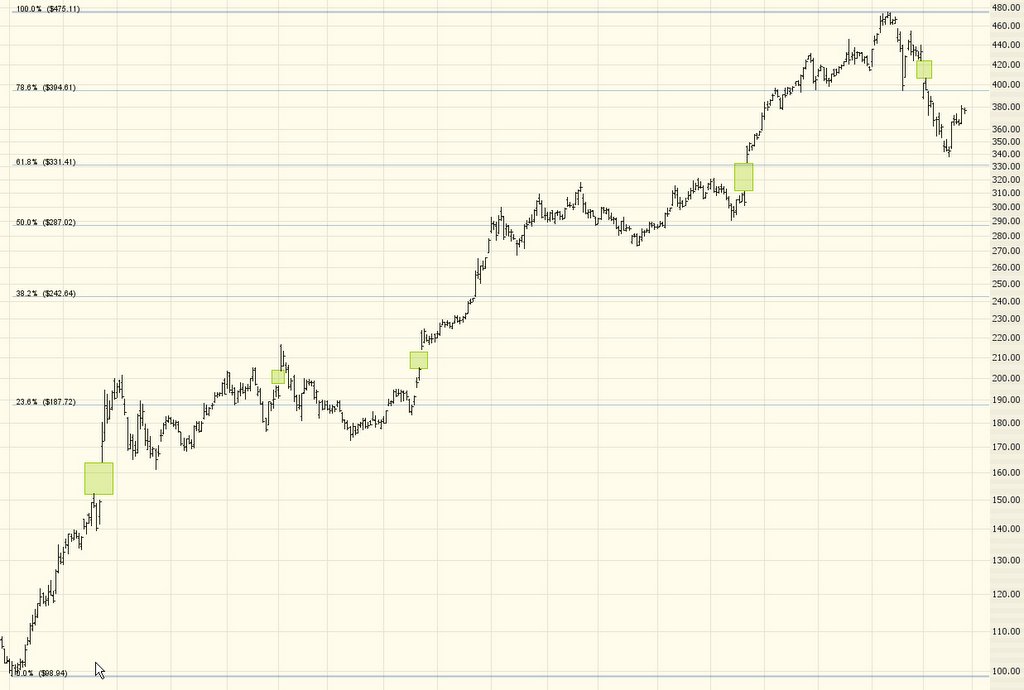
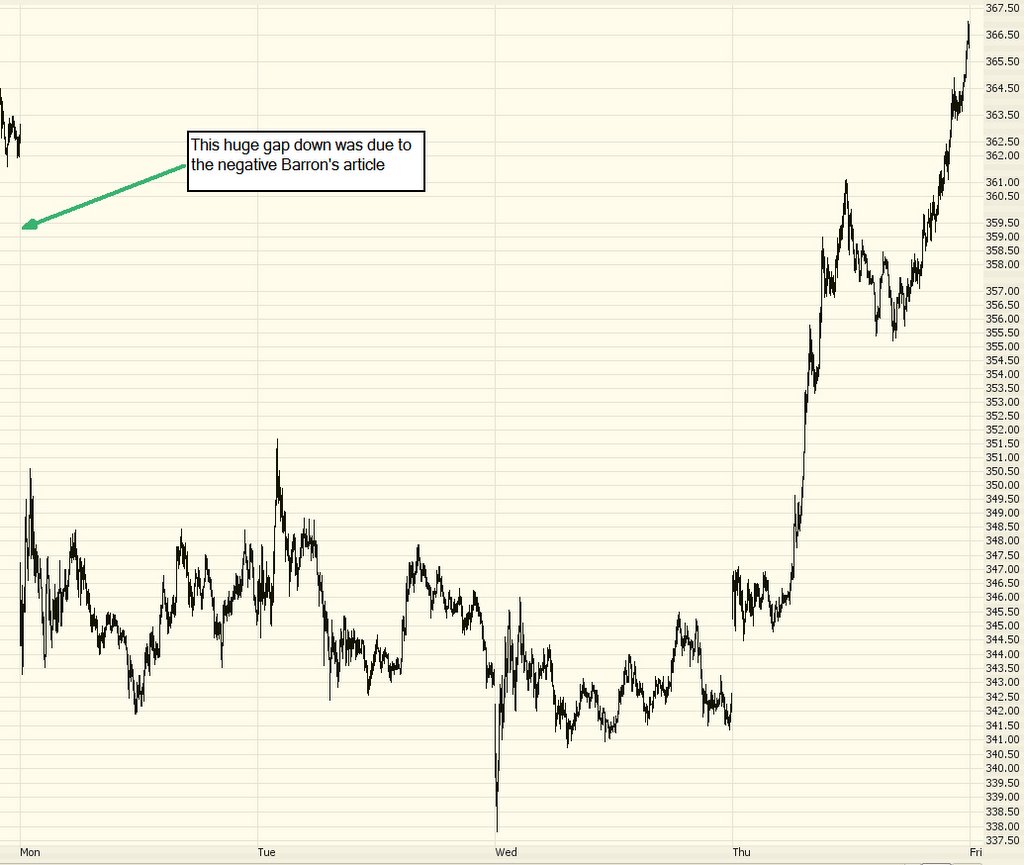
The stock was cruising along, up a few bucks, even in the face of a somewhat soft market. Then George Reyes, the company's CFO, made some remarks at a conference that growth at the Internet giant was slowing. The stock instantly collapsed, and $18 billion in market cap was wiped away in the span of just eight minutes. As you can see in the graph below, it's recovered a portion of these losses since then (how is THIS for volatility, folks?)


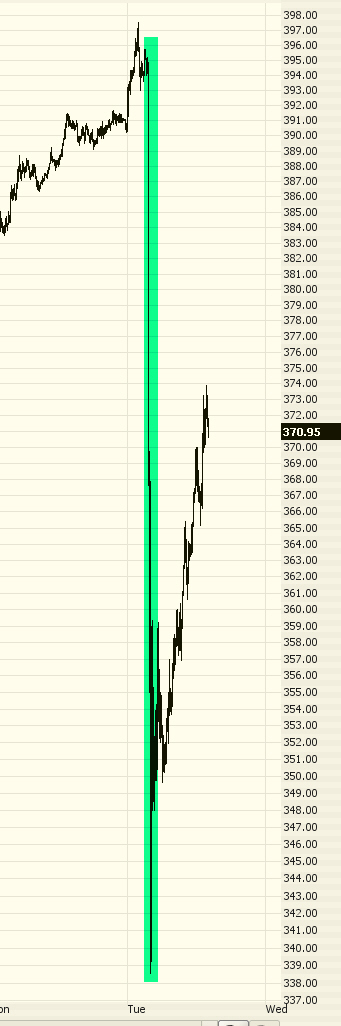
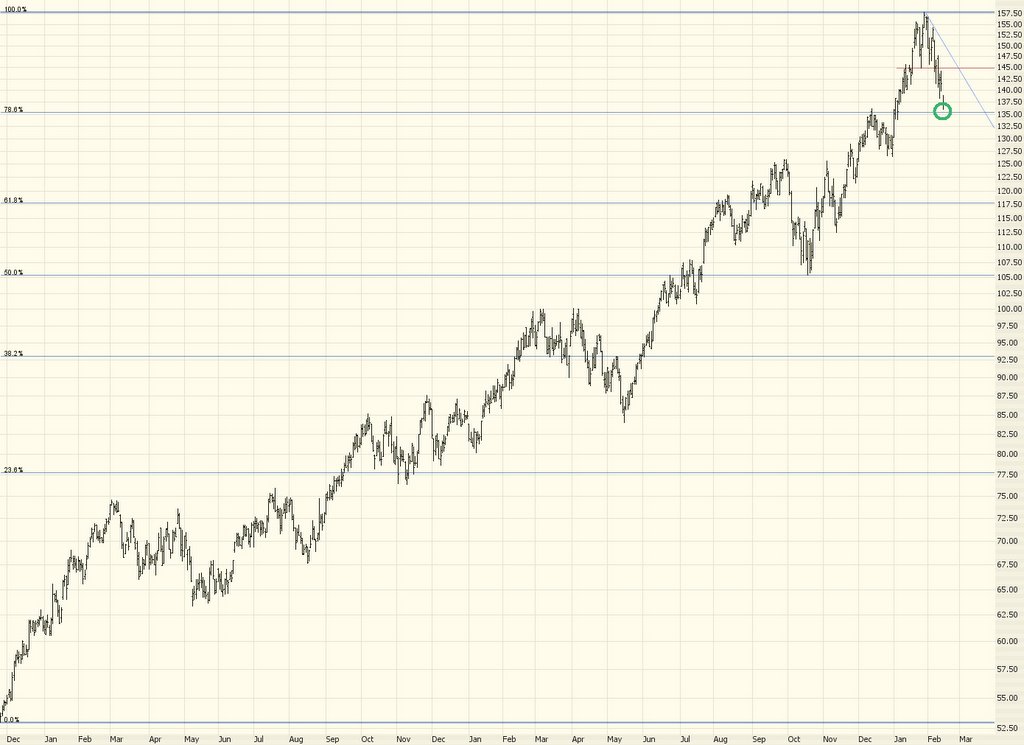
What's quite interesting about this fall is that it stayed tightly bounded by the (cue spooky music) Fibonacci retracement levels. The recovery of GOOG over the past couple of weeks didn't push past its former retracement (not by much, at least), and when this atom bomb was dropped on the stock this morning, it didn't fall below the Fib resistance level beneath.


Cool stuff!

Monday, February 27, 2006

Trip Down Memory Lane

Just for kicks, I thought it would be fun to step into the time machine and glance at Enron's 1999 annual report. We can see how useful these things are in monitoring our investments.

First, let's make sure the firm we're dealing with has their values firmly in place:


OK, good. Now let's make sure we're dealing with a plucky, innovative firm. The report is peppered with rhetorical questions - here's one......


I guess they didn't want to print the answer to that one ("Because Enron illegally manipulated the markets.")

Let's at least make sure a third party vouches for the accuracy and completeness of the facts presented herein:


Good, good. Strange, I can't seem to find the phone number for this firm anymore.

This business fiasco was brought to you by.......

Friday, February 24, 2006

Some Bearish Picks

If you ever want to see a great contrarian indicator, check out the SUPER HUGE font MarketWatch used to trumpet the new highs earlier this week. Wow! Got a feeling these guys enjoy "up" days? And a saucy headline, no less......


Anyway, a bunch of folks have written to ask me to post some specific bearish recommendations. Since the market is getting mushy again (Can this blasted market please just make up its mind, one way or the other? Please???) I'd be happy to offer some up........

First is Arch Coal (ACI), a huge gainer last year. It's gapped down recently, and this makes for a nice clean stop price...


Mail order apparel company Coldwater Creek (CWTR) is losing momentum and represents a low-risk short opportunity:


Federated Stores (FD) has broken though an important trendline, and as you can see, it looks like the broad trend has turned downward.


Perpetual favorite Google (GOOG) has recovered partly from its large fall over the past several weeks and again represents a great high-point short opportunity (or, for those comfortable with the risk, puts)....


I also like Harrah's which, although it's well above the ascending trendline, seems also to be losing momentum.


Lastly, the oil services sector, discussed several times here, has shaped up in a very nice short opportunity. As I've mentioned, there is an active options market on OIH if you're seeking potential multi-hundred percent gains.


Best of luck to you!

Wednesday, February 22, 2006

Market Strength Continues

The market pushed higher today, with the DIA hitting an unprecedented high price. (The reason that the underlying index, the Dow 30, wasn't at an all-time high was because the DIA takes into account dividends). Want a fun fact? If you bought the Dow 30 on July 6, 1999 {nearly seven years ago} and held it to today, the net change in the index would have been 0! Incredible, considering what's happened during the past six years, isn't it?

I've mentioned symbol ASYT before, but I've got to again state what a picture-perfect inverted head & shoulders this was. Just take a look - particularly on the pullback (highlighted here with an arrow) and the subsequent boost in volume. It's up about 100% since the breakout.


Although my view on the market remains bearish still, for you bulls out there, here are a few symbols which look very attractive to buy: Q, RADN, SCMR, TLAB, TRAD.

Tuesday, February 21, 2006

Time to Short OIH?

The oil services index (symbol OIH) is looking very enticing as a short.

Even though crude oil, and correspondingly OIH, have shot higher in the past few sessions, I am sensing the long-term uptrend (lasting years, to date) may be broken.

If you take a look at this intraday graph, you will see a triumvirate of reasons converging on why about $145 looks like resistance for OIH. First, there's the Fib retracement. Second, there's the neckline on the head & shoulders formation. And third, there's the descending trendline.


Options on this are heavily traded, so the bid/ask spread isn't murder. I'd get very serious about buying puts on this anywhere near $145 (with that price level as a stop-loss contingent order, if you want to play it safe).

Current Puts and Shorts

Well, folks, it's a slow news day! Just not a heck of a lot to talk about!

The Dow did fall nearly 50 points today, and my put options on AAPL edged up nicely. Generally speaking, I'm liking what I see in the markets.

Here is a list of my current put (six) and short (ten) positions. You'll need to figure out the symbols on your own!

Friday, February 17, 2006

Time to Short Apple?

Apple Computer (AAPL) looks like a pretty good short right now (or, if you're open to it, buying puts). I'd suggest a stop of 71.02 on this one.

Thursday, February 16, 2006

Google's Upswing

A couple of days ago, I mentioned Google (GOOG) might be a good short term buy (yes, buy - I'm not JUST a bear, you know!) It's climbed something like 30 points or so since then.


I don't expect this to be a new trend as it makes its way to $2,000. Indeed, I'd short it as it approaches its retracement level of $394. It was kind of weird seeing GOOG staying so static over a few days. Now it's back to its old volatile self.

Wednesday, February 15, 2006

Oil Spill

Well, here's a trade I blew big time!

Over the past several weeks, I had taken various short positions on oil, particularly oil service stocks. One of my favorite trades was buying puts in the OIH ETF. It's liquid and able to move large amounts.

Almost all these trades were profitable, but I figured that, short term, the move had played itself out. I based this on examing the Fibonacci retracements for OIH, and it seemed that the price was getting right onto resistance:


Unfortunately, my temporarily bullish stance on oil was blown out of the water as crude oil fell below its supporting trendline. The graph below shows the continuous contract for crude oil over the past several years, and although this graph doesn't shows today's price bar, the price did drop substantially below the supporting trendline.


Besides OIH falling, many high-flying oil service stocks (like HP, shown below) have taken quite a dive (highlighted here in green).


Since OIH is below its Fib retracement level, it's entirely likely it'll continue falling to the next level below. At this point, I'd steer clear being long anything to do with oil.

Tuesday, February 14, 2006

Bye-Bye, DIA

Well, the price of the DIA has blown above its resistance level, meaning the entire diamond pattern is invalid for the bears.

Indeed, the diamond pattern is a two-edged sword. So just as it is a strong harbinger of lower prices if violated to the downside, it likewise speaks to higher prices when violated on the upside. The psychologically important 11,000 on the Dow is being challenged again as well.


As a side note, I'd also mention GOOG might be a short-term buy at this point, with a stop at 341.88. It's fallen almost $140, and it's received a ton of widely distributed bad press lately, so for now a lot of the selling may have been wrung out of the stock.

Monday, February 13, 2006

Watch That Line!

The DIA got extremely close to violating its descending resistance line (that is, the upper-right line of the diamond pattern). But the key thing is that this lined repelled the DIA and the market fell today (not much, but it fell nonetheless).


As long as the DIA can stay below this line, the chances of it breaking beneath its diamond pattern (and thus creating a true downdraft in the market) remain intact. I'd put a conservative stop price of 109.50 here.

Saturday, February 11, 2006

Barron's Scooped!

An interesting article from Barron's this week here about how much risk Google is facing. You may recall a similar sentiment from my little blog several weeks ago.

Thursday, February 09, 2006

DIAmonds are a Bear's Best Friend

The $INDU (and therefore the DIA) is in a rare diamond pattern right now. Regardez vous:


This is simple, folks. If the Dow breaks below 10,750, it's party time for the bears. Just watch.

Long Position Lookback

So, Mr. Johnny One Note? Mr. Bear? How are those LONG recommendations you posted back in November?

Glad you asked!

I don't often post long suggestions, but back on November 30th 2005 I did. So how'd they do?

Long story short: The S&P 500 has gone up 1.5% since that time. The average gain on my suggestions, including the dogs, is nearly eight times that amount.


Not bad for a perma-bear, eh?

Wednesday, February 08, 2006

Oil Services Sector

Anything related to oil has been crazy for the past year. One of my favorite financial instruments, OIH, is a particularly good market to trade.

The most recent formation of OIH is a head & shoulders pattern. Below is an intraday graph of the past 30 days, approximately. OIH broke down badly recently, and it pulled back to its neckline today, representing a good shorting opportunity. I would also add there are plenty of options available for this security too, if you want a higher risk/higher reward trade.


Zooming in closer to this graph, you can see the Fibonacci retracement displays a pretty clean relationship to the price action. I've highlighted in green areas where the price congregates toward any of the retracement levels.

Tuesday, February 07, 2006

Fantasy Island

If anyone needs proof of how stupid I am, look no farther than the fact that I regularly tout one of my boss' favorite stocks as a short position. I'll try to position this as proof of my objectivity as opposed to my daftness.

Anyway!

The stock in question is NTRI (NutriSystem) which has lost 25% of its value in the past four days (to be fair, it went UP thousands of percent beforehand - - this was a $1.60 stock only 15 months ago).

I've mentioned this stock a few times since it broke its trendline and "kissed" the underside of the trendline (see the arrows in the graph below).

But what's really interesting about this stock now is the bearish island reversal. An "island" is basically a series of prices which are flanked by two price gaps. So it looks like a clutch of price bars just floating in midair (or, in a bullish formation, floating down below the chart). Take a look:


Islands are VERY rare, and they are also VERY strong reversal signals. This stock had a very fast, very steep runup, and frankly I don't know what to suggest as a place to take profits. I don't see any strong support for a long way down.

Monday, February 06, 2006

Predicting the Future

I first want to say thank you again to everyone who has sent in comments. Many of them are quite intelligent and thought-provoking, and I encourage readers of this blog to check them out.

I'll briefly remark on the handful of "un-American" comments (e.g. those stating I must hate America because of my bearish outlook). This is the same kind of anti-bear nonsense that's been tossed about for years. My goal here isn't to praise America or bash America. It is simply to be a profitable trader. And if my analysis tells me that the stock markets are going to go down, and I take advantage of that observation, it doesn't mean I hate America. What piffle!

I've also received some comments doubting that charts can predict what's going to happen in the future. I don't pretend to understand why charts work the way they work - - I simply strive to interpret them. And I realize that one can get caught up in philosophical questions (like predeterminism) if it's suggested that something as basic as a line graph can state what the future holds decades hence. But I still believe it.

I have found over the years that the markets have almost an uncanny sense about what is going to happen before it happens. For instance, what are two of the biggest surprises to hit the markets in the twenty years? The Iraqi invasion of Kuwait and the events of 9/11/2001 spring to mind.

Below is the chart for crude oil futures leading up to the August 2nd invasion of Kuwait in 1990. The chart makes sense......with crude oil rising. But note this - - the chart ends on August 1st! Oil is making a major move upward before anyone outside Iraq new of this surprise invasion.


A similar example is the horrible events of September 11, 2001. Look at the graph of the S&P below, as the market accelerates downward. The last bar shown is for September 10th.


I'm sure many people will think of these as simply coincidences. But to me, they illustrate the eerie power of the markets to anticipate what's coming over the horizon before individuals are conscious of it.

Friday, February 03, 2006

The Market's Big Picture

It's particularly important for me to note that clicking on any image in this blog yields a bigger version. This post contains a couple of really important and fascinating graphs that really should be seen in all their glory.

Anyone who has read my blog knows my view on the market is very bearish. I believe that the Dow 30 will lose about half of its value within the next ten years. Below are a couple of graphs of a broader index, the S&P 500, to back up this belief.

Here is the S&P 500 dating back to 1928 with a Fibonacci fan drawn from two extremes: the bottom of the Great Depression to the top of the recent bubble.

What fascinating about this is how the prices tend to be bound by fan lines. Take a good look at the graph below; I've made it easy to see by drawing a rounded rectangle around major instances (which often span many years - even decades):


More recent history shows that the S&P is bouncing along one of the fan lines. It needs to break below this fan line to make its next serious move down. As you can see, it's already pierced below this fan a few times, only to move above it again. But if it moves below it without recovering, you can expect the S&P to move into the high triple digits afterward.


Confutatis maledictis,
flammis acribus addictis,
voca me cum benedictus.

Oro supplex et acclinis,
cor contritum quasi cinis,
gere curam mei finis.

GOOG Slumps Toward $330

I'm in North Lake Tahoe this week, and all the Googlers (employees of GOOG) ditch work and spend a week up here once every year. I saw a lot of them around Squaw Valley, and by my estimate the average age at the firm must be 19. The slopes are full of millionaires that can't legally buy a beer.

Anyway, GOOG is down nearly $100 from its lifetime high, set just a few weeks ago. Here's the intraday chart showing the disintegration:


Fibonacci retracements suggest the next stopping point will be around $330.

Support Levels Failing

Already this morning, just half an hour into the trading day, two indexes (the NYSE Composite and the Major Market Index, $COMP and $XMI, respectively) have had the low prices taken out that I cited recently. As price action continues to unfold, bears are very slowly grabbing hold of power.

This is a war of psychology, fought with dollars. The direction of the market is driven by widely-held beliefs, and shifting those beliefs takes time. I feel we continue to be in a "transition" phase of the market where power is slowly being handed from the bulls to the bears. In my next posting I'll take a look at the big picture, measured in decades rather than months.

Thursday, February 02, 2006

Measuring a Price Target

Just a quick lesson here.

It's often true that figuring when to take profits on a stock is far harder than knowing when to get into a stock. The balance between greed and fear is always difficult.

One objective measurement for one particular kind of pattern - the head & shoulders - is to measure the delta between the top of the head and the neckline, and subtract this figure from the price at the neckline. Look at this recent example of stock DST:


It's not a huge pattern, but the target was still valid. The price sneaked below the target a little, but better to take the profits than wait for the stock to bounce back up (which it is doing right now).

Wednesday, February 01, 2006

Time Premium & Uncertainty

I first want to thank my readers for many terrific comments posted to yesterday's entry. I encourage everyone to check them out; lots of good input.

Naturally, all eyes were on GOOG this morning. Although the stock got clobbered yesterday in after hours trading, getting as low as about $350, it wasn't down as severely this morning. Make no mistake, a 40-point fall is still really nasty, but the price seems to be gravitating toward its 78.6% Fib retracement instead of the lower 61.8% retracement at $330.


What's really interesting is how the time uncertainty collapses after the earnings are known. I saw a lot of speculation a few days ago of people who were buying $350 puts at very low price, hoping to make a killing. Well, the world of options isn't entirely fair. So even though the calls are getting destroyed........


Only the puts well above the current stock price are enjoying decent gains. And, frankly, gains of 90% aren't that sensational considering the once-in-a-blue-moon drop of $40 overnight in a stock's price. But, let's face it, there was a huge amount of volatility priced into GOOG already.


One last thing - a stock I've mentioned before, ASYT, is doing great shooting away from its inverted head & shoulders pattern.