skip to main |
skip to sidebar

- Tim Knight
- Palo Alto, California, United States
- Tim Knight founded Prophet.net, considered by Forbes and Barrons to be the #1 technical analysis site (sold in early 2005 to INVESTools, where he is the SVP of Technology now). Tim has been trading actively since 1987 and focuses mostly on option positions. He is a dyed-in-the-wool technician, leaning heavily on marked-up charts for his analysis. The contents of this blog are NOT to be considered investment advice, and you should know Tim may or may not have positions in the securities mentioned here.
-
▼
2006
(291)
-
▼
February
(22)
- $18 Billion in 8 Minutes
- Trip Down Memory Lane
- Some Bearish Picks
- Market Strength Continues
- Time to Short OIH?
- Current Puts and Shorts
- Time to Short Apple?
- Google's Upswing
- Oil Spill
- Bye-Bye, DIA
- Watch That Line!
- Barron's Scooped!
- DIAmonds are a Bear's Best Friend
- Long Position Lookback
- Oil Services Sector
- Fantasy Island
- Predicting the Future
- The Market's Big Picture
- GOOG Slumps Toward $330
- Support Levels Failing
- Measuring a Price Target
- Time Premium & Uncertainty
-
▼
February
(22)


15 comments:
Hey Tim: the DIAmond breaking to the upside kinda screwed things up here for a few bears, when can we look forward to shorting the DIA again?
Come on Man, A 13 year old girl could see that. I would expect a little more from a man with your knowledge.
Hey, a trade's a trade! I'm not ashamed to post an easy recommendation!
My pleasure.
As for pappa bear - - well, I've been burned recently by "calling the top", so call me gun-shy! The DIA touched the ascending resistance line today, but I'm going to let a few more days go back before saying much more about the $INDU!
I'd say $56 or thereabouts.
Tim,
Seems to me BRCM is a better short ??
Comparing the two:
BRCM:
http://stockcharts.com/gallery/?brcm
http://www.stockconsultant.com/consultnow/basicplus.cgi?ID=sample&symbol=BRCM&87395#ttop
http://www.stocktargets.com/cgi-bin/ticker.pl?command=BRCM
AAPL:
http://stockcharts.com/gallery/?AAPL
http://www.stockconsultant.com/consultnow/basicplus.cgi?ID=sample&symbol=AAPL&1712#ttop
http://www.stocktargets.com/cgi-bin/ticker.pl?command=AAPL
What do you think ?
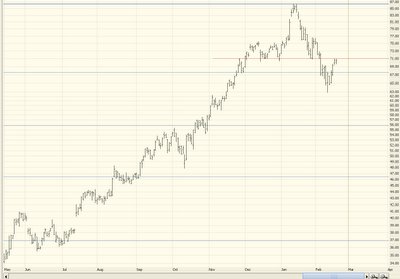
I'm doing a measurement from the neckline (drawn on the chart) to the top of the chart and subtracting from the neckline; perhaps not coincidentally, this also corresponds with the next retracement level down.
I'd never heard of StockTargets; thanks for the link - pretty cool. I look at BRCM, but it's not nearly so 'clean' a chart as AAPL.
Amazing how many comments my tiny little post yielded, especially on a holiday.
To Jeff from Stanford......I'd suggest the March 75 puts. I like puts that are just in the money, and I typically got for an expiration at least 4 weeks out.
As for Des, the whole basis I use for technical analysis is that the fundamentals are already built into the chart. It would be silly for me to worry about the fundamentals, whether the company is big or small. So, yes, I tend to be a bit of a purist as a technician.
AAPL looks a risky short here.It is right at the 2+ year trendline support and betting on such a trendline break (until it breaks) is not a good idea.
I've never heard of the "kiss goodbye", but it's fitting. One day doesn't make a trend, but thus far AAPL is moving in the right direction (down).
No. I heard it called back kiss.
This got stopped out today. Which is why I mentioned a stop price (71.02) in the first place!
Hey Anonymous:
don't know which 2-year chart your're looking at for AAPL, but the support doesn't come in until $56
AAPL also broke through it's 50day ema (by 15 cents or so, but it's a break, probably to take out stops)a strong up day like today shd bring us some selling tomorrow
Post a Comment