Oil Services Sector
Anything related to oil has been crazy for the past year. One of my favorite financial instruments, OIH, is a particularly good market to trade.
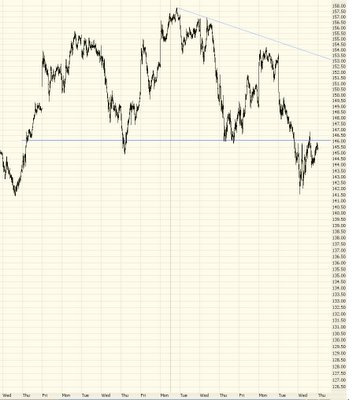
The most recent formation of OIH is a head & shoulders pattern. Below is an intraday graph of the past 30 days, approximately. OIH broke down badly recently, and it pulled back to its neckline today, representing a good shorting opportunity. I would also add there are plenty of options available for this security too, if you want a higher risk/higher reward trade.
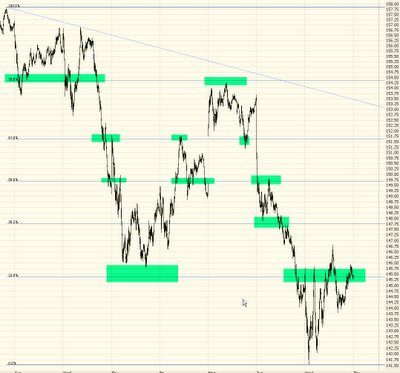
Zooming in closer to this graph, you can see the Fibonacci retracement displays a pretty clean relationship to the price action. I've highlighted in green areas where the price congregates toward any of the retracement levels.

No comments:
Post a Comment