
September Straightens Up
First, a tip of the paw to a blog reader Paul who was kind enough to dedicate a posting to me. The bear clip is pretty funny.
It was a pretty good week. Gold and oil were particularly good to us bears. Even though the stock indexes were up today, all my portfolios went up (in spite of being 100% bearish) simply because they are so loaded with oil and gold shorts. OIH is looking really sweet, and maybe that H&S pattern isn't so apt to be foresaken after all........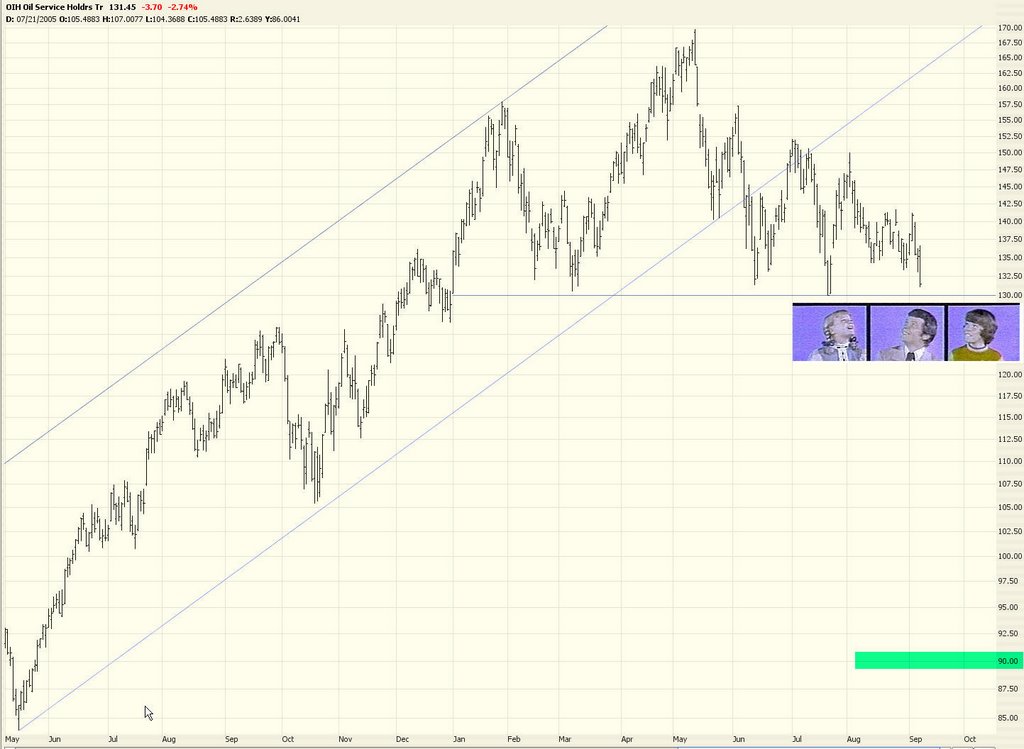
If the $INDU starts falling, I've marked what I think are the natural points of support. If it makes its way down to the 10,700 zone, there is a ton of support, both in terms of the Fib retracement as well as a trendline - - plus the fact that 10,600 has been an ungodly strong support zone. If it truly manage to bust below 10,600, then 10,000 is the next huge brick wall. It would take something really, really serious to get us below 10,000 within the next year or so.
The $OEX reached its tippy top early this week and has been easing back. I think it's unlikely these broader indexes are going to show such strength any time in the near future.
Same with the $SPX - this is a longer-term view.
The $UTIL had been a really steady ascender for years, but it brokes its trendline long ago and has been in a trading range. It's very near the top of that range, and I've highlighted the fairly substantial amount of distance it could fall before reaching its next major support zone.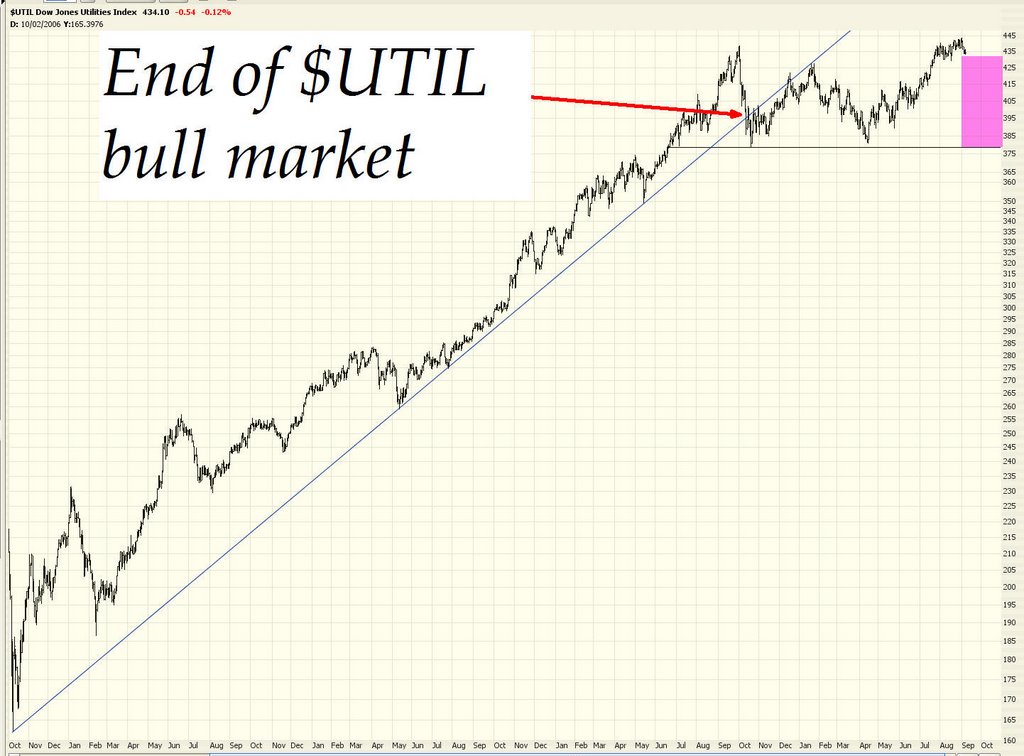
As I mentioned, gold has been doing great (for bears) and although this H&S pattern is even iffy-er than OIH's, it could still happen. As you can see from my clumsy drawing, it's a good thing I never tried to become a surgeon. Many lives have been saved.
Have a good weekend, and I'll hope to see you Monday afternoon.
26 comments:
This is terribly frustrating for me to have missed the boat on oil's decline. I was flat-out just too scared to do so because of the supply/demand situation. I mean any day, something could happen in numerous locations besides the Middle East, worsening Nigeria situation, another hurricane, etc. Plus with all the talk of "Peak Oil" the last couple of years, etc. I just didn't have the nerve to enter puts on oil companies. I just watched it all happen in slow motion this week. About the most I could muster was a put on a coal company, FDG, which is coming along. I just really had a bias against shorting energy; hopefully I'll learn something from this.
Oh well, I'll be looking this weekend for some other sectors showing weakness.
Is the boat totally gone or is there time left to jump on here, Tim, and other posters?
Regards,
Lee
Hi Lee,
Allow me to give you one example of what can happen. Take a look at KBH on a weekly chart.
The point I am trying to make is that there is a lot more to the downside even after the H&S pattern has developed.
Actually the best part may be yet to come.
Dave
MarketMonk
short oil, bear market blues.
bb
transports suck ... and will suck even more.
EXPD, CHRW etc ....
The economy is slowing and after the elections reality will set in.
I think oil could completely colllapse.
Tim, I read your blog everyday. One of the best blog around.
You seem to be bearish on the economy, (US Dollar?), gold, oil and stocks in general.
Isn't gold an hedge against inflation?
-DJ
Yeah, I don't quite understand that one myself.
Inflation is getting WAYYY out of hand. The M3 numbers are hidden, the REAL inflation rate is about 8.5%, even the CPI numbers are showing inflation far exceeding the Fed's "comfort zone".
Yet nobody seems to care and gold is selling off like crazy.
I don't get it.
Read the title of the blog - TECHNICALLY Speaking. I'm a chartist. I am not going to make guesses based on macroeconomic speculation. It's all in the charts.
Tim, this needs to be repeated: You're my hero.
Tim - thanks for the graph update on DJA support levels - data noted. However at present this wretshed indices shows no real sign of even testing its first support level of 11300, never mind the ones below that. It bounced srongly from 11330 last week and although in an outright overbought situation as measured by technical indicators, this doesnt mean a reversal is due. In fact the remaining indicators are still bullish even though they are based on the recent low volumes. Its all very for us to critise low volume rises, but I ask thie question - well where were the sellers? Even if there had been no more than a balanced amount of selling, the indices would not have risen above its pre summer madness level of 11100. The fact remains, buyers are continuing to outweigh sellers. Whatever the charts say, as long as this remains to case, the indices will contunue to trend up with only the occasional down session
from 66 comments to ten, all the bloggers go on vacation too? i think we'll see some sideways action next week waitng on cpi #'s to come out, depending on the numbers it should breakout or breakdown significantly. you could possibly see a run-up of prices til the reports, but this cpi report will be huge factor, 2% and the bulls are running,3% and its bear country(or so it should be), but it's anyones guess what it will be, the rally fri was dissappointing for my puts, but theres still value investors out there, but its only a value if it goes back up!
Honestly, I'm wondering if the huge selloff in gold over the last couple of days was manufactured in order to get the price down before the CPI numbers this month.
If they continue to show inflation, I would think that gold could really break out. In that sense, I'm thinking that the big players are driving down the price now so they can load up when the time is right.
Just a thought.
Anyone see the price of spot silver????
Holy crap!!
Glad I got stopped out of SLV on Friday. Whew!!
-Tony
pb: We've been in a secular bear for the past 5 years already. Maybe you meant to say we're entering a "cyclical bear" market.
Either way, I agree that we should be "going down" very shortly. But oddly, I'm not really too sure how to interpret that.
Certainly, it cannot be good for the US global standing and also the economy. And unless you are REALLY committed to jumping on the bearish side of things, you have to hedge yourself a bit with your investments, because you never know when the PPT will jump into action, or perhaps the BoJ will turn on the liquidity faucets again and give another jump start to the carry trade.
All I'm saying is that the markets are definitely tilted towards the uptrending side. There are just too many big guns interested in seeing things keep going up.
I love you guys! That's why I'm posting this link ...
http://financialsense.com/editorials/bronson/2006/0517.html
Just to put things in their proper perspective!
HAPPY HUNTING!
volvosan!
be not afraid, even if the market makes 'new' highs here, big deal! It's still gonna crash! Money doesn't grow on trees.
10,500 DOW here we come!
- Trader Fred
The capitulation point was the bullish charts identified by Tim.
Al
GOLD / OIL / INFLATION
Hmmmmmmmmmm PAULSON pulling the levers ? You think GS can't push the market ?
The worst we get is a flat market for years.
anon 5:19, im sure they said the same thing in 2000 as well,
determining the worst is awlays done in hindsight, preparing for the worst is what you should be doing, as the above mentioned article say's, we are in an echo rally, the dow and elliot wave theorists are also about this position in their cycles, if this turns out to be the corrective downleg, lookout!
Guess I covered my gold short too soon. Think I'm out at a flat.
Options expiration week. I'm not excited about trading long or short this week.
bsi87
No I still disagree with many of you. The charts only provide a potential as to what might happen IF the market falls. Whilst their is every economic reason whey they SHOULD fall and while their will continue to be further reasons to fall, the fact is it aint a happening event . Weve all being speculating for the past 3 months that the markets will fall and they have risen. It isnt much good commenting they will fall sometime, if in the mean time they continue to rise and should any such fall occur, it may well be a pathetic 1 or 2% blip in what is a rising bull market. Certainly there will be nothing to short on as it will be over before weve had a chance to react. Look at todays limitaion on the downside. Any downside just appears to be a nominal correction process
gold and oil, wow.
Would be a buyer of gold around 500-525 and silver around 9-9.50.
OIL I believe is somewhat oversold.
Trader 2006.
inflation data due out on friday could be a big market mover like it was last month. Market should trade lower on oil and gold rest of the day.
Trader 2006
On 9/06/06 my Small Cap Swing Indicator moved to a
SHORT signal when the market gapped down. Early
On 9/11/06 it is has reached the normal limits, though
the max for SHORT is -107. A switch to LONG could
happen any day, now.
Here are the recent values of the latest swing signals.
. . . . . .Small
. . . . . . Cap . . . . . . . . Russell
. . . . . .Swing . . . . . . . . .2000
Date . . . Ind . .Signal . . % Chg
08/28 . . +05 . .LONG . . +1.1%
08/29 . . +23 . .LONG . . +1.2%
08/30 . . +39 . .LONG . . +0.8%
08/31 . . +48 . .LONG . . +0.0%
09/01 . . +52 . .LONG . . +0.1%
09/05 . . +62 . .LONG . . +0.8%
09/06 . . -19 . .SHORT. ..-2.1%
09/07 . . -43 . .SHORT. ..-0.8%
09/08 . . -61 . .SHORT. ..+0.3%
09/11 . . -82 . .SHORT. ..-1.1% . Intraday @ 10:45am ET
Normal LONG target: . . +65 to +75 (max: +95)
Normal SHORT target: . -65 to -75 (max: -107)
what a turn around.....levels were broken but didnt last.
watch those support levels (2150 Nasdaq, 1290 S&P500).
Trader 2006.
Most of my trades are short-term (3-10 d holding periods) and like Tim, it is all based on the charts. I follow approximately 150 large volume stocks on a daily basis. Most of my buy signals in the past 2 days have been on the long side, but for the vast majority of these the likely size of the move up looks puny. But two stocks that gave long signals today and appear to have a short-term upside of at least 5% are SBUX and INTU.
I agree with most others on this blog that the market is due for a major correction down and my long-term outlook is bearish. I have felt that way for several months. But, during that time I have made a lot of money on calls.
Post a Comment