
Friday Follies
Greetings from downtown Palo Alto, heart of all things technical and headquarters of the world's wildest bear blog. Your host: Tim Knight.
Since July 18, the markets have been on a tear. A bullish tear. The kind we don't like. The Dow is up over 8%, as is the S&P 500. The NASDAQ Composite is up even more, over 13%. Not a pretty picture, people. And, except for the recent softness in gold & oil, it's been a really nasty market for us ursine types.
The $VIX has ground down to almost never-before seen levels of complacency. I'm just waiting for Wired to publish another "40 Years of Prosperity" cover stories again.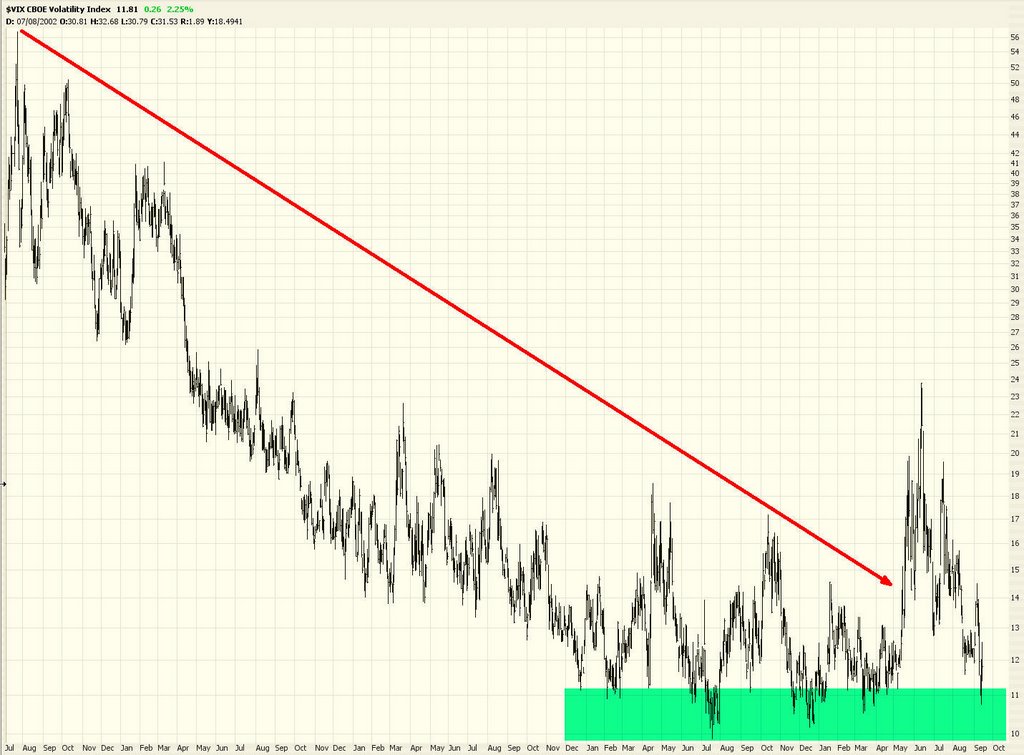
If you look at the VIX relative to the SPX, there's a pretty strong inverse relation. Not foolproof, certainly, but it's clearly there.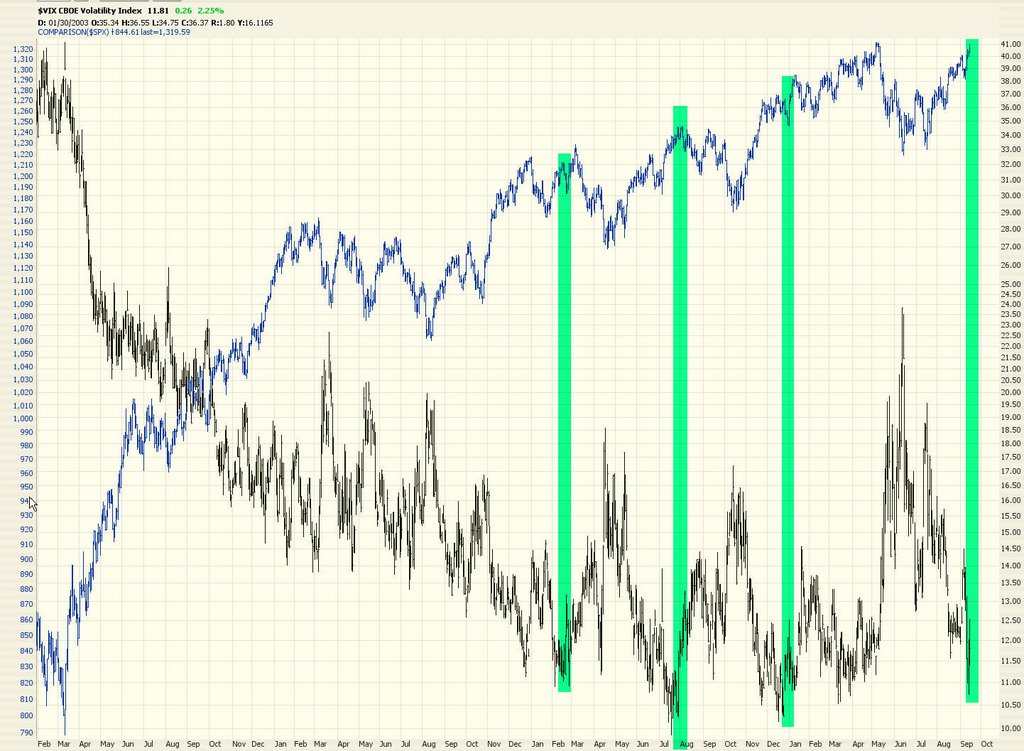
The Dow is within spitting distance of its lifetime high. Astonishing. The bulls have shown amazing strength.
If you look at the $OEX, and many other indices today, you'll see that it formed a shooting star candlestick. It's not an amazing one, and option antics probably had a lot to do with today's volatility. Hey, at least it didn't close at the highs! I'll take what I can get!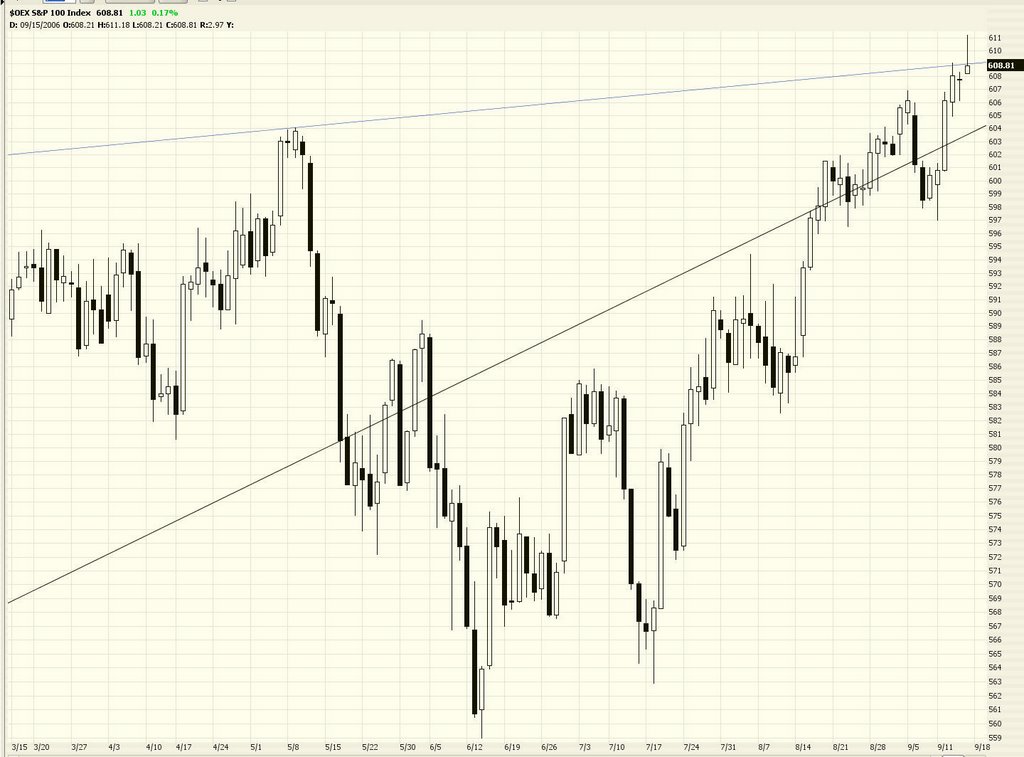
Oil, which has been very kind to us the past couple of weeks, paused for a rest today. The H&S pattern is complete, and it's in a position to get really clobbered. But it's resting right now, deciding whether to recover some of its losses or resume the swoon.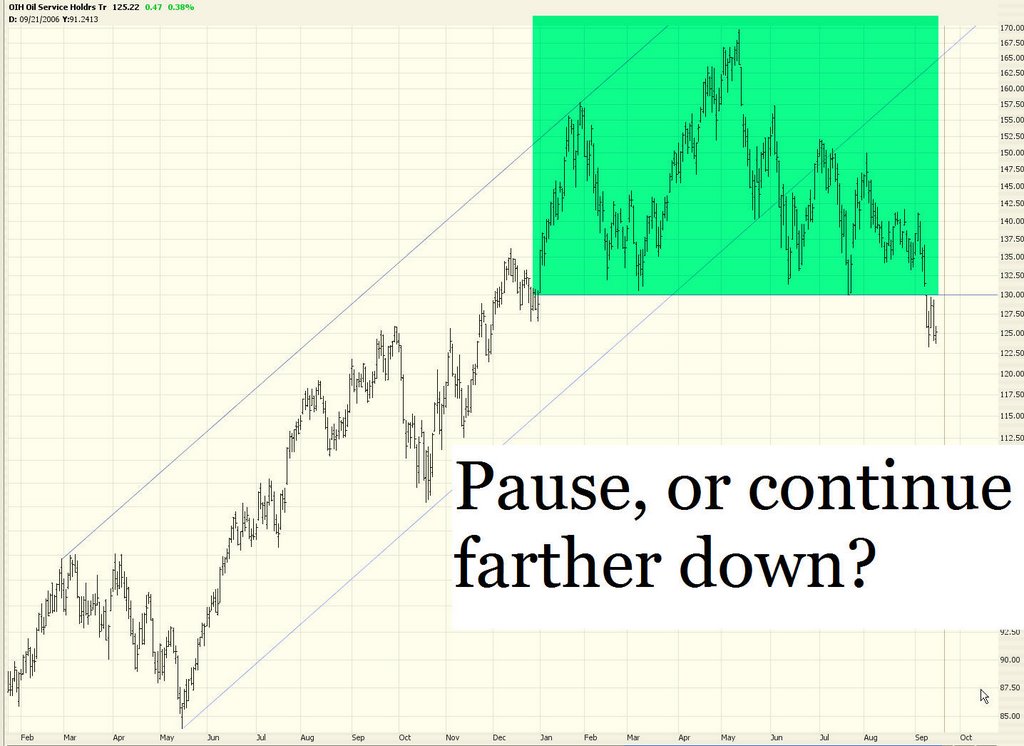
Looking at the $SPX, we are right at the median channel line. In the past (circled red areas) it has been able to cross above this and push higher. If it can't manage to do it this time, they could provide us some much-needed relief.
Even more exhausted than the OIH is the $XAU (gold/silver index), which has beautifully come back to its Fibonacci retracement. This could be a reversal area. On the other hand, a massive H&S pattern has formed. I am steering clear of this at this time, although there might be some fireworks here next week.
The $XMI, like several other indices, also formed a shooting star. This has, however, broken out of a nice dish pattern (which is good for the bulls).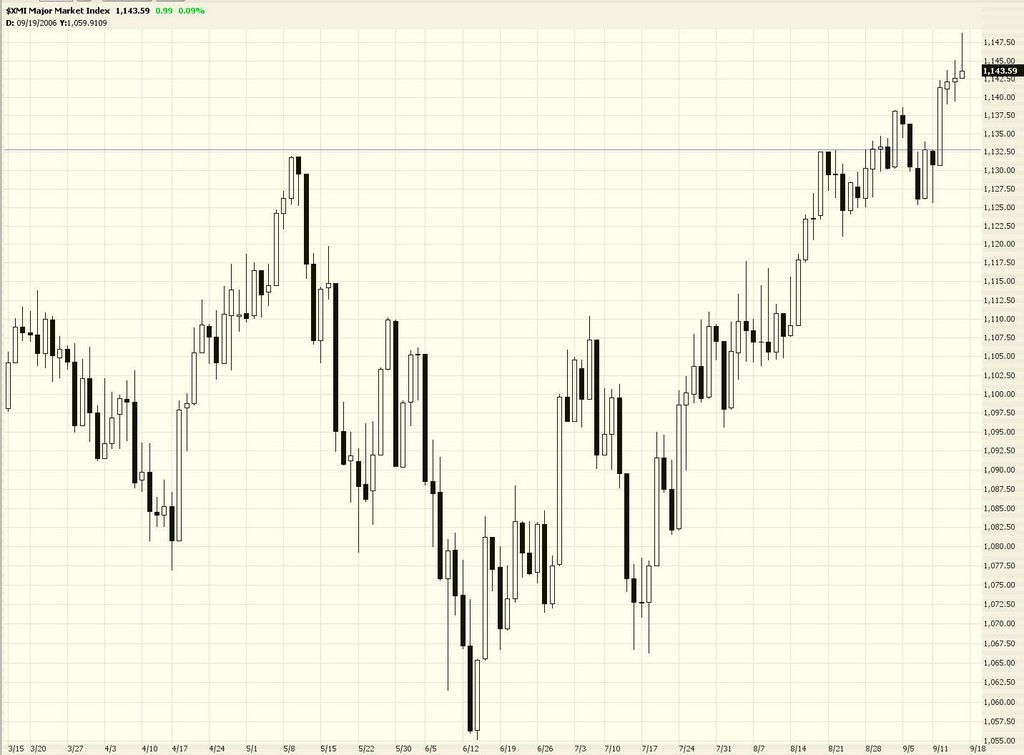
Let's look at some of my favorite short positions right now. Allegan (AGN):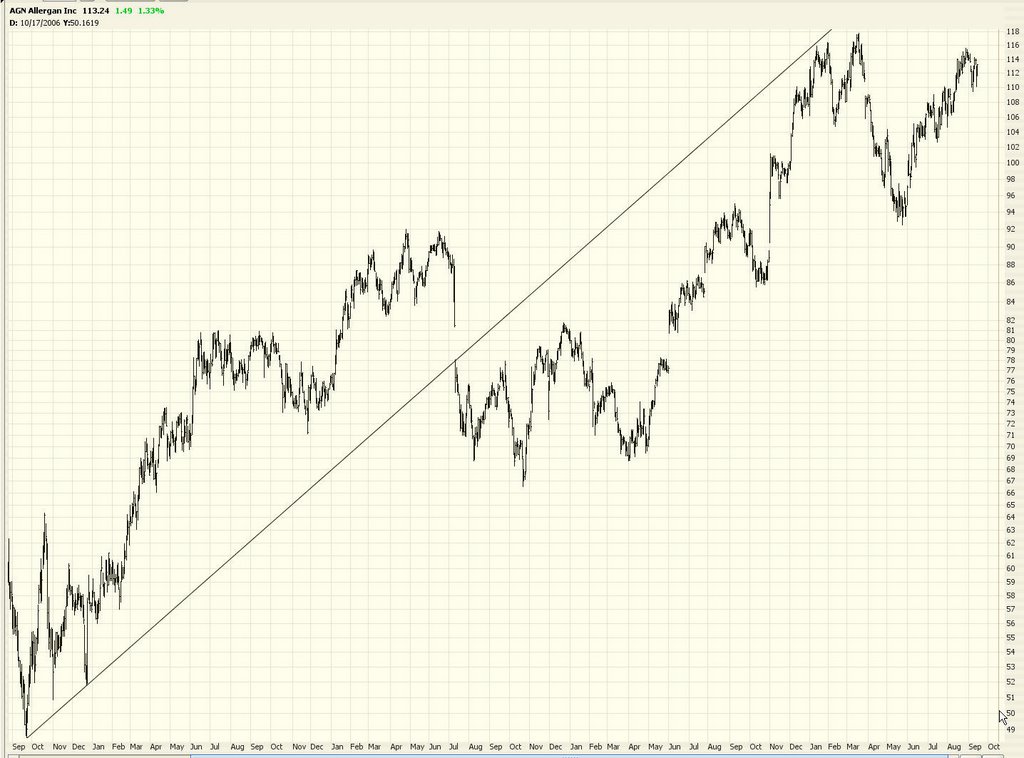
Apache (APA):
Carnival Cruise (CCL):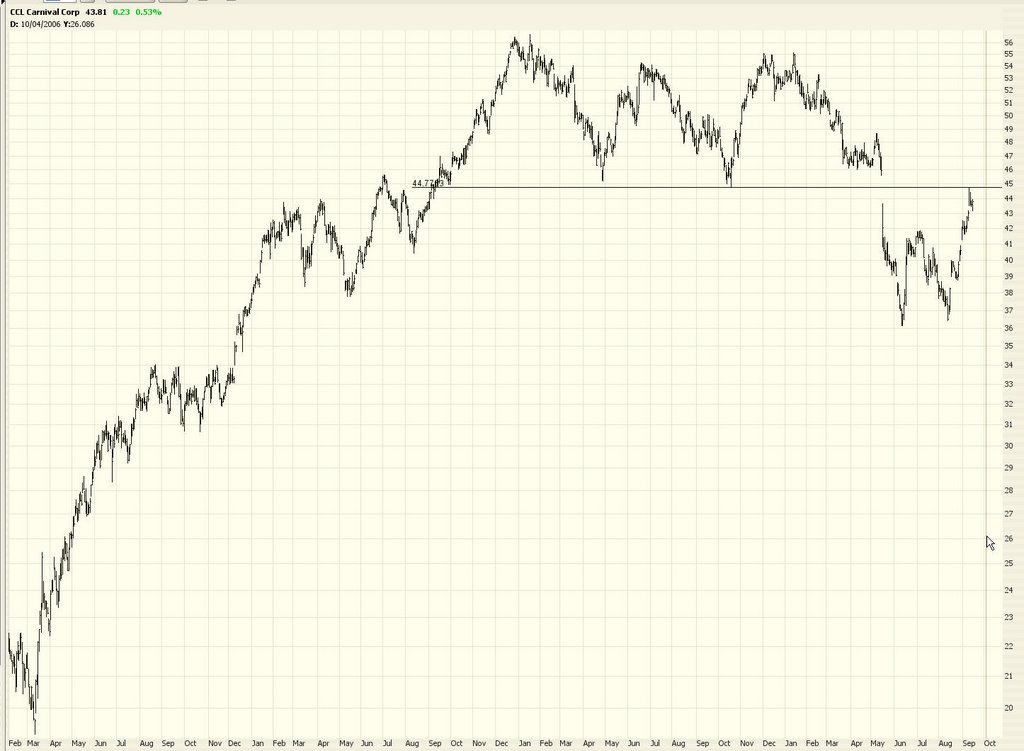
Express Scripts (ESRX):
Lehman (LEH):
NutriSystem (NTRI):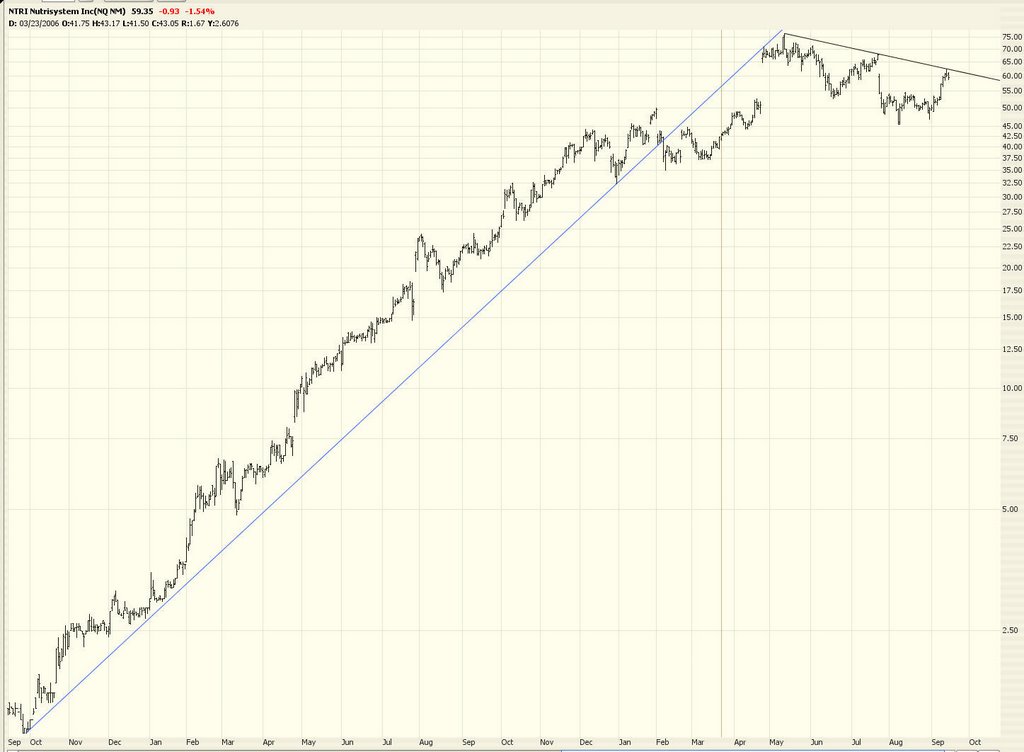
Sears (SHLD) which, I know, is a gorgeous cup with handle pattern - - but I've just got a hunch.....
UPL: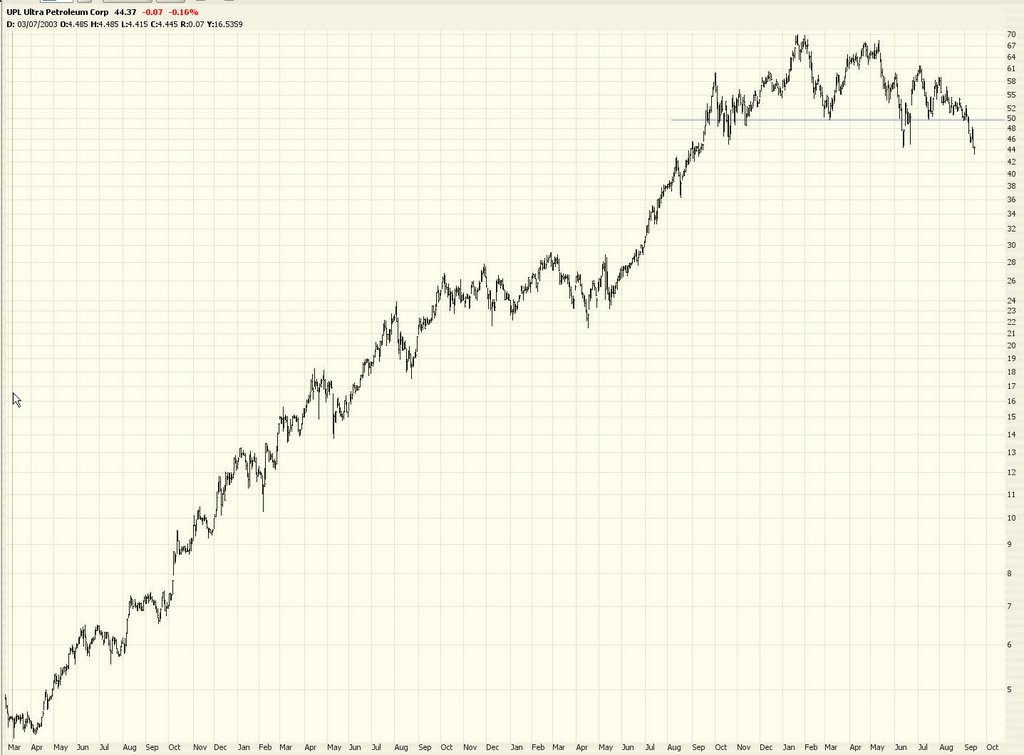
That's it for me. This week was pretty much a wash. Someday the market's going to get whacked. When it does, I'm well positioned. In the meantime, I'm playing a defensive game. Have a good weekend, and best of luck in your trading next week!
28 comments:
Toshi (Tim, I'll never call you anything else!), I'm gonna root for your SHLD. Cramer's always touting Eddie L, and I'm sure that he is a great genius and all of that, but I have to wonder how it has managed to do so well.
Thanks for your efforts, Tim. This is such a great blog. I mainly follow the FTSE as I am based in the UK, and it's leadings components which have ridden the crest of the commodities wave have all been breaking down lately, leaving it up to the stalewarts to hold it up.
Asian markets and European markets topped slightly before the US back in May (in fact, the Nikkei topped in early April). Again, the Nikkei looks like it topped on 4th Sept, and is well off those highs now.
Just a few some crumbs of comfort for us bears at the moment.
Cheers,
Another interesting week (costly for some). Don't fight the current, just keep your stops and make sure you can change direction quickly.
As far as other economic factors, did anyone see the HUGE distribution in metals last week only to see those funds end up elsewhere? Nice move in the market by rotating the $$$. Now economic factors (notice FACT), slowing economy, more and more job layoffs announced, ARM will be going up again and squeezing people for another couple hundo a month, consumer debt going up, corporate layoff's announced with every earnings announcement and now we hear that homebuilders are priced right?
Wow - can't wait til the end of the year. We will have a nice correction, but guess the retail timeframe will keep us happy for now. :)
This week the estimated earnings for the S&P 500 was increased from $78.47 to $79.14, an increase of .67 or roughly 1%.
The yield of the 10 year treasury closed at 4.79%, an increase of 2 basis points while the S&P itself rose from 1,299 to 1320.
As of Friday's close, the spread advantage of buying the S&P over the 10 year fell from last week. Currently that spread is a 8.20% pick-up, the lowest it has been since the end of July.
The lowest the spread advantage has been this year is the month ending April when the pick-up was 6.98%. The maximum pick-up occurred on August 16, 2006 at 8.35%
At the average pick-up over the last 25 years of 4.89%, the S&P would have to be priced at 1,970.
Based solely on spreads, it appears that the S&P has more room to rise than decline. Of course I'm talking about long term horizons. In the short run, the spread has begun to approach
the point where some decent sell-offs have occurred this year. The May sell off started with the spread at about 7.20%. Considering how far this market has come
in the past few weeks, I would expect a leveling off or possibly a decline if the spread goes below 7.60%.
Who knows...I'll leave that to others much smarter than I to determine those points.
Good Luck
John B
jblack010@gmail.com
Sanjay, good comments on the home builder stocks. BUT, I have to disagree just bcos of ONE reason our mad bast**d Jim Crammmer also turned bullish on the home builders, which IS a very BAD sign. He is wrong 100% of the time, so he and his hedge fund buddies can rape all the guys who will buy the homebuilders at this levels.
I like to watch the OBV on my TDAmritrade realtime charts, because it helps me anticipate price movements. I find that serious buying is done on a steady stream of orders, gradually raising the OBV. Sudden, large price changes, apparently meant to shake out stops and/or panic inexperienced day traders, coincide with either no change in the OBV, or sudden large changes indicating rapid inflow and outflow of funds.
On Friday, I noticed an interesting pattern in the OBV of several tech stocks I follow (AMZN, QCOM, AMD, EBAY, YHOO). Early morning, a block of approximately 1 million shares was bought, raising the OBV, except EBAY, where a 1 million block was sold, lowering the obv. Then the whole day, a steady buying stream kept flowing in, keeping the price from falling, and near the days' end, there was large volume trading. I wonder what this was about - did some hedge fund manager suddenly order buying 1 million shares of each stock on triple witching day? I will be keenly watching the pattern Monday morning, as I suspect they will be unloading those shares on retail investors.
3:45am right on the money!!!
Sanjay have to disagree with you on the homebuilders. Yes the federal reserve may be done raising rates however if they start to reduce them once again it means we may have a slowdown in the economy on the way.
I am hearing now that the housing market decline may be over, that it should pick back up in the second half of 2007. Im doubting that, this downward cylce will take at least 2-3 years to get back to normal.
Also heard that the drop in oil will offset the slowing real estate market. Are these people that stupid. Falling oil prices will NOT keep the housing market from collapsing. I feel like a broken record when I say that the housing market collapse will lead to a recession. How anyone cannot see it is beyond me. The next recession will be alot worse than the one in 2001.
This market may rise to new highs but it wont last long, any chance to sell at the new highs should be taken. Im still prediciting a selloff in late oct, early nov. Charts may show we are going higher but didnt they say the same thing in May....
Trader 2006.
Trader 2006 - since my last post Ive looked at some historical data on the DJA. Historically without doubt Oct, Nov, Dec are panning out as the BEST months of the year. If there is no decline in the next couple of weeks, there may only be further rises until at least year end, irregardless of what level the indices actually reaches. Very worrying. There is a lot more umph in this bull than I thought. Will you still continue to hold your short positions if this happens?
Hey costas (9:07 AM), I think you hit the nail on the head. I'm a little frustrated, too, because I agree that unless we have a bear market to bring the overall market P/E's down, then the upside potential will always be limited and investors will be hesitant, resulting in choppy action.
There's just no way I'm going to pump money in going long in the markets at these levels, regardless of how positive everyone seems right now.
I want to build REAL wealth, not try to make trades for 2-3% every couple of weeks. I want to get involved with REAL bull markets, not this whipsaw B.S. we have now.
-Tony
Sanjay,
Go back to the charts of the homebuilders. Pull up a monthly chart of KBH. Do some trendline analysis. Theses charts make me doubt we are on the verge of a bull market in the homebuilders stocks. Can KBH run up for 10 points from here? Sure, but odds are when that monthly uptrend was broken this year, a clear signal was sent that the trend is changing. Remember, as the economy slows, jobs will be lost. As the Fed continued to raise rates the homebuilders (CEO's) pounded the table that interest rates don't really affect their business as much as employment. Right now they are giving incentives to move inventory. Pretty soon they will be dropping prices, and building less. Longer term, when the empty-nester boomers start "downsizing" from thier McMansions in the next several years look out, its going to get ugly! -MT
I thought this was an interesting viewpoint:
http://www.safehaven.com/article-5902.htm
I have been thinking about the inflationary factors in the market for a while, too. Definitely not a cut-and-dry situation with the markets nowadays.
downosedive
We will see. I don't think were going straight up till the end of the year. People are still questioning the rally we have had in September since September is usually a down month for the markets. Friday looked strong and then everything weakened towards the end of the day. I think we may have a down day on Monday thats why I went long QID before the close. Also think the NDX pulls back to the 1600-1615 area this week. I just dont see a continued run into the end of 2006 without at least a 3% pullback coming in the the next 1-2 months.
Trader 2006.
On Jan 14th of 2000,the DJIA had it's highest close ever,and also the highest close up this point in time at the figure of 11,722.Then we had a HUGE correction of 4500 pts. all the way down to 7286 on Oct. 9th 2002.Thats 40%.That may have satisfied the corrective needs of this market for years to come.Friday we closed at 11,560.How are we not going to at least touch that old high of 5 and a half years ago, and are we just going to sell off because we hit what will aptly be called a double top?Right now ,I don't see how it could happen with lower oil,interest rates stability,cash on the sidelines,very negative sentiment,etc.etc.I personally was either on the sidelines or short for most of the last 1000 pts. that we just had STRAIGHT UP.I'm now wondering am I going to miss another 1000 pt. rally. It's entirly possible that could happen going into the end of the year.So the charts and graphs that most of us bloggers look at are NOT telling us what the real story of THIS market is.Unfortunatly for die-hard bears,and I am guilty of being in that camp more or less,I think the BIG correction wiil come only from much higher levels now .We'll probably hit the 11,722 figure again this week.Do we get a good selloff,or do we get a buying spree thats takes us to 12000? I'd love to hear a couple opinions and therories. Luck to all !
Denver
Hi Sanjay, I have to disagree with you on the homebuiliders. I had watched a Head and Shoulders pattern on KBH Home (KBH) that completed on
april 12, 2006 when price fall below neckline, then 3 days laters price made a test of this neckline and took a downway to south.
First target of this H and S pattern was achieved on july 18, 2006 when price almost reach 36 level; since then, price had apparentely formed a double bottom. However, my view is that ¨hanging man¨ of friday 15 is saying: ¨I am going again to south¨
I think that on next weeks KBH will down below 26 level. Remember, best chartist pattern is a Head and Shoulders formation.
But all isn´t bad; I had discover a stock that had stablished a solid ¨inverted Head and Shoulders Pattern¨.
This stock is SNPS (Synopsys Inc (NASDAQ GS)), which is in a rising sector in this moment.
Dear Sanjay, thanks you for you very worthful comments.
Bye for now
Mr. Midas
"Senators are expected to vote later this month on a bill that would impose 27.5% tariffs on all imports from China in retaliation for the alleged currency advantage."
from the WSJ (Sep 18th)
If this passes expect the markets to tank.
- Trader Fred
John B - great analysis, but BONDS are seriously over-valued, so your numbers in the end are bordering on bubble territory.
Corporate profit margins are running at 10%, double the historical average. This is mainly due to two things, inflation and not paying worker's enough. Once people are no longer able to withdrawal equity from their homes and spend it, they will be pressuring co's to pay them more. Also, does anyone seriously think we can keep corp. profit margins growing at these levels? I agree with pb, double top is the most likely scenario.
I am mid/term bullish but short/T bearish...IAm short SMSI VC GNSS STP BGC SPWR CBAK....I also short CRA TNOX...I think S/T overbought...might need some kind of correction after FED meeting.
Once upon a time there was a mythical mountain of infinite height. One day a large party set out to climb this mountain. After gaining 500 feet, one nervous guy said, "This is high enough for me, I'll wait until you come back down."When they reached 1,000 feet another guy claimed this was high enough for him and he would wait for the others to come return to his level. This pattern was repeated with regularly with people dropping out the higher they went, but the majority kept plugging on.
It is said that some still continue the ascent whilst the slopes are littered with those that sit and wait, fearful of going any higher.
Climer one.
Thank you, but remember I am not trying to say whether bonds are overvalued or not...just that between the two, stocks or bonds, stocks offer the better value and that most money managers really only have one or the other to buy...we may have upside pressure to very high levels.
As I posted last week, the S&P 500 would have to get to 1,970 just to get the spread back to the 25 year average. I think that may discount a lot of "problems".
I rmemeber years ago, the Journal did a story that less than 1/3 of the Wall Street economists got the direction of interest rates for the next quarter, let alone the level. I certainly am not qualified to state which way rates will go, only make an observation that stocks offer the better value.
Good Luck
John B
John,
If you use Stockcharts and chart VTI against TLT, the RSI on the daily is about 60. In May, the RSI ratio got above 70. So bonds were a buy in early May when the mkt hated them. And a sell on June 12 when people rushed to buy them after the mkt tumbled.
At best, both are a push at this point in time. I don't expect you to change your thought which based on absolute figures but I offer my thoughts to those looking at relative valuations.
Based on those relative valuations,
I think we could see some snapback rallies in gold and silver to the RSI 50 area ($gold:tlt and SLV:tlt). In any case, entry points are lower risk at these levels.
bsi87
They will keep pumping money into this market to reach new highs just before the elections, so the Repubs can claim that the economy did so well under them.
This is clearly an artificially propped up market!
@7:48
Quite clearly you are correct sir. The question is who? Big brother? The Klingons? Or is it the USSR KGB? So many enemies everyware!
If you are looking for "reasons" that stocks or markets make large directional moves, I can tell you that you will probably never know for certain.
Large institutional investors and well capitalized players move markets for reasons known only to them. Since we are dealing with perception of markets-not necessarily reality, you are wasting your time looking for the many reasons markets move.
A huge mistake most investors make is assuming that markets are rational or that they are capable of ascertaining why markets do anything. To make a profit trading, it is only necessary to know that markets are moving-not why they are moving.
The most profitable traders only care about direction and duration, while market losers are obsessed with the whys.
My Small Cap Swing indicator moved to a LONG signal early on 9/12/06. At +74, it is very close to switching SHORT.
Here are the recent values of my Small Cap Swing Indicator:
. . . . . .Small
. . . . . . Cap . . . . . . . . .Russell
. . . . . .Swing . . . . . . . . .2000 . . . Cumulative
Date . . . Ind . .Signal . . % Chg . . . . % Chg
08/28 . . +05 . .LONG . . +1.1% . . . . +1.1%
08/29 . . +23 . .LONG . . +1.2% . . . . +2.3%
08/30 . . +39 . .LONG . . +0.8% . . . . +3.1%
08/31 . . +48 . .LONG . . +0.0% . . . . +3.1%
09/01 . . +52 . .LONG . . +0.1% . . . . +3.2%
09/05 . . +62 . .LONG . . +0.8% . . . . +4.0%
09/06 . . -19 . .SHORT. ..-2.1%. . . . . -2.1%
09/07 . . -43 . .SHORT. ..-0.8%. . . . . -2.9%
09/08 . . -61 . .SHORT. ..+0.3% . . . . -2.6%
09/11 . . -72 . .SHORT. ..-0.1%. . . . . -2.7%
09/12 . . +18 . .LONG . . +2.4% . . . . +2.4%
09/13 . . +41 . .LONG . . +0.8% . . . . +3.2%
09/14 . . +54 . .LONG . ..-0.4%. . . . . +2.8%
09/15 . . +65 . .LONG . . +0.2% . . . . +3.2%
09/18 . . +74 . .LONG . . +0.3% . Intraday @ 1:45pm ET
Normal LONG target: . . +65 to +75 (max: +95)
Normal SHORT target: . -65 to -75 (max: -107)
I remain 100% invested in SHORT positions as of Friday, the 18th.
what a insane market
How many down days on SEP??
unreal
To the anonymous poster at 8.53AM - in its simplest form - you are spot on, pure and simple. There is really nothing more to add. Others should take it or leave it. But if you leave it, you will be spending the rest of your days shaking your heads and asking 'why, why, why'? As for, anonymous poster at 8.53AM - reveal yourself sir!
Anonymous 8:53am,
Hear, hear. I couldn't have said it any better.
Last time I checked, short term we are trading price action.
I don't get into the double reverse bullish/bearish psychoanalyzing that SO many people do. It's pointless. It reminds me of Vizzini from the Princess Bride chosing which goblet to drink from. When the market wants to go up, bad news is good news. Eventually when this rally is over, bad news will be bad news again.
The only way is to focus that energy on market direction and duration.
Post a Comment