
Bad News Bears
Today started off well enough. The market's modest rise in the morning got blown to smithereens by the drop in housing prices (for the first time in 11 years), and oil services was down hard. It was enough to make a bear's heart go pitter-pat.
Sadly, the bulls took charge and stampeded most of the day. The Dow was up over 100 at one point, although it eased back to close up "only" 70 points for the day. OIH, $OSX, and other oil-related stocks formed hammer patterns, signaling a short-term bottom. So what started off as an "A" day wound up a "C-".
Let's take a step back and look for the past decade at the Dow 30. You can see why people don't really know what's going to happen next. We're at the very top of a large upside-down triangle. Busting through lifetime highs would take ungodly strength (and would cause me to jump off the nearest bridge). Sinking into another stairstep-down pattern seems completely elusive at this point, although that's the only thing that will make this "our" market.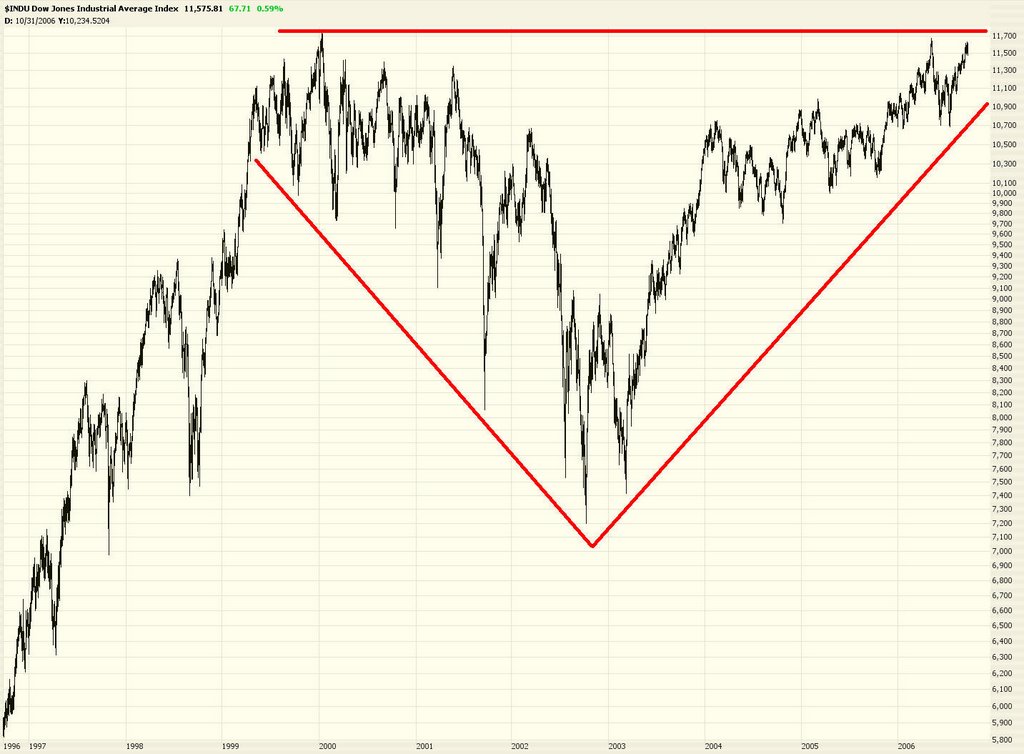
The SPX, a broader index, isn't nearly as close to its lifetime highs, but it certainly received the "all clear" signal from the bulls today. There is a meaningful amount of upside between the current SPX price and the next Fibonacci retracement level. That isn't good news for us bears at all. Today is the kind of day that shows the bulls are still firmly in charge, even in September, historically the weakest month of the year.
The $OEX is pretty much perfectly at the 50% retracement level.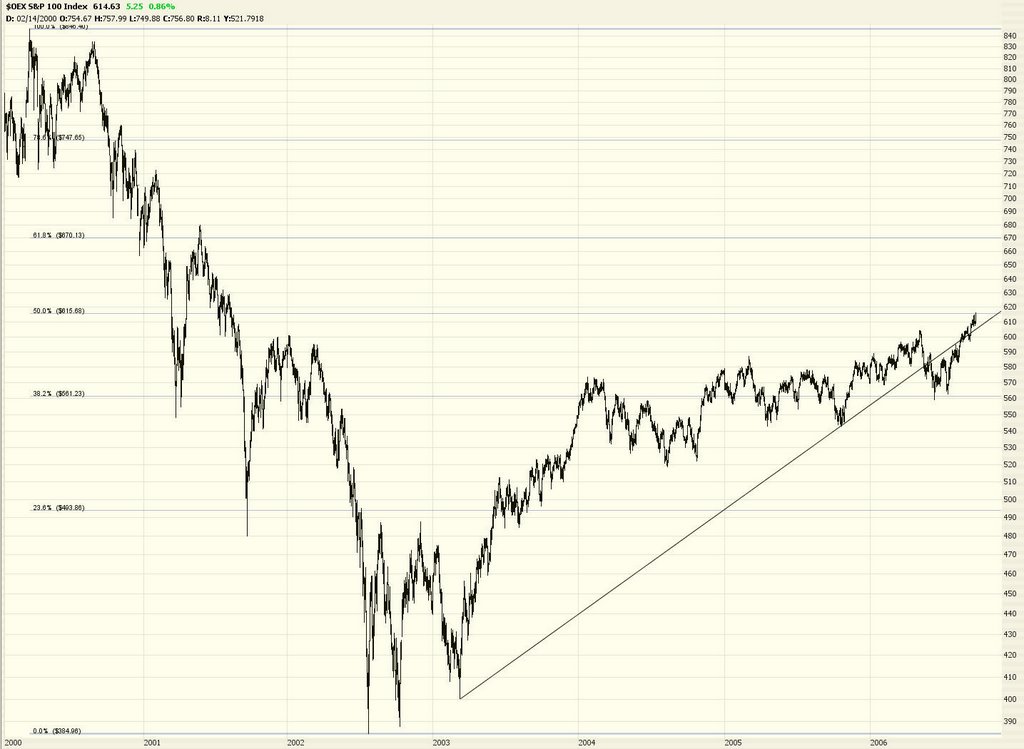
The $MID to me is looking sort of alluring as a potential put purchase. The stop price is pretty tight. Mind you, today's action is not encouraging. But if it's a one-day wonder, looking for shorts at these lofty levels is a good exercise.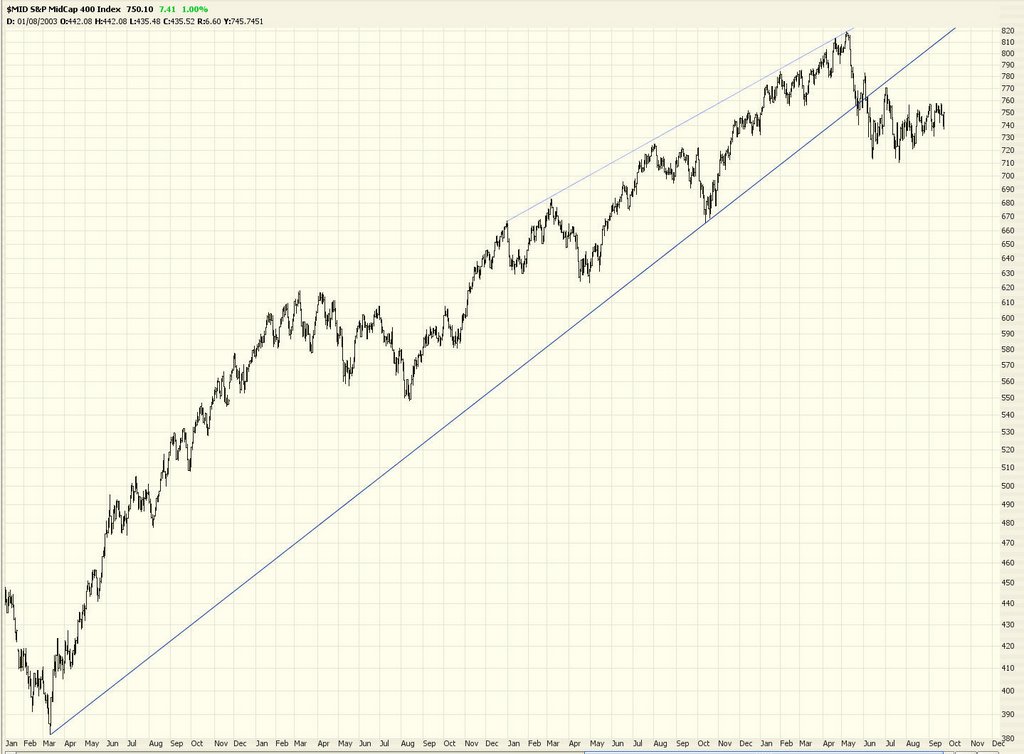
One honest-to-goodness down market that's been really good to me lately is oil. The $OSX, shown below, is very similar to the OIH, and you can see its squeaky-clean head and shoulders pattern. Things might have bottomed out for the short term (like the next week or so), but it's been great so far.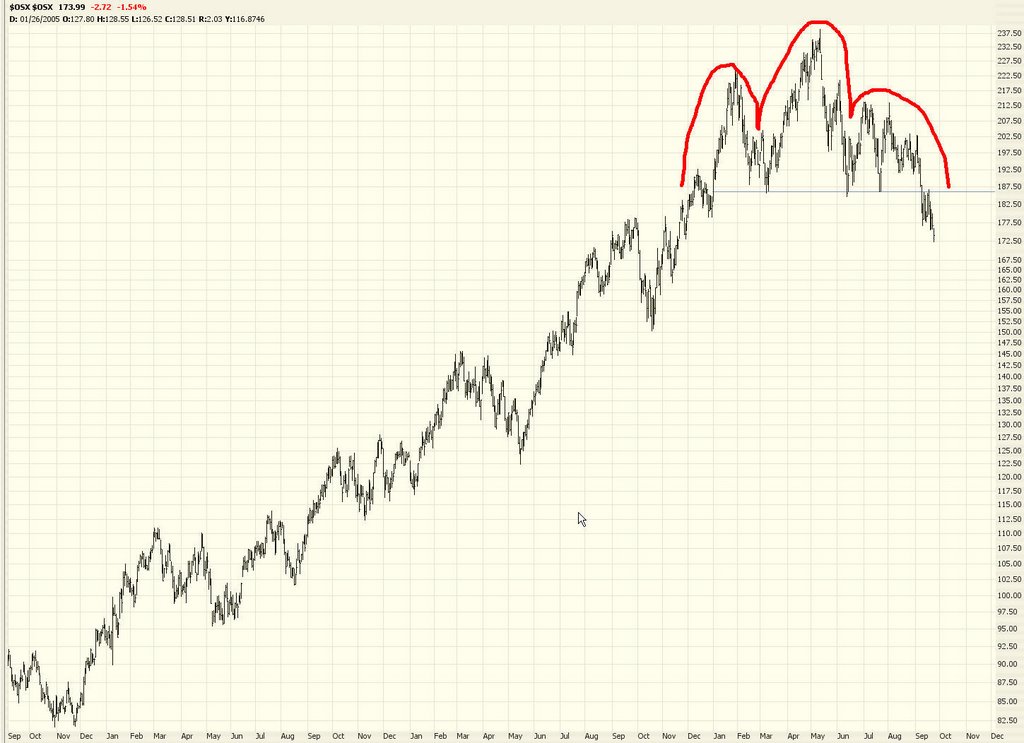
I recommended Massey Energy, for example, weeks ago. It has taken a terrific tumble.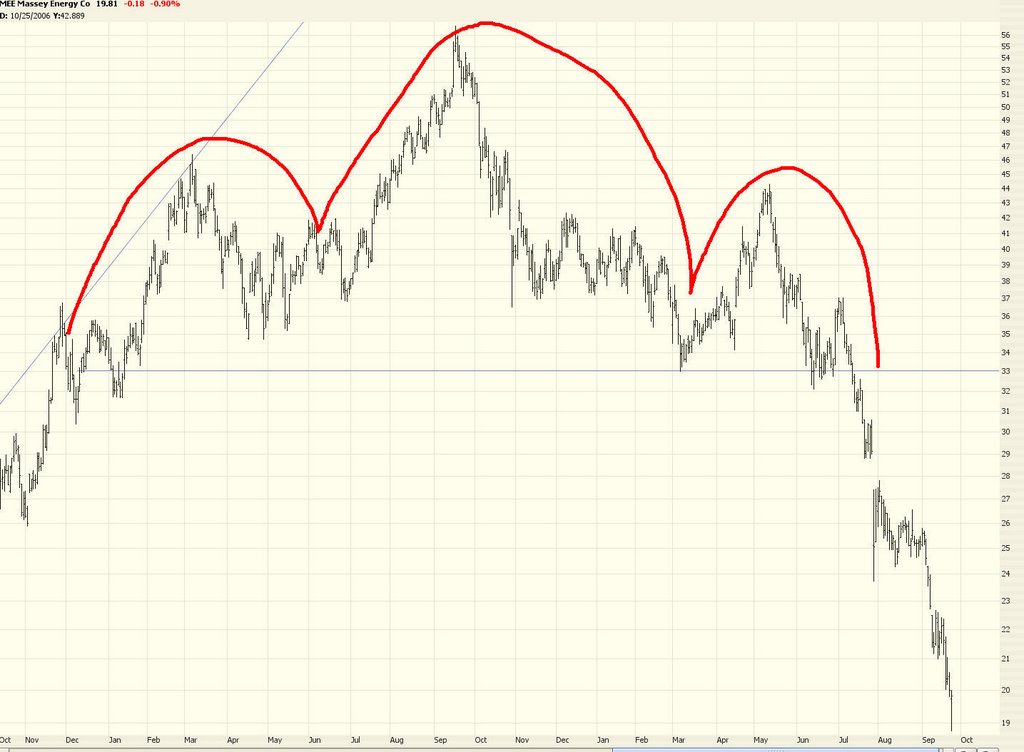
But take a look at today's candlestick pattern. A honkin' big hammer. That spells short term bottom to me.
The NASDAQ 100 is extremely close to the make-or-break point for bears. Crossing above the line shown here would spell bad news for at least a little while for the bears.
Hilton (HLT) caught my eye today as a short candidate.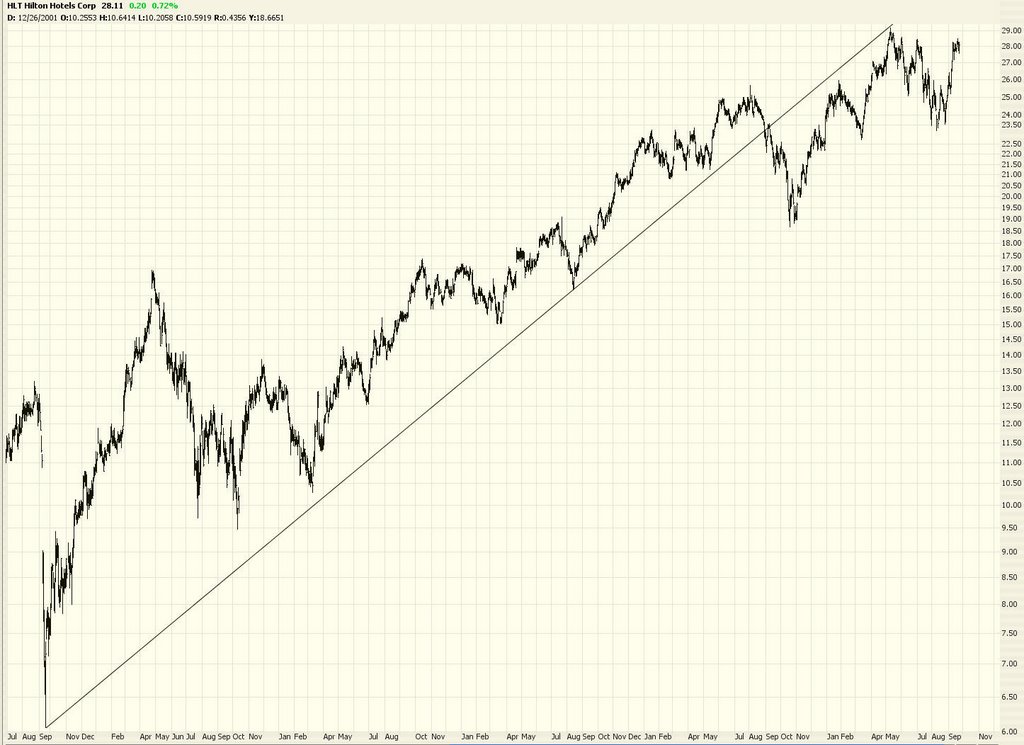
As did NOV, which is in my (obviously) favorite pattern, the H and S.
For those skeptical about the still sky-high REIT market (in spite of all the bad real estate news), take a look at SPG.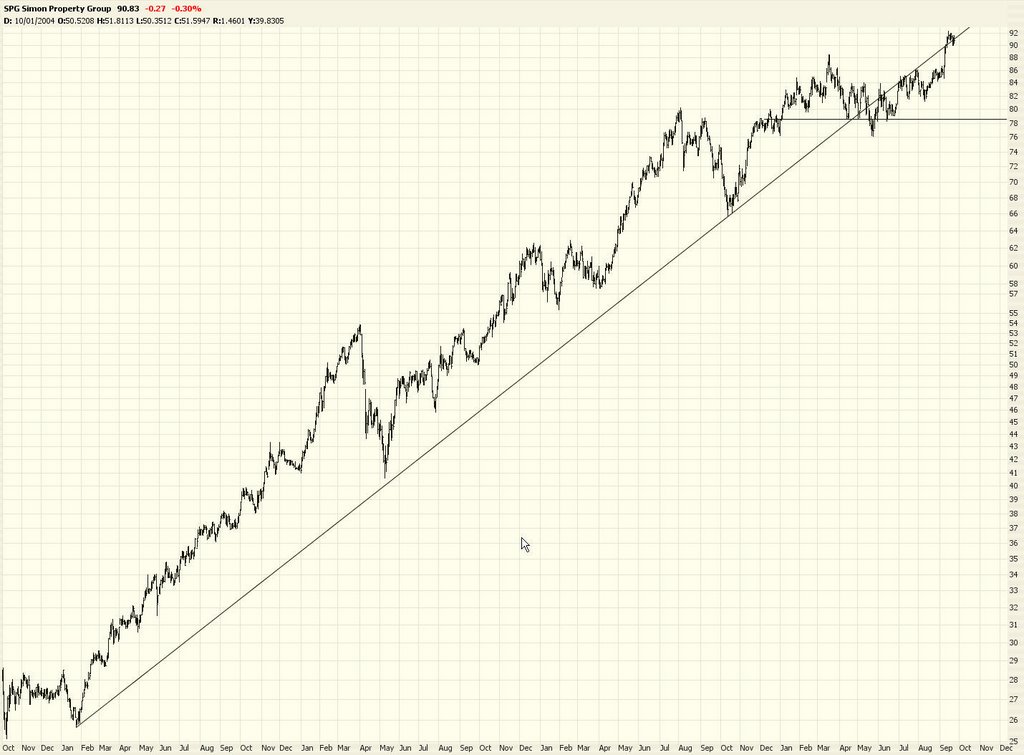
43 comments:
It's funny how there are very few or no comments when the market beats us bears up.
Great blog and please keep th efaith.
Tim, what's the due date on the book again?
Two words will topple the market.....EARNINGS AND REALITY.
The book is supposed to come out in February. You can actually see it on Amazon already.
http://www.amazon.com/Chart-Your-Way-Profits-Technical/dp/0470043504/sr=8-1/qid=1159229998/ref=pd_bbs_1/002-8579073-1268009?ie=UTF8&s=books
Tim, many thanks for your generous usage of your valuable time to help us. Please further educate us on why inverse head and shoulder bottoms are not as interesting to you as your "favorite pattern" H & S tops. Wasn't the current strong rally in the broad SPX index clearly predicted by the inverse H&S bottom in June 2006? True, it had a downsloping neckline, but the neckline was clearly broken to the upside in late July 06, then prices retraced beautifully just as expected to touch the neckline, launching the strong rally which has followed to the present time.
Your comments will be much appreciated. Anonymous 9
There is a certain air of wobbley confidence, not just in the DJA indices behaviour, but also in many analysts and brokers daily market commentries. I have no confident opinion as to which direction this will take. All I can say is, I cant see anyone on this site taking any new short positions on the DJA indices in spite of its excessive level. I presume all others are like me - not confident enough to speculate
im with ya downosedive, the only thing im sure of in this market is that i have no clue what is going on, i've gotten hammered in puts , stopped out , made some $ in a few long trades but actually was less sure of the winning trades than the losers because of the state of the economy, globally and locally, right now, but you know what , mr market did'nt give a shit what i thought, he just either brought me with him, or ran me over ,(more often) on his way,. does the market make sense, no, do some companies at all time highs deserve it, no, but at this point the market does not give a shit, for whatever reason. unless your looking for long term or dont use stops, you can trade and make some money, but you must be adaptable, is all im saying, THE PATH OF LEAST RESISTANCE
your right on pb, like tims been makin fun of these last few weeks, no news is good news, bad news is great news, good news.... well i have'nt actually seen any good news, but what the hell,, RALLY!!! woohoo,
i think i'll become a raging alcoholic, maybe then i can make sense of this shit or not care, either way... hope spings eternal, but so does herpes..
Another up day, seems like the bulls will take any news and run with it. Anyone check out the news on LEN, said the housing slowdown is worse than expected.
The company cut its fourth-quarter forecast to a range of $1.00 to $1.30 from $2.55 to $2.60.
hahaha and the damn stock is up 80 cents. GO FIGURE!!!!
Trader 2006.
Hey Tim, I don't usually post here, but I thought your comment today was hillarious.
"Busting through lifetime highs would take ungodly strength (and would cause me to jump off the nearest bridge)."
I'm on the short side also, as you can see from my September 17th post at www.whammies.blogspot.com
I'm fully ready for a dive, buying a safe amount of DXD. I think it's an excellent hedge for those of us who don't trade options & futures.
-Anyway, I find the short charts helpful on your site, thanks for the ideas.
This is a bad day for the bear the market overcame its overhead resistance and it has the volume to. No sense going against the turn now.
costas1966
If I read one more comment about being in/near a recession I'm gonna puke.
When is it going to show up in the market, earnings or consumer spending?
So far all this talk has done has increased short interest, which has fueled a huge market rally.
You can gather all the information that is available, but it still doesn't seem to help because how the market will interpret it is totally unpredictable.
..frustrated rant mode off...
nasdaqshould go negative.
Short-term traders will move to an on-guard posture should the SPX cross below the 1,309 mark for more than a day or so. Similar levels for the DJIA and COMP are 11,455 and 2,200, respectively. While these support levels are likely to lure some buyers into the mix, a break below will likely come at a cost, since the situation with the VXO and other sentiment indicators will become increasingly unstable and add to the market's selling potential. In other words, the market once again is in a must-win situation for the short-term trend to continue to the upside.
Here comes the selling.
Mike
they couldnt take the dow negative!
re:PEIX
I was early per usual. It's showing an intraday reversal. I'll put a stop at 13.11 GTC. Volume is picking up. People beating the enthanol horse to death on way up and beating it to death on way down. Long at 14.78. Break above 15.10 would put it on a run again IMO.
Re:rates, housing, commodities, etc.
When they ask if the commodity run is over, it's not. Rates dropping on spec that the Fed's done. Fed's in a box IMO. They hike and they don't kill housing speculation, they kill business lending and expansion plus shoot the consumer in the rear. They don't hike, the dollar falls, commodities go up on a dollar basis, gold soars. The Fed will continue to stagger down the street as each datapoint swings them from one side (tightening) to the other (loosening). Fisher sez some bullcrap and the mkts take off.
I went short TLT a few days ago. Too early on that one as well. A lotta people excited about low bond rates and how bonds have outperformed the mkts since the May peak. Rates look overdone on the downside.
re:oil/OIH. Watching OIH 130 level. Chance that it could break above it and end the selloff. Full disclosure: short OIH.
re:SLV. Breaking above resistance at 112-113. If it holds, there's 8 pts there.
re:Indices. Can't get excited about going long or short.
bsi87
Suprised to see oih, pxe and pxj show a very big reversal this morning.
Trader 2006.
Nasdaq is already weak if the dow decides to join expect a nice selloff into the close.
Trader 2006.
My Small Cap Swing indicator moved to a SHORT signal early on 9/19/06. The current SHORT signal is at -43 on 9/26 @ 1:00pm ET, barely staying SHORT and at the same value as last night’s close. Much more upside and it will switch back to LONG. Can’t believe this!
Here are the recent values of my Small Cap Swing Indicator for the last four switches.
. . . . . .Small
. . . . . . Cap . . . . . . . . .Russell
. . . . . .Swing . . . . . . . . .2000 . . . Cumulative
Date . . . Ind . .Signal . . % Chg . . . . % Chg
08/28 . . +05 . .LONG . . +1.1% . . . . +1.1%
08/29 . . +23 . .LONG . . +1.2% . . . . +2.3%
08/30 . . +39 . .LONG . . +0.8% . . . . +3.1%
08/31 . . +48 . .LONG . . +0.0% . . . . +3.1%
09/01 . . +52 . .LONG . . +0.1% . . . . +3.2%
09/05 . . +62 . .LONG . . +0.8% . . . . +4.0%
09/06 . . -19 . .SHORT. ..-2.1%. . . . . -2.1%
09/07 . . -43 . .SHORT. ..-0.8%. . . . . -2.9%
09/08 . . -61 . .SHORT. ..+0.3% . . . . -2.6%
09/11 . . -72 . .SHORT. ..-0.1%. . . . . -2.7%
09/12 . . +18 . .LONG . . +2.4% . . . . +2.4%
09/13 . . +41 . .LONG . . +0.8% . . . . +3.2%
09/14 . . +54 . .LONG . ..-0.4%. . . . . +2.8%
09/15 . . +65 . .LONG . . +0.2% . . . . +3.2%
09/18 . . +70 . .LONG . . +0.0% . . . . +3.2% (short triggered)
09/19 . . -06 . .SHORT. ..-0.5% . . . . -0.5%
09/20 . . -05 . .SHORT. ..+1.2% . . . .+0.7%
09/21 . . -13 . .SHORT. . .-1.0% . . . ..-0.3%
09/22 . . -37 . .SHORT. . .-1.2% . . . ..-1.5%
09/25 . . -43 . .SHORT. . .+1.2% . . . ..-0.3%
09/26 . . -43 . .SHORT. . .-0.1% . Intraday @ 1:00pm ET
Normal LONG target: . . +65 to +75 (max: +95)
Normal SHORT target: . -65 to -75 (max: -107)
I remain 100% invested in SHORT positions as Friday’s close, 9/15/2006, when the trigger was close to switching.
Trigger is close to switching LONG, though.
I HATE INTERVENTION – WHERE ARE FREE MARKETS?
they are trying so hard to get this dow to record levels. Nasdaq is barely participating. I think if we rally through october and november which I dont think is possible you can forget about your "santa clause rally".
Trader 2006.
Businessweek has a technical analysis column...they made an interesting observation. Money, so far, has not left the mkt. It is rotating rapidly thru sectors/stocks. For example, bonds looked awful at the beginning of May. They're up about 10% in 4 months. Technology (XLK) looked awful in mid July, it's up 15%. So a cross sector analysis ala John Murphy helps to identify overbought and oversold sectors. Entry/exit points are a heckuva of a lot more difficult. I lost some positions yesterday to see them rally hard to day,e.g. oil/gold.
John the Bond Man is right and wrong. There have been times since the beginning of the year that stocks WERE undervalued in relation to bonds. Today equities are about mid range. To get undervalued, bonds have to rally more and/or equities have to fall or a combination. Don't know when or if that'll happen but my personal opinion is that it'll be late October. The big boys gotta make their bonus. (GRIN)
Oils looked cheap compared to bonds/gold. Could stay cheap but I'm looking for some sort of a contrarally.
bsi87
PS keep in mind when/if equities sell off, the bears will be dancing as if it's the end of the world as we know it which mark the bottom. No bull will want to buy.
17 points from a new dow hi as I type this.
I can hear Paulson on the phone coordinating the final set of buy programs that will put it over the top so Bush can go out and campaign on 'new highs in the stock market' cause he got the economy going so fine..
..yeah, right
watching the NYSE tick...was +1500 a few minutes back but it wasn't quite enough
11:40am agree with the buy programs pushing the dow to make the headlines look good for bush in november....pretty pathetic...
trader 2006
11,709.10 is the high
10-May-06 11,630.48 11,709.09 11,545.64 11,642.65 2,268,549,888 11,642.65
8 days later the dow traded as low as 11,040 so its anyones game after we touch new highs on the dow.
Trader 2006.
FULL.........METAL.........BULL...........SSSSIRR!!!
Remember the film? All the BULLS HAVE COMPLETELY FLIPPED and all the bears are in danger of going the same way. Will someone please show me the exit from this madhouse!!!
sick market
OK, so the bears on this blog are getting pissy. All we need now is trader fred to come along and use the "F" word 27 times in a 9 word sentence and its time to go short.
R41
Nasdaq up but should be up just a bit more compared to where the dow is. The buy programs are just buying up everything to get this market higher. It moves up 80 down to 73, back up to 82 down to 79 then up to 86. Now up 91, im sure it will push 100+ in a few minutes...
Trader 2006.
What's goin' on here? Is everyone flippin' mad? Where are the bearz???
I'm broke!
-Trader Fred
so what is the point of trying to figure anything out? I mean really?
just buy long and go away for 20 years....lol
[throwing hands in the air..]
I think these markets were easier and fun to trade when we had the massive volatility that we had in may, june and july. Now that its straight up you never know when your going to get that massive down day. Constant rallies day after day. This is what the bulls felt in July when everything was sinking, if they held in there they did quite well. Now its the bears turn, remember its always quicker going down then up.
Trader 2006.
Also when we reach that new intraday high at about 11710 whats it going to be. I think once we settle above new highs on the dow we will have more increased volatility then we have been having these last 4-6 weeks. To see a 100-150 point pullback on the DOW should NOT suprise any investor at this moment.
Trader 2006.
perhaps its all the money leaving the commodity area, and looking for a new home is landing in equities
makes as much sense as anything
huge amounts going into bonds too
we need a commodity rally!!
12:47 exactly, they are rotating from one sector to the next, i think oil/gold selloff went straight into tech....
Trader 2006.
What a pump!!!!
the intra-day high on the DOW is s/thing like 11,900 set in Jan 2000
- Trader 'fubard in the ass' Fred
January 14, 2000 Intraday high at 11,908.50. Close 11722.
9 days later dow closed at 10,738.87
MORE than a 1,100 point slide in 9 DAYS.
Bring on the new highs...I wouldnt mind a repeat of a 1000+ point selloff in 2 weeks.
Trader 2006.
from Morningstar:
The Dow reached an all-time intraday high of 11750.30 on Jan. 14, 2000; the all-time closing high of 11722.98 occurred the same day.
tomorrow?? this week??
or in about 5 years....?
THE HIGHEST CLOSING ON THE DJIA IS 11,722 ON JAN.14, 2000.HOW CAN ANYONE BE SHOCKED THAT THE MKT WOULD ATTEMPT A RE-TEST THIS WEEK ? WE'VE GOT $60 OIL.NO MORE INT.RATE RISES FOR A LONG TIME. ALL THE DOW STOCKS MUCH MUCH HIGHER THAN A YEAR OR EVEN 6 MONTHS AGO.THIS IS THE LAST WEEK IN THE 3RD QTR. OF AN ELECTION YEAR.NOT TO MENTION THAT WE STARTED OFF ONLY 200 PTS. OR SO FROM THAT ALL TIME HIGH.IF YOU ARE REALLY TOTALLY SHOCKED ABOUT THIS WEEKS UPWARD MOMENTUM, THEN YOU SHOULD PROBABLY KEEP ALL YOUR MONEY IN THE BANK AND NEVER EVER TRADE AGAIN !!
We can lose 5-10% in 2 weeks, it doesnt take much to see this market drop. Back in June and July there was selloff after selloff. We lost nearly all of 2006 gains in 2-3 weeks. Just because we are sitting close to new highs doesnt mean the dow cant sell off to 11,000 by mid october. I think if we saw a 3-5% pullback before the end of 2006 that 12,000 on the dow would certainly be possible by the end of the year. These markets need a breather.
Trader 2006.
looks extended, hope we get a 50 point rally, then it's feasting time!
Tim, my friendly question of Sept. 25 at 7:32 p.m. has still gone unanswered by you and all of the other bears. I guess my mention of the overlooked bullish signal (inverse H&S bottom in June) must have been embarassing to the bears. Otherwise, why not comment on it?
"Anonymous 9"
Post a Comment