
Empty Motion
Yawn. Oh, is the market closed now? OK. Yeah, the market was down a bit today. Big deal. There's still clearly no firm direction.
I've noticed things have become so placid that there are instances where puts many months in the future are basically free. Take a look at the chain below. At the time this was taken, the intrinsic value of a $30 put was $6.61. And what's the bid/ask of the April 2007 put? 6.60 by 6.70. (The 5 contracts you see are mine - I was the only volume). Notice also that the ask price is the same month after month. How's that for low volatility? If you take a look at the stock chart, you'll see maybe it shouldn't be so...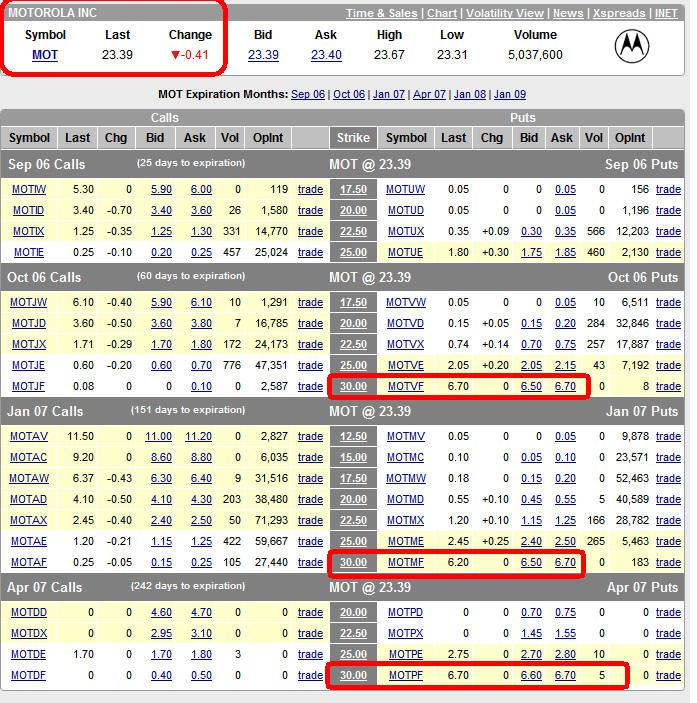
And what's the most boring stock of all? How about multi-billion dollar powerhouse Google? This used to be all the rage. Now it's just sinking into a modest sine wave of nothingness. Look at the past ten months on a percentage scale, shown below. 0% change. Whoo-hoo!
Here are a few more short ideas on this otherwise ho-hum day........Adobe (ADBE):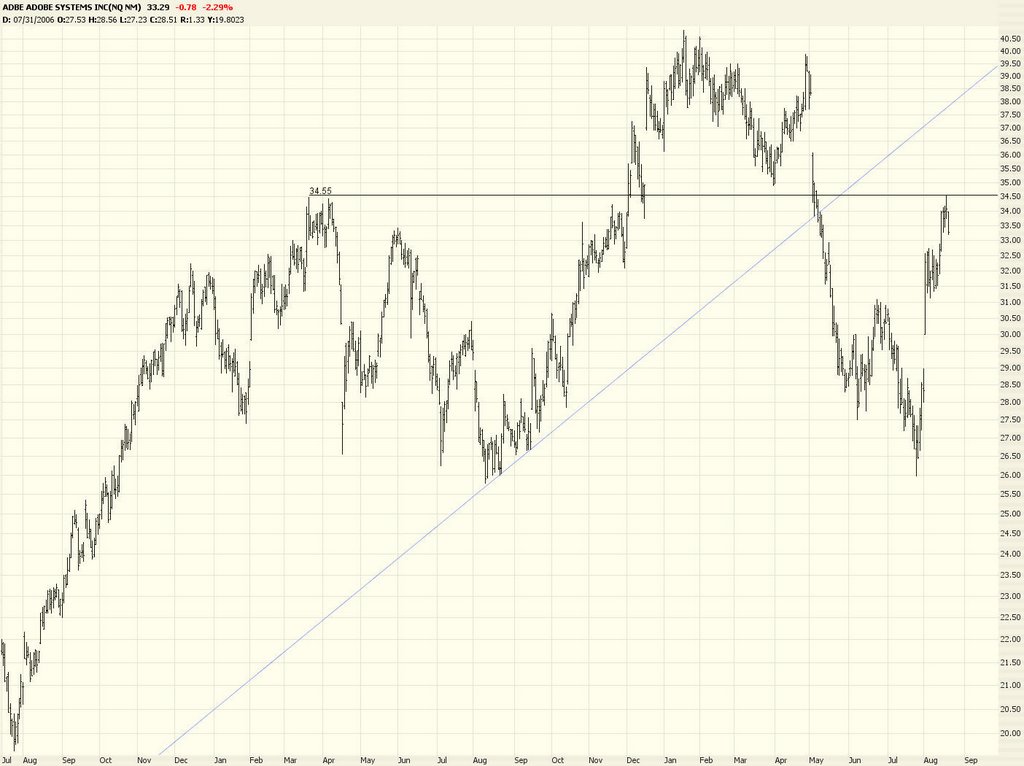
AIG International (AIG):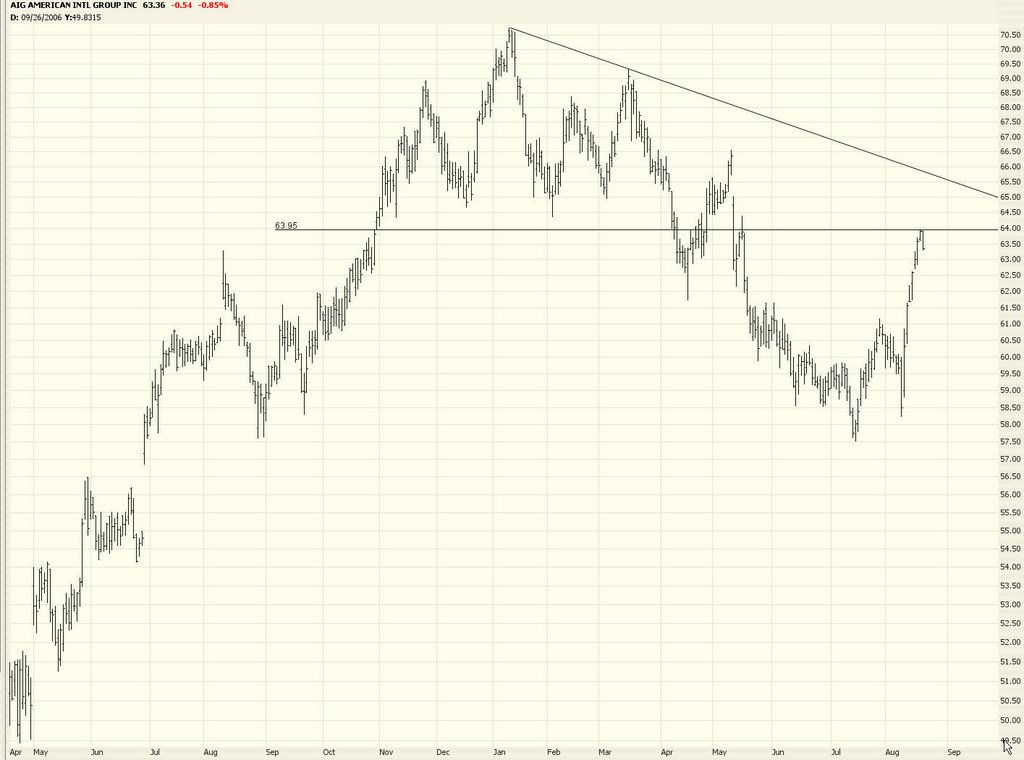
Black & Decker (BDK):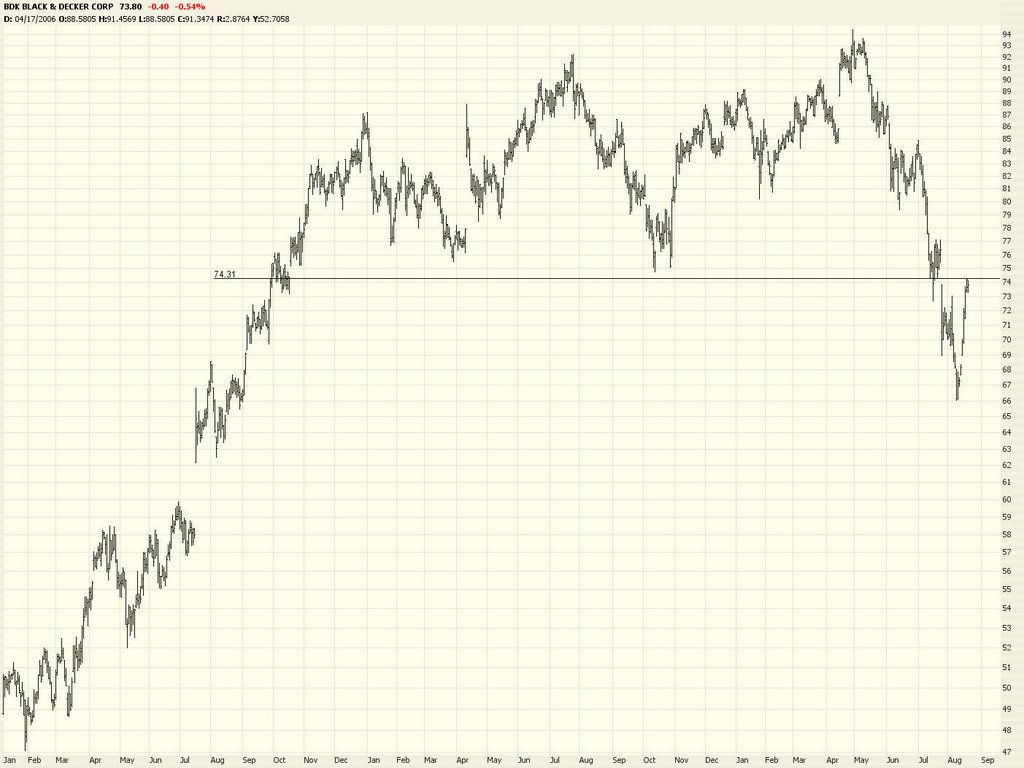
Chicago Mercantile Exchange (CME):
And even Microsoft (MSFT) which seems to be bumping against the other side of its long-ago broken trendline.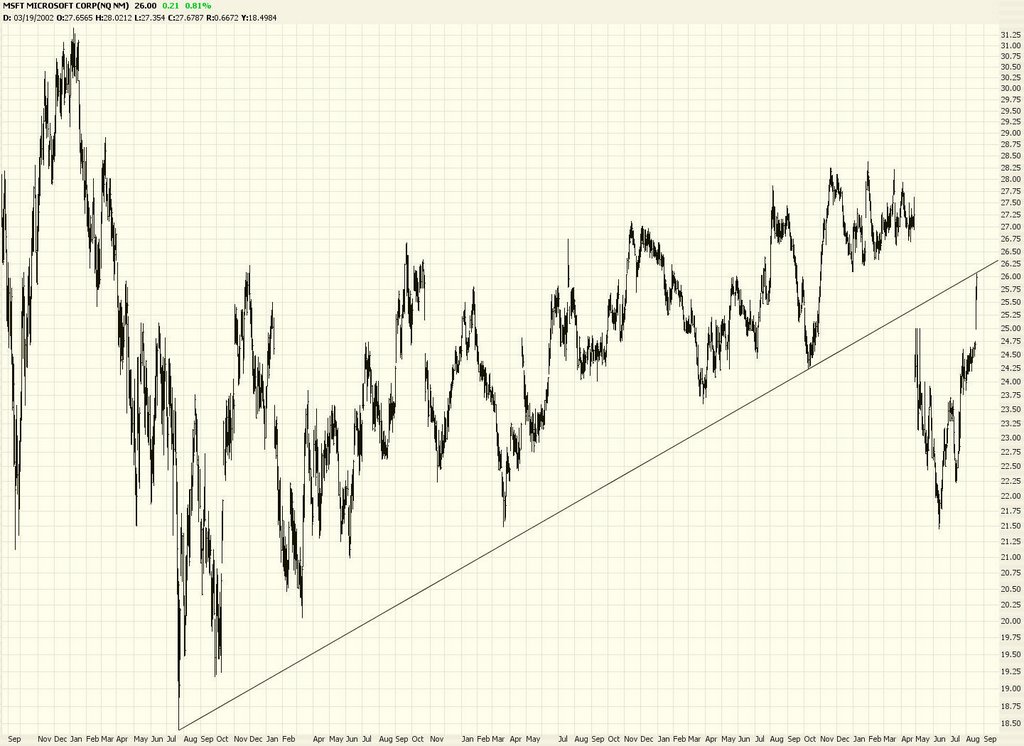
40 comments:
Tim - I have a prophet java chart up on MSFT - Line, 5yr, Daily - I drew the same trendline as you have - but I have a crossover of the trendline which would indicate a bullish move - what service are you using from prophet and why the discrepency - any help would be appreciated.
Tim you reccomend shorts which are touching resistance. Wouldn't it be safer to short stocks which have just broken support? It seems ur betting for a reversal.
Can someone please tell me if there are any significant data coming this week? Inflation or otherwise?
I think based on a pullback, which is, really, should be happening very soon (based on the price movements as of late), I would think stocks touching resistances are also safe bets (and obviously ones that fail support), or those in upper bollinger ranges, etc.
It should be easy money for the next couple days, really. (never really works that way in practicality, now does it...)
The volume is very disturing though. Calm before the (real) storm perhaps?
guys, take a look at AAPL - a lower high. macd crossover/negative divergence.
looks like a beauty. Im still keeping my eye on a lot of housing puts, they are getting dangerously close to supports. MTH/BZH/TOL/JOE/LEN, etc, etc, etc - they should be able to fatten up that equity account of ours pretty soon.
Sometimes Nikkei index is a good indicator of what the US market will be like next day, especially when economic numbers and earnings reports are few. I think Nikkei could pull back a bit...very similar to Dow, after reaching top curve soo quickly
>>>Nikkei
>>>Dow
short intu !!
What I like for puts from Friday and today from the DOW30:
AIG - Tim already picked this one, but I like it too. I started buying small puts on Wed. and my biggest this morning.
MMM - Topping over and headed down and overbought.
GE - Topping and overbought, reaching resistance line from 5/8/06, just a shade over 200MA, while 50MA & 15MA are under 200MA.
HPQ - Topped headed down. Has about $0.50 to get to the support line from 7/21/06. Maybe not a great pick, but it may pick up steam if DOW drops.
MCD - Topped, and headed down. Expect the next bottom to be around 200MA, but much lower if DOW drops.
IBM - A great one poised for a fall, IMHO. Looks very much like AIG. Just touching off resistance from 12/7/05.
I have a serious question for everyone. Please answer it as completely as you can, if possible:
Two Fridays ago (the Friday before the 5-day rally), everyone in the world was decidedly bearish. And by that, I mean that all the talking heads, economists, self-proclaimed experts, chartists, etc. Everyone was pointing to huge resistances at 11100, 2100, and 1280 for the major indices. Most people thought that it would be near-impossible to breach those levels without a significant amount of trying.
But then, a "miracle" happened. All of those levels were breached in a straight-as-an-arrow upward climb in EVERY major index, all at once, for 4 straight days.
Now, here's my question: If *everyone* was expecting the market to decline or at the VERY LEAST, bump up against resistance levels and stall, then please tell me WHY those resistance levels were broken soooooooo easily and quickly, without a single moment's hesitation???
I guess what I'm alluding to is the fact that there must have been a SIGNIFICANT amount of manipulation involved to accomplish that huge 300-point rise in the Dow, 160-point rise in the Naz, and 40-point rise in the S&P.
I just don't quite understand how anyone can possibly say that these markets aren't heavily manipulated. I mean, let's get real. Every index rose like they had major hard-ons for 4 straight days. That's not simply "coincidence" or "bullish buying interest."
That's just my take. But I would like someone to please explain how it is NOT manipulation. I.e., how the indices rose like that IN UNISON, breaking all levels of heavy resistance, without slowing down one little bit.
-Tony
And please don't start quoting the PPI and CPI figures. The CPI was 0.2% instead of 0.3%. Hardly a major bullish figure. And the PPI readings mean pretty much zilch when it comes to REAL inflation.
Besides, with a +/-0.05% error in those reported values, how can anyone possibly think that those numbers were sooooo great so as to inspire a 4-5% rise in the major indices.
-Tony
Tony,
Please, it's getting tiresome to hear all this manipulation and stuff. There is no manipulation. There are thousands of hedgefunds and your big bad market makers. When the big money is on one side, it will simply eat up the supply. What is there not to understand? Suppy and demand?
Trader II
Cramer called last weeks rally a 'counter-trend' rally. WOW, he does have the decency to call a spade a spade --- the world has hope!
Trader Fred
Hey, Trader II
Tony is an alright guy. Why do you gotta bounce on his balls like that? He's just looking for some insight, plus he probably had some AUG puts left-over
Frank the Tank
Frank, don't be too concerned about Trader II. He likes to call bull runs after they happen and pound the table about his great calls after the fact. He'll likely miss out on the selloff and get caught long on all his positions while they take down the markets as he continues to look for Dow 12,000.
Besides, he still didn't answer the question. "Supply and demand" doesn't cut it. Hedge funds and market makers ARE the source of manipulation, my friend.
What you call "simple supply and demand" is not all that simple. The fact of the matter is that the big money players can push this market around in whatever direction they want, regardless of the economy, earnings, guidance, P/E, or whatever else you want to value the market by.
To me, that's manipulation. If you think otherwise, then that's your opinion. But a "fair" and "free" market should have no place for such institutions to move ENTIRE MARKETS by 5% one way or another at their leisure.
Again, that's what I call manipulation. I don't really see any other word for it.
-Tony
Quote from the Stock Traders Almanac for Tuesday, Aug. 22:
"Beware the "Summer Rally" Hype - Historically the weakest rally. (Page 70)"
"Market rally in every season of the year, but does so with more gusto in the winter, spring and fall than in the summer"
I've been looking at the $INDU chart, and see that its rebounded twice off the 10700 area support. Isn't this a double bottom?
Then there's a smaller support in July around 10860 and another in August around 11100. Right now it is at the upper Bollinger. Looking at this chart, it appears to me that we are due for a small pullback, maybe to 11200, before the next move upwards to 11400 and beyond.
i dont know how many folks use elliott wave theory - found it interesting to compare the DIA with the theory. Weekly seems to go along with the ABC pattern.
Especially, the pattern on this page under "Wave within wave"
http://www.acrotec.com/ewt.htm
and compare it with daily chart of DIA, SPY, QQQQ. seems to be out of textbook and poised to fall hard.
markets looking directionless...
Please continue to short GOOG, plenty of money to be made, my fellow bears.
As I see it, supply and demand moves the markets. The problem is now with the big houses on vacation supply is limited. The buying is equal to previous levels while the selling has slowed down. The houses have already been moving in their positions they will hold through year end. Based on the comment about the markets moving +-5% being manipulative; I wish they would tell me :) so i could take advantage of every move up or down!
Crosscurrents?
1) Thin August trading
2) Iran
3) The top ten ETFs ALL made volatility expansion patterns yesterday (narrowest range of seven days). This predicts volatility expansion but not direction. Which factor will dominate?
looks like the dow has maybe another 70-100 points upside to complete some unfinished business. Puts are at fire sale prices. Get 'em while you can!
Trader Fred
Just exited all longs and now short the DIA with october & december puts.
I got a sell signal.
The Trader II
Trader 2, could you please elaborate on your sell signal please? Im very intrested.
Short at well with stop at 11,400 folks.
Picture perfect gap fill from yesterday's gap down.
Market up
despite Iran crisis
despite Toll Brothers reduced outlook
despite all other economic problems
why does it remind me of someone living it up one last time before he dies?
excellent 2-way commentary here - keep it up guys.
I'm with the manipulation camp on this one - but what will be the driver/catalyst to bring the markets lower after this rally which i don't believe is over?
Anyone see any imminent news/economic data that could/will tilt the trend...
BullEater,
I can't exactly disclose the signal, but it is a combination of trendline and long & short-term term moving averages.
The Trader II
Good Luck
Stop is at 11,400.
Feelings dont mean anything, but it really feels like MM have been shorting this whole time, and are keeping prices up in this low volume enviornment to position themselves.
But the reality of the situation is that we are in BULL MODE, and the markets are very strong. Bad news has been priced in and now we are set for another new leg up. The signs are all over folks (or should I say bears), here are the reasons
Transportation is still seriously underperforming
Small and mid caps are underperforming still, Large caps are still outperforming small caps and mid caps and at a rate we havent seen in years
Volume patterns including OBV have been the worst now during this price action than the last 3 years.
Market internals are significatnly different and weaker now than during prior corrections/pullbacks in the last three years
Most NASDAQ stock are under their 200 DMA, and about 50% are under their 50 DMA.
New highs are languishing.
As of right now I believe we will head higher from here due to factors. Seriously bears, you cant believe for one minute that when underlying market strength and internals dont confirm the recent up move in the major indexes that there are serious problems. I just listed some major factors that show the amount of strength in the underlying markets.
To the Moon
:)
Jason,
I disagree, we should at least test 1280 soon and then you can decide if we go to the moon or not.
The Trader II
lol it was just sarcasm
anonymous - I find your unwillingness to share your information surprising and somewhat appalling.
You spend time on a FREE chatroom where Tim and others give away an enormous amount of strategy and stock picks but you feel as though sharing your own insights somehow diminishes your profitability.
I have news for you, noone (likely) on this page has the ability to affect the market... We could all be trading the exact same strategy everyday from now until eternity and still not get picked up on the radar.
I would argue that your stingyness is shortsighted and not in the spirit of this forum. There is plenty of money out there, why not help each other make a little?
If by chance you're saying you don't have a clear definition of your exit signal and therefor can't disclose, I apologize for the rant! But the comments should, nonetheless serve as a reminder to any of us who are feeling possesive of our knowledge.
What do you guys think of CMED?
My take? Bearish.
Reason? Failed ascending triangle pattern. Broke support (8/7/06 low) today. Below 25 moving average. Selling on massive volume. OBV tanking. Potential MACD bearish crossover. Broke support on up day. Does this sound good or am I just too bearish?
BTW Im just a begginer! Please do ur own DD. Would appreciate experienced traders input.
Sanjay,
what are you shorting today?
-Jay Mac
despite the bull/bear arguments, I absolutely love the markets right now. And I'll tell you why:
They are starting to get back into their predictable trend ranges, again. Equilibrium is beginning to get restored. Think about it, if things reverse, and a new cycle begins, we have all these headaches of figuring where support/resistances are, price movements, etc.
But right now, things are going back towards old resistances/supports, and its just become so nice.
Who wants to do all that work, when playing golf in the summer seems so much better (and just letting the markets run its course, in a predictable/boring manner), eh?
Anyone with me?
Anyone?
Of course not - we want revenge, dammit!
make sure you keep your eye on
CL
I had mentioned that before, just waiting for a nice break below its 58 support. Already made a lower high.
Looks like a beauty.
hey bulleater:
I checked out CMED. I would be very cautious on it. A pretty decent support at around 20.61, and obviously 18.73
It made a higher high, and looks like a new bull cycle could be starting up.
Unless you are a day trader (which I am not, and thus my analysis is made more for the weekly trades), and you want to get the 2 bucks or so before it hits 20.61, then yeah, it may look nice for a play. (good volume on the downspin, and nice candlesticks to support the bearish case)
depends how your play is
CORRECTION, I see a support at the top of the gap at around 21.52, on CMED.
Trader 2 has a system! -- Let's get him!!!
Folks,
Sorry, for not being able to disclose these indicators. It is not mind. I picked these up from a close friends who's also been trading for numerous years. Sorry again.
The reason why i make post here is to help some of the more inexperience traders here. I once went thru the same growing pains as some of you are experiencing now.
The Trader II
Nasdaqstox...
"Tim - I have a prophet java chart up on MSFT - Line, 5yr, Daily - I drew the same trendline as you have - but I have a crossover of the trendline which would indicate a bullish move - what service are you using from prophet and why the discrepency - any help would be appreciated.
1:40 PM "
=========================
Tim is using a log chart. Not appropriate, IMO, when drawing lines. He did the same thing with the Naz chart a couple of days ago, showing index below resistance. A linear chart showed it had passed the line and already starting to consolidate above.
Bad data alert:
$SOX...almost every candle since July 24 is wrong. August 7 missing entirely (to see how wrong, put up 3 month StockCharts, BigCharts, etc. beside Prophet $SOX. Emailed them over the W/E, again today.(Note that the SMH chart is fine.)
$VIX...June 8 values wrong.
$VXN...June 29 (big spike)wrong, according to CBOE data (Yahoo is wrong also).
ZZZZZZZZZZZ.
Like paint drying. Got stopped out of my QCOM/SNDK short positions for small losses, then they dropped. My stops were tighter than normal but after last week's goofy action why take big chances/losses?
IBD was all charged up last week and happy about yesterday's pullback on light volume. I can't get excited about going long or short now although I'm net short from late last week.
Feels like everyone left for the Hamptons already or never came back.
Post a Comment