Showing posts with label iyr. Show all posts

Tuesday, June 12, 2007

...And an Awful Lot Like Me.....

First off, if you didn't get around to reading yesterday's post, you should. It rules.

The trend change that I have been hoping, praying, and wishing for might (I say MIGHT) be here. Whether it is or not, the past week or so has been very good to me. Successful trading comes with its own set of challenges, but I'm enjoying myself. Watching the Dow go from a 90 point deficit to a 20 point surplus today, I had the sense that it was time to get more puts. And that was the right move. Lower lows and lower highs seems to be the rule of the day.


The "culprit" of all this wonderfulness is soaring interest rates. One reader (who shall remain nameless but I shall refer to as SuperCOT COTLover) opined that interest rates aren't going to go up forever. Well, ummm, that's right. But they weren't going to go down forever either. Believe me, there's plenty more that can go wrong to help add fuel to this wonderful fire.


Someone else asked to see my positions. Anyone blinkered enough to spend time every day sharing his best charts and thoughts for no money is stupid enough to show all his positions too, so here goes (the bold items are puts; everything else is a short):


Remember that channel I mentioned yesterday for the Russell 2000? Well, it was cracked today. Good.


And the S&P 500, which had been floating above its channel for a while now, has now achieved - if you will - double penetration. The index is within the bounds of its channel once more. Which only means it is at the very highest reaches of its channel, with ample more room to fall.


And, not surprisingly, the $VIX has been zooming higher lately. Even at these levels, we are far, far below historical averages. During saner times, the $VIX would occasionally push above 50.


ALB, which I've been short for a while, has now completed its pattern. Huzzah!


Oh, remember back on May 22nd that I suggested BTJ as a short? I've marked it with an arrow here. How's that for a call, folks? I (stupidly) closed it out a couple of days ago for a nice profit, but, again, it was just stupid. There was no solid reason to cover the position.


CAM is another one dozens of great short/put candidates.


And the DIA is a great general way to play the market downturn via puts. This is a gorgeous chart. Stop price of 134.76 on this one, if memory serves.


My puts on GOOG are doing well. This is a failed breakout pattern. For such an expensive stock, there is nothing sweeter.


I'm avoiding real estate shorts, pretty much (I've got one or two). Looking at IYR, it is approaching a supporting trendline. Of course, if you read about the billions upon billions of dollars in mortgages that are about to explode, it could be that the real estate downfall has only just started trickling in.


My JCP puts are doing well, although his pattern is not complete yet. But it has a very good shot of doing so.


Check out Sears Holding (SHLD). It has crossed its 20, 50, and 200 day moving averages! Now the fun can really begin.


And for all those who used me as a contrary indicator........keep holding those positions, boys. I'm sure you're right and they'll be back in the black in no time. In fact, double up. You know I'm wrong.

XTC........

Thursday, February 15, 2007

Seven Nation Army

I'm gonna fight 'em all
A seven nation army couldn't hold me back
They're gonna rip it off
Taking their time right behind my back


Another day, another lifetime high on the Dow. C'est la vie.

I mentioned BHI as a short a few days ago , and it got walloped. Even put options that are several months out doubled in value today. Oil in general (be it OIH or a component) is pretty attractive to my bearish eyes right now.


I'm pretty proud of this graph, so click it to see a big version. It's a minute bar of the NZD/USD forex trade I've been suggesting. The symmetry between the phases I've shown here is really intriguing to me. I've numbered it for clarity. I've been trading it both up and down (long and short) during the most recent cycle. I imagine we're about ready to head back into a long tumble now. This is a really fun currency to trade, in spite of the wide pip spread.


The Russell 2000 remains my favorite index on which to own puts right now. Put values have been getting creamed lately by (a) rapidly rising index values and (b) withering volatility premiums. A one-two punch. Call me crazy, but I am loading up on them at these levels.


Allstate (ALL) has a dainty head and shoulders pattern that I think is worth trading, since it seems to have fully retraced.


BBD has a clean relationship with its Fib retracement.


This is a bigger graph than I normally show - ten years - and it's of Goldman Sachs (GS). I still love this short.


HES is another fresh one I'd suggest you check out.


I've still got my IYR puts. They're under water, but just take a gander and how lofty this sucker is.


My MTH short is still solid. I am once again showing a bigger graph so you can understand how far this thing could fall.


OXY is another oil short worth examination.


PCU isn't as clear-cut, but it's at the top of a channel, and I'm going to nibble some puts on this one tomorrow.

Thursday, February 08, 2007

Double Top

In honor of the late Anna Nicole Smith, we will direct our attention to another artificially-inflated bubble without much intellect behind it which no one thinks will die so young: the U.S. stock market.

The $VIX is forming a pretty decent inverted head and shoulders pattern. I've drawn the neckline here. Clearly it would be beneficial for the bears for the $VIX to push its way above this neckline, thus completing the pattern.


The S&P 500 remains beneath its broken trendline. The huge divergence between the price action and the indicator is quite intact, with today finally registering a small downturn in the market after several days of doing basically nothing.


Much the same can be said of the Dow 30.


John Deere (DE) is at the top of a sharping ascending channel.


And Cummins (CMI), mentioned here recently, has put in a possible double top.


I put Boston Properties here (BXP) not to suggest it, but merely to marvel. It's incredible - simply incredible. Much came be same for any of the components of the Real Estate group (wasn't there supposed to be a deflating bubble? Guess that's just residential....)


Bear Stearns (BSC) is finally losing a bit of its steam.


Aetna is obeying its Fibonacci retracement very nicely.


Reynolds Aluminum (RAI), also mentioned here recently, is dipping.


MTW seems to be in a series of lower highs and lower lows - often the makings of a good short position.


MTH looks like it has fully retraced to the neckline of its head and shoulder pattern.


And the same can be said of MDC.


The DJ Real Estate (IYR) equity is breathtakingly high - - which just goes to show stocks sometimes have no trouble defying their resistance lines!

Thursday, October 26, 2006

Cut and Paste

I'm starting to think I should just cut and paste a generic blog entry each day: "The economy is on a precipice. The housing market is failing. Stocks are insanely overvalued. And a new high was reached today." It would save me plenty of time and effort.

Today it was reported that houses suffered the biggest year-over-year fall in over three decades. My local market (the crazy SF Bay Area) is looking like this lately:


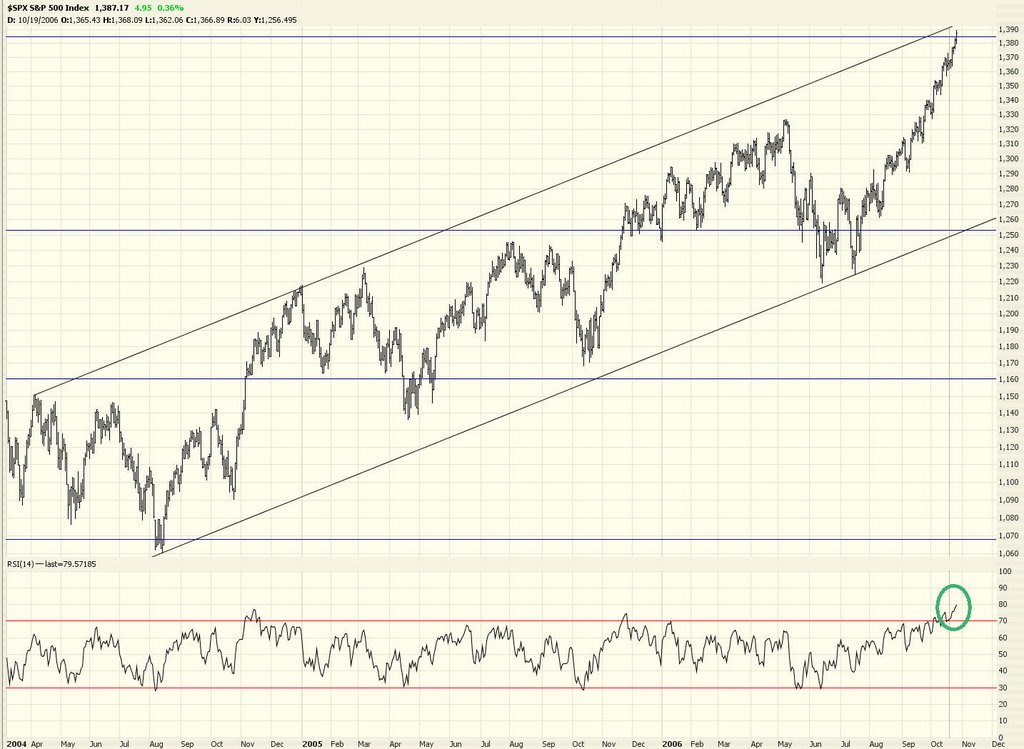
So how did the market react to the news that the principal asset of every American is collapsing in value? It spiked to a new high! Of course! Here's the S&P 500 with the RSI indicator. The index is at the top of a channel and the RSI is in nosebleed territory.


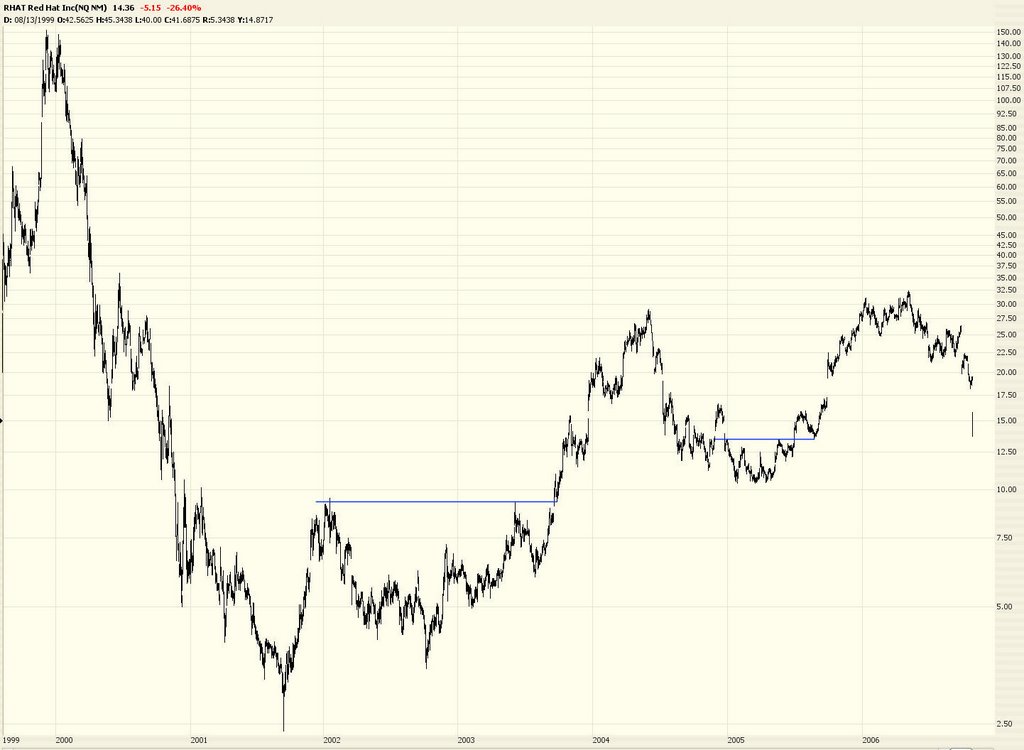
I have no position in Red Hat, but this is an amazing stock. Below is the entire history. You can see broad trends of higher highs/higher lows and lower highs/lower lows over the course of its history. I guess the news that Oracle is going to provide support to Red Hat users at a deep discount tossed a nuclear missile at this stock (which had amazingly high volume - something like over 80 million shares).


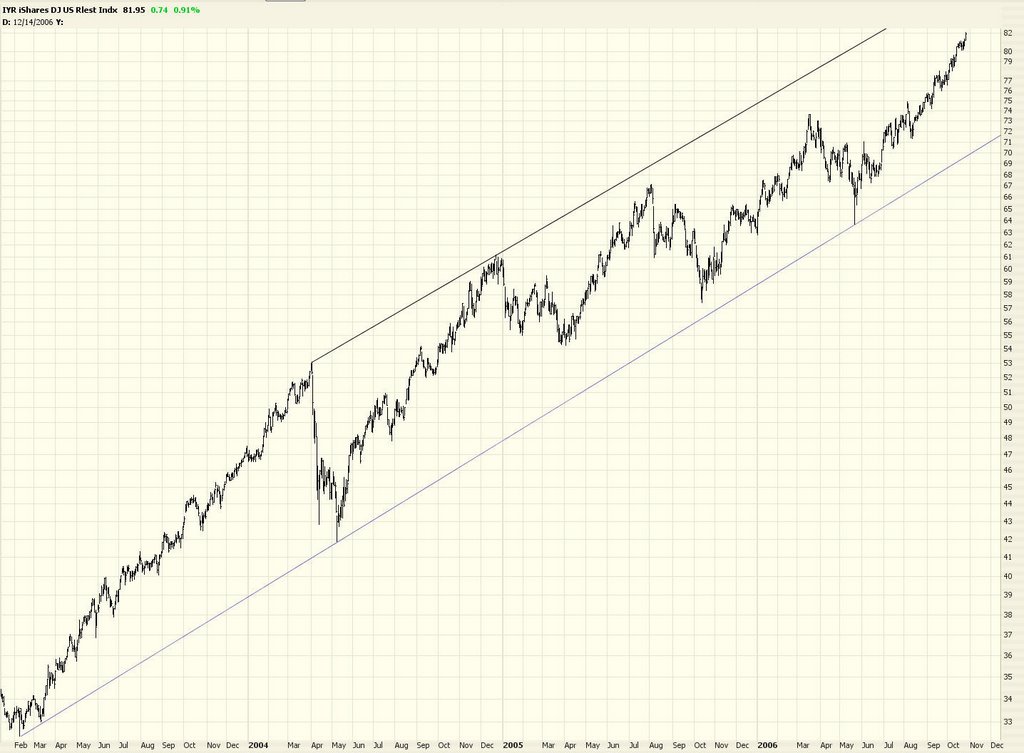
Now here's a chart I simply cannot figure out. It's symbol IYR, which is an ETF for real estate in the U.S. This chart just goes up and up and up. Even on a day like today. Clearly this has nothing to do with domestic housing (I suppose). I would think that the shrinking of the housing bubble would be causing damage here. Not in this market.......

Perversely, in this bearish blog, my "long" suggestions are doing great. Once again, the hotties are Redback Networks (RBAK):


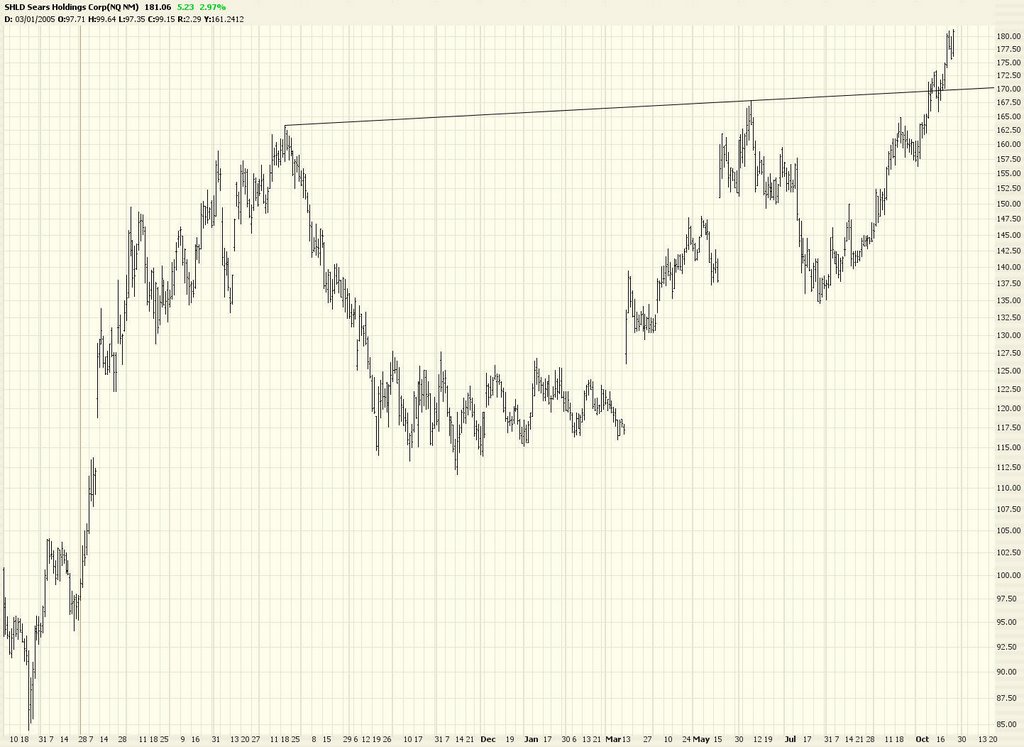
Sears Holding (SHLD):


and Immucor (BLUD):


I am having absolutely no fun in this market at all. You can tell by my posts. I hate not understanding a market, and I absolutely do not understand this one. Not a great thing for me to say in my own blog, but that's the truth.

Thursday, October 19, 2006

Party Hats

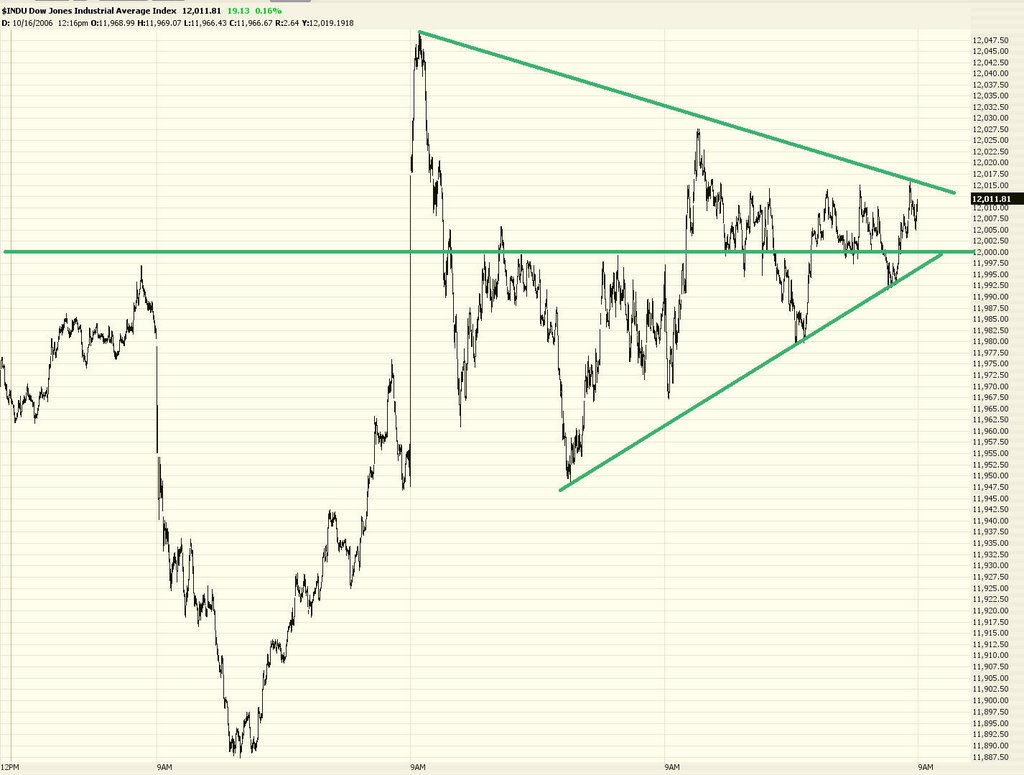
Well, 12k on the Dow has not only been pierced but "closed". For the first time in history, the DJIA closed safely above the 12,000 level. If you don't think there was a battle for this, just look at the intraday graph. Traders were shoving each other back and forth over this line the past couple of days.


I took a snapshot of this chart today and was going to post a "looks like a buy!" (really! honest!). Anyway, Google (GOOG) posted their results about three seconds after the market closed today, and they were fantastic. After-hours trading has the stock trading about 30 points higher than the close. Let's face it, Google is a money machine.


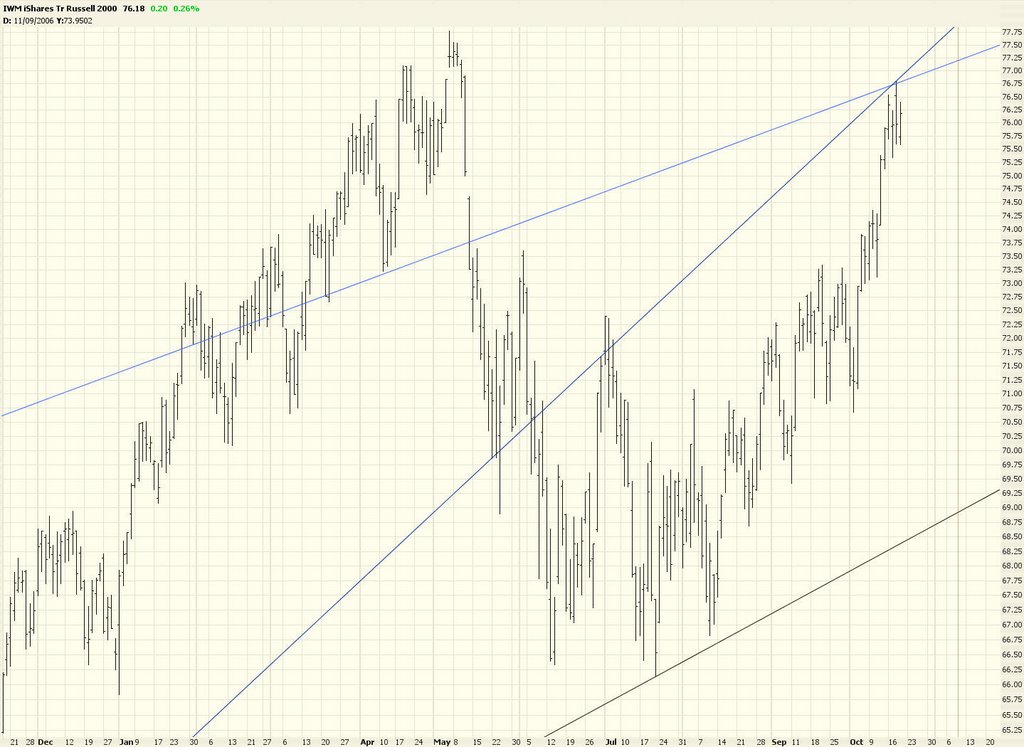
The Russell 2000, as represented by the ETF IWM below, is truly at a crossroads. Just look at those lines converging.


One of the four rules I have written on my laptop is "Never do an ad-hoc close." What I mean by this is that, once in a position with a stop in place, I don't change my mind about it later out of boredom or doubt. The position stays.

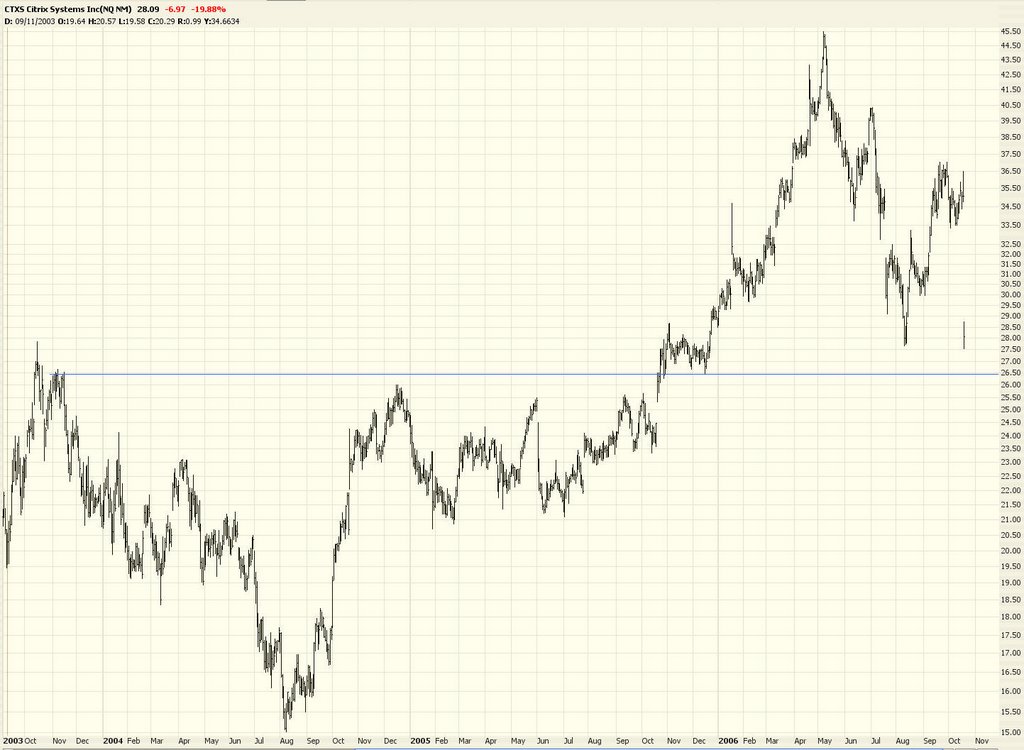
This rule came in handy with CTXS. I had bought puts on it, but the graph was looking sort of hum-drum. I wasn't sure it wouldn't pop up in price. But I stuck to my rule and let the stop order do its work. CTXS got nuked today, and I got out of the position with a profit. (My stop was never triggered, obviously). So let your stops do their job. Don't monkey around with the position once it's in place.


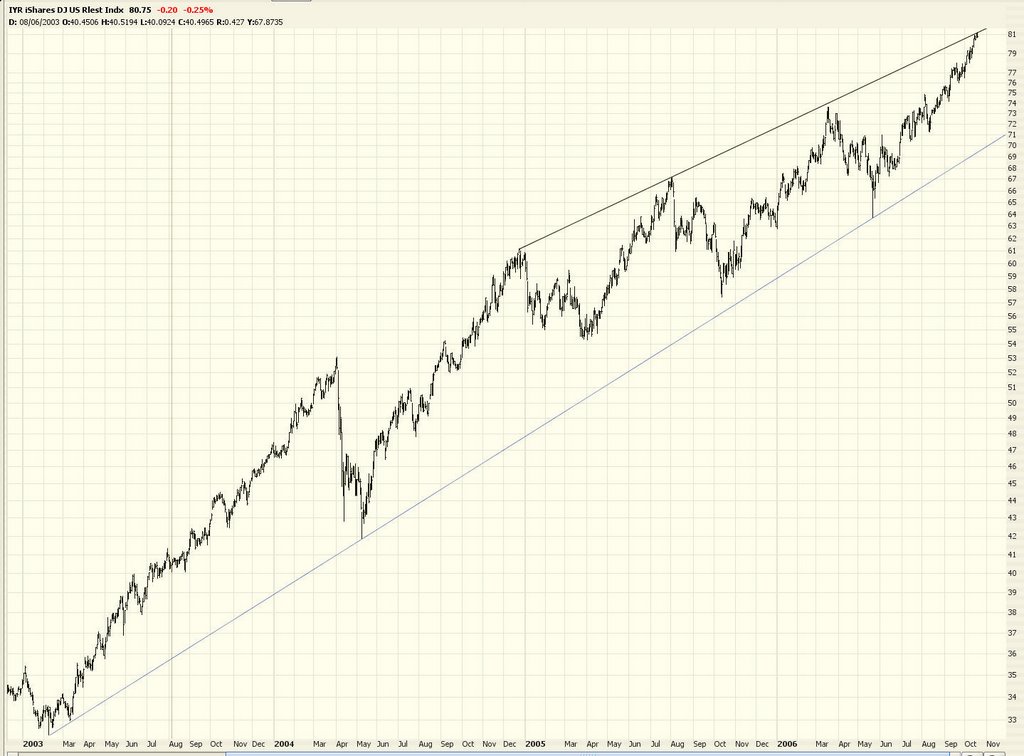
I mentioned this one before, but for those interested in shorting the world of real estate/REITs, try symbol IYR. There are puts on it (although fairly thinly traded), and this looks like a good long-term short play.


That's it for today.