Showing posts with label hes. Show all posts

Friday, July 20, 2007

Home In the Range

What a week! And a great week it was.

For those of you insane enough to have owned July puts on Google until today, congratulations. The slight earnings disappointment from GOOG nicked $40 off their stock price at one point, and naturally the options were going insane.


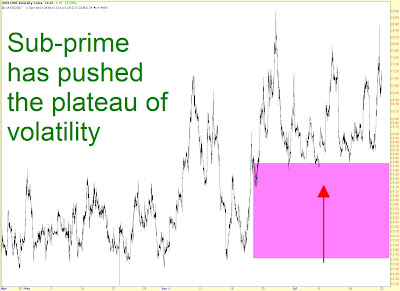
The sea-change that has taken place is that all the sub-prime woes have elevated the volatility in this market. It's very plain to see from the $VIX graph below.


But this market right now is all about one thing - range, range, range. As David Byrne once sang: "I go up and down/I like this/curious feeling." If you are able to pay close enough attention to it, and you've got your groove on, you can make a lot of money.

But a glance at the Dow graph below shows that the price is currently about in the middle of a very sweeping range. And now we're in no man's land. Do we bounce off the horizontal line and fly well above 14,000? Do we push our way through the muck beneath that line and start and honest-to-goodness bear market? Or do we continue to fart around ad nauseum. I dunno. And you don't either.


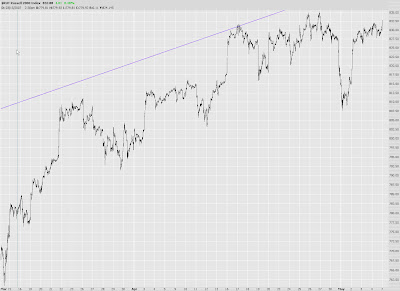
The Russell is even more "range-y". Hell, I was in and out of calls AND puts all day long on this, and nary lost a cent in the process. It was quite a ride. But I'm about as flat as Kate Moss right, since I'd rather enter Monday morning with a relatively clean slate. (e.g. mountains of cash).


One last intraday index to show you - the S&P 500. I'd say we are at an important "bounce or break" point here. It will take a lot of strength for either the bulls or the bears to reach escape velocity from the range shown here, but once either side wins, it's going to be dramatic.


The rest of the charts are just short/put ideas. I sold a lot of "I told ya so" graphcs today (e.g. items I had suggested which went very much as planned), but I don't want to waste your time with those. You know I've got good ideas from time to time, don't you? Once in a while?

Here's BP.


CAH looks ready to break its neckline.


Colgate (CL) might have finished a nice triple top here.


CVX also looks good.


I'm putting GOOG here not as a suggestion, but mainly to show how nicely it retraced its entire hard-fought gain in just a single day. Who knows - those who bought in the low 500s might be very happy in the long run. After all, it's still a nice bullish pattern. But today it was a better buy!


HES, like many oil-related stocks, looks great to short.


I suggested MLM a while back (howdy, Leisa!) It's doing well.


I made so much cash today I decided to risk a bit on a couple of RIMM puts. This sucker has to fall some day.


Here's a final thought for you. See ya Monday.

Friday, June 29, 2007

Are the Bulls Losing Their Grip?

Dedicated bulls should worry about this: the market is starting to make sense to me. Last week was a really good week. This week was a really good week.

Now, if we were at the tail end of a two-year long bear market, it would be easy to shrug this off. "Oh, yeah, Tim the permabear has been doing well because everything has been falling non-stop." But you know that's not the case. The Dow was at its highest level in human history earlier this month, and it still has over 98% of that value. So I've been able to score big profits trading virtually entirely bearish positions in a market which has been in anything but a free-fall.

So it's making sense. Leading up to this month, I was starting to lose my mind with how nonsensical, bizarre, and random the market seemed to be. It would be like living in a town where cars stop at green lights 80% of the time, pedestrians occasionally walked along the middle of the highway, and baby carriages were parked on the roofs of buildings. After a while, you start to lose your mind in that kind of environment and question your own sanity.

But the town I live in suddenly makes sense. People stop at red lights and go on green. Baby carriages are safe. And pedestrians remain on the sidewalks. And the market goes up when I think it's going to go up. And it goes down when I think it's going to go down. It's a nice change. Let's keep those buggies off the roofs for a while, shall we?

If you read my post from earlier today, you know I spent a little time this morning at the Palo Alto Apple store watching the crowds line up for the JesusPhone iPhone. If you didn't see the post earlier, check it out. It's got a cool little video I made.


I'm trading the Russell 2000 options actively, both intraday and on swing trades. A tight stop on the IWM ETF is at 84.19 right now, which was the high for both Thursday and Friday.


There's really no good instrument for trading the MidCap 400 ($MID), but it's a fascinating graph to me. The markets seem to be revving up to be in swoon mode.


I haven't traded the NASDAQ (either index or hardly any stocks) for a while. It's been relatively defiant of the recent weakness in the market. But I have a feeling this group is going to start joining the downdraft party.


Side note, now that I mention NASDAQ - congratulations to RIMM owners, particularly call owners. I see some of the calls were up literally quadruple-digit percent levels today!)

Oil services are looking terrific for shorts/puts. HES is particularly well-formed and liquid.


McKesson (MCK) is another beautiful stock. One of the best examples of exploiting Fibonacci fans that I've ever seen.


RadioShack (RSH) has been on an enormous upswing of late. (Rumor has it that AJC has joined the Battery Club multiple times to keep her bedside electronic accouterments fully-powered, thus the earnings spike). But - - just like JC Penney is JC Penney - - Radio Shack is Radio Shack. And that's all you need to know. I've got puts.


Next week should be relatively quiet with a big fat holiday right in the middle of it. Have a safe one (most of you, at least), and I'll see you on Monday.

Late breaking news!
I was there for the Big Event (the 6:00 opening of the doors at the Apple store). It was a madhouse. Police, news crews, and hundreds of people (half of which were taking pictures).


You know the funny part? People waiting three days to be near the front of the line. And one hour later....one hour......I was able to just walk right in through the front door without a wait. Great use of three days (and nights), fellers. Anyway, here are my two iPhones perched on the kitchen bar:

Friday, May 04, 2007

Sigh....

OK, this up-every-day thing is getting realllllllly old.

I'm started to become disenchanted with the Russell 2000. I wasn't surprised at the recent recovery. In fact, I sold a huge block of puts just before the bounce higher started (thank God).


What bugs me is that the bounce-back pushed higher than the point I thought things would soften up again. The entire area I've shaded in green here (a closer view) is basically the "WTF???" zone. Particularly the strong finish during the last few minutes of today. Disgusting.


The $XAU is sporting a handsome shooting star, and although I've had no position in this for a while, I picked up some puts on it today. Because of the behavior of the market these days, I've focused on deep in-the-money, far-out expiration puts. Low risk, low volatility (and consequently lower profits should a miracle occur and things actually start heading down one day).


I mentioned CRDN yesterday as a possible long. The awaited breakout took place today, although on unspectacular volume.


ONT, mentioned many times here as a long, had a terrific day. The volume in the past few weeks is sensational.


Akamai (AKAM) might be pushing back to a neckline, but this isn't a perfect head and shoulder, so no position yet. The right shoulder is higher than the left, and I tend to be a purist about these things.


Jones Soda (JSDA) got whacked today. Even so, it has a nice little head and shoulders pattern, and this could have another $8 to $10 to drop (based on classic measurement techniques).


The balance of today's offerings are basically "rollovers." That is, stocks I think have lost momentum and have a good chance of falling. They are......Caterpillar (CAT):


Hess (HES):


Noble Energy (NBL):


Potash (POT):


PSB:


I've had enough. Time to hang up the charts for the weekend.

Saturday, April 14, 2007

I, For One, Welcome Our New Bull Overlords.....

Thanks for coming back this weekend (or Monday......) to see my post. I had to do some thinking, charting, and scanning to reassess the market.

Oh, before I begin, a shameless plug: for those who have been holding off buying Chart Your Way to Profits, check out the reviews of my book. You'll be able to get some third-party opinions from those who have actually read it. The one negative review was from someone who didn't realize the book was largely about ProphetCharts and JavaCharts. So, consider yourself warned.

I really tried to look at the whole market with a very open mind, because the strength of the bulls since July has been frustrating, confusing, and vexxing. I keep coming back to the graph below, which shows the S&P 500 over the long haul. I simply cannot see that we are set up for a bullish surge. I don't want to hear about liquidity, the global economy, or the trillion dollar oil surplus seeking a home. This blog is about charts, and the charts, to me, don't say "buy."


Looking at a short-term S&P chart, we can see that we're getting dangerously close to the high set back in February. It isn't the all-time high (set early in 2000), but it's getting close to that as well. The big question now is, does the market (a) sink from here (b) push up to a double top and then sink (c) blow past the February high and make an assault on the all-time high from the bubble.


To me, an important indicator to watch is the NZD/USD market. The New Zealand kiwi has been extraordinarily strong. The weakness in late February was a good early indicator of the tumble the markets took. But, since then, this currency has basically been going straight up.


Another item I watch is China - one shorthand way to do it is via GCH (Greater China Fund). One interesting tidbit is that it seems to have retraced up to a retracement level. We'll see if it backs away or not.


I wanted to show a few examples of why it's careful not to fall in love with a particular point of view. In particular, why it's important not to anticipate pattern completion.

Technical analysis is a helpful tool - especially in markets that are friendly toward one's general investment disposition. For instance, if the market were, by and large, weak, the short ideas I've suggested over the past months would have been quite successful. But the fact is that we're swimming against the tide, and that makes it very, very hard.

And I'm not saying the market would have to be in some horrendous free fall. But if things were easing down, week to week, and month to month, that's where using T.A. to smoke out good short opportunities is invaluable.

But when you're swimming against the tide, you have to be extra vigilant. Take BP, for instance, shown below. I mentioned this as a potential short. It had a beautiful topping pattern. It broke below its neckline. And it started falling.

But what happened next? It got strength. It went above the same neckline. Thus, the pattern was rendered moot. And then it soared! Being able to escape the "jaws of death" like this is a real sign of strength that must be feared by bears.


Here's a similar situation with FTO. A gorgeous head and shoulders in the making. But the pattern did not complete! You can see what happened next. That's why scoring a little more profit by seeing a completed pattern in your mind's eye is seldom worth it.


For our next example, here's HES. I've often pointed out how, once a trendline is broken, the price obediently stays beneath it, and maybe "kiss the underside" of the trendline. That's all well and good, but it doesn't mean a collapse is at hand. A price can stay beneath its trendline for a very long time and still make tons of money for the bulls.


My general feeling toward the index is simply that I don't know what the hell is going on. A terrible confession, eh? But these markets are bewildering these days. You're going to hear the same story from me - - we're pushing toward either a double top or to new highs. We're awfully close to one or the other.


$NDX is a skosh weaker. It could back off from the horizontal line I've drawn. Or not.


I was blown out of my precious $RUT puts. But that's what stops are for, right? I don't like the look of this index nearly as much as I used to.


Some indices - such as the $XMI, shown below - have wasted no time in going to new lifetime highs. Disturbing. The bulls are in their ninth month of totally owning this market.


Most of the strength these days is in really "old school" stuff. I'm talking about Steel.....Uranium......Copper........and, for God's sake, Railroads! This is no "new economy" play here. It's 19th/20th century stuff. Here's uranium company CCJ, for instance:


Goldman Sachs gave me at least a little relief. Even on a strong up day, it was weak.


Tech giant IBM, on which I also own puts, also was surprisingly weak.


I'm looking at MLM for a new short position.


I've been short MSTR for a couple of weeks, based on the failed breakout you see highlighted here. So far, so good.


MWP is in a tight range. It's going to break one way or the other soon. I have no position at this time on this one.


Someone mentioned last week the stock ONT. I felt strongly bullish on it based on the breakout and volume strength. It has moved up handsomely since then and looks better than ever.


SCHN (Schnitzer Steel - try saying that five times fast) has a hugely bullish pattern too.


SWN, mentioned here bullishly before, looks even better.


If you think oil stocks are going to weaken, XOM is a pretty-good looking short/put candidate.


As you can see from today's posting, it's more of a bullish/bearish mix. My frothing-at-the-mouth bearishness has become really attenuated by the market's action recently. It's disappointing. I shall continue to watch, wait, and hope.