Showing posts with label rbak. Show all posts

Wednesday, December 20, 2006

Baby Got Redback

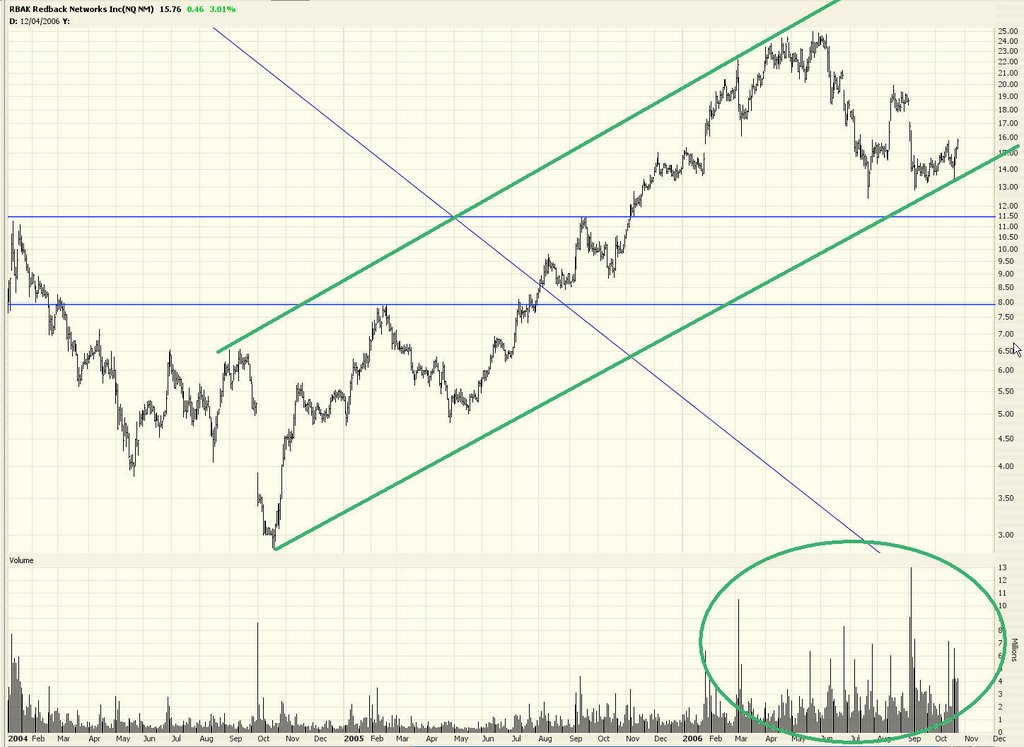
As regular readers know, although I'm a bear (in both real life and my Second Life), I do publish bullish charts some of the time (maybe 10%). One stock I've consistently point out as having a handsomely bullish pattern is RBAK, which I first mentioned over a year ago in my September 2005 post. At the time, RBAK was about $9 per share. It was purchased today for $25 per share, and the stock price actually closed north of that.

The calls I bought on RBAK a month or so ago more than tripled in price over a small amount of time. Now this is a beautiful example of an inverted head and shoulders pattern in action!


What's funny to me is some highly-paid analyst published a report in the wee hours of this morning stating, in brief, (1) RBAK had reached its target price, so they were downgrading it (2) a buyout was not likely "in the near future" (which, given the outcome, I guess meant within the next 30 minutes following the publication of the report).. Wow, what an embarassment. Analysts have never been worth a sack of crap, have they?


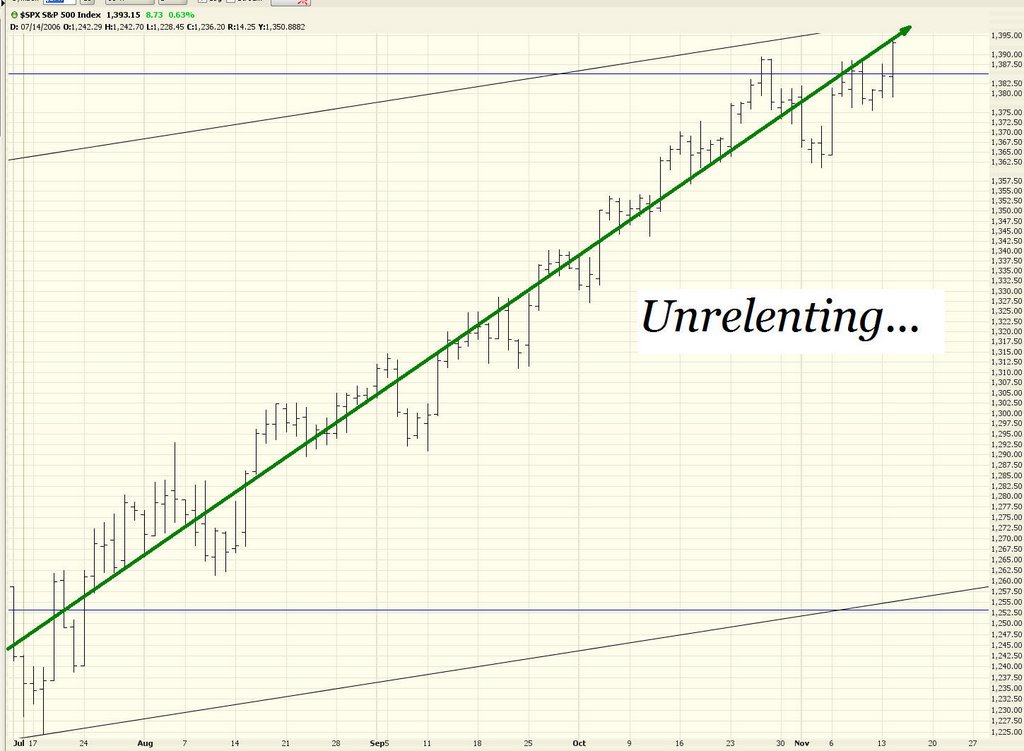
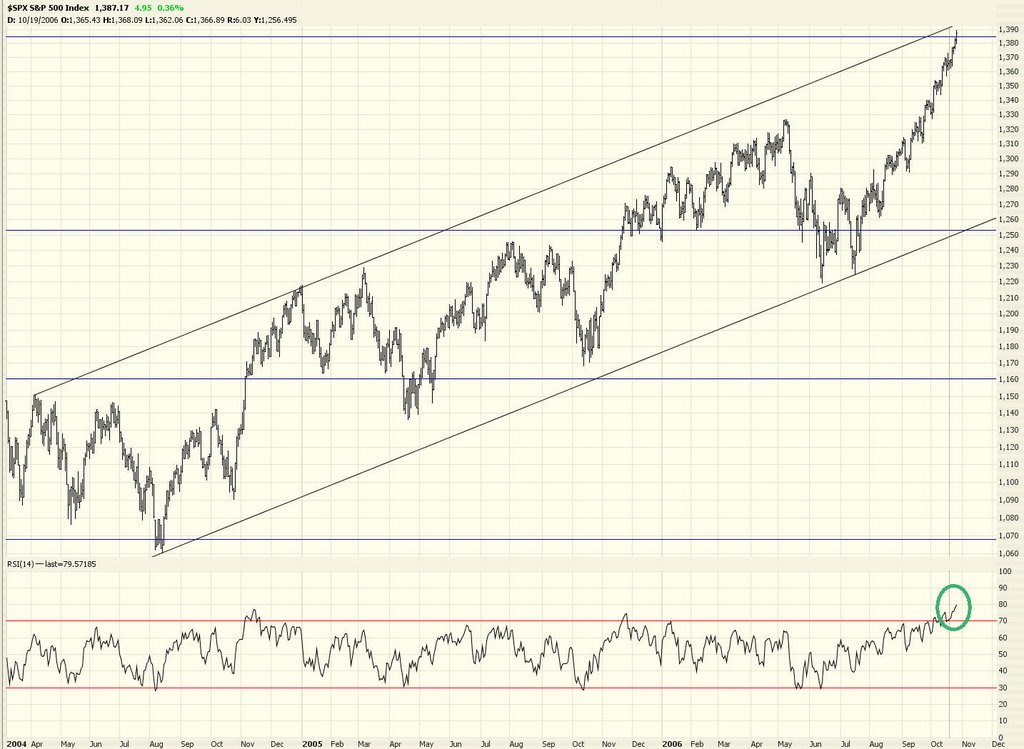
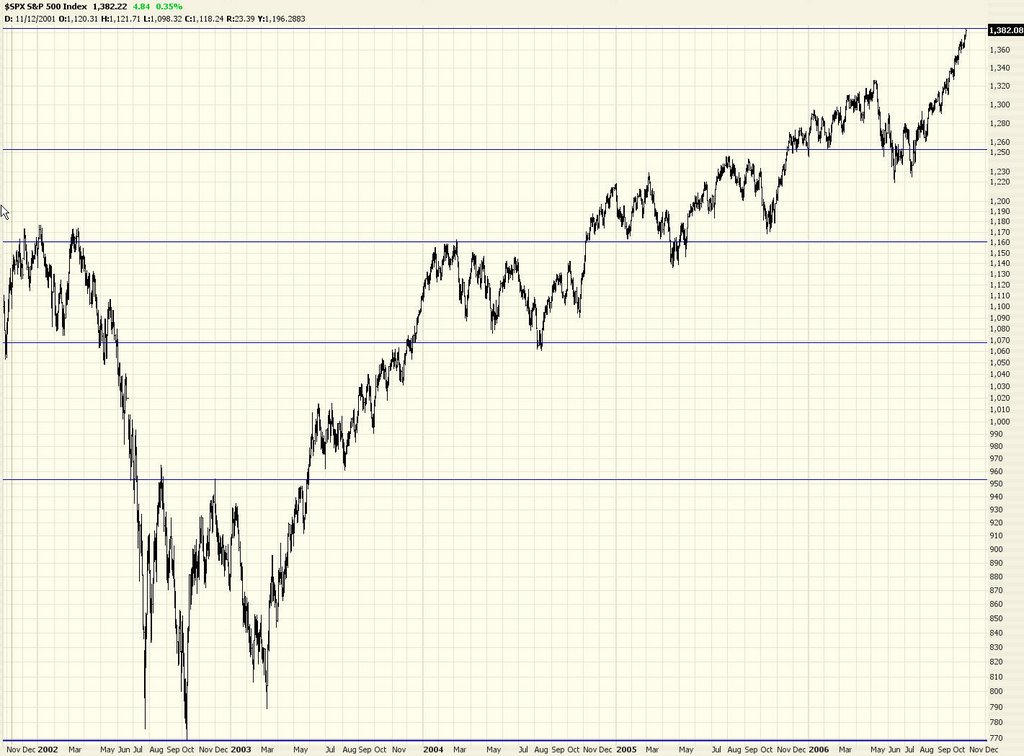
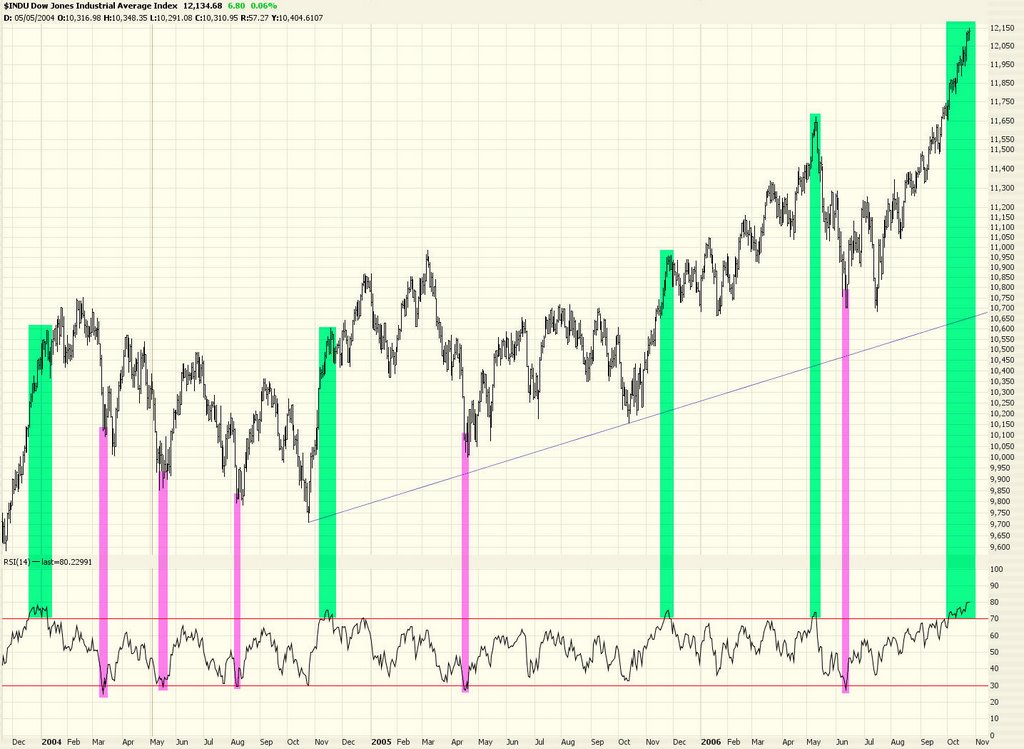
The $INDU reached yet another all-time intraday high today (turd monkeys!) but closed down a bit. The divergence between the RSI and the price action is absolutely huge. Come ON, you stupid market, would you fall already? Jesus H. Christ!


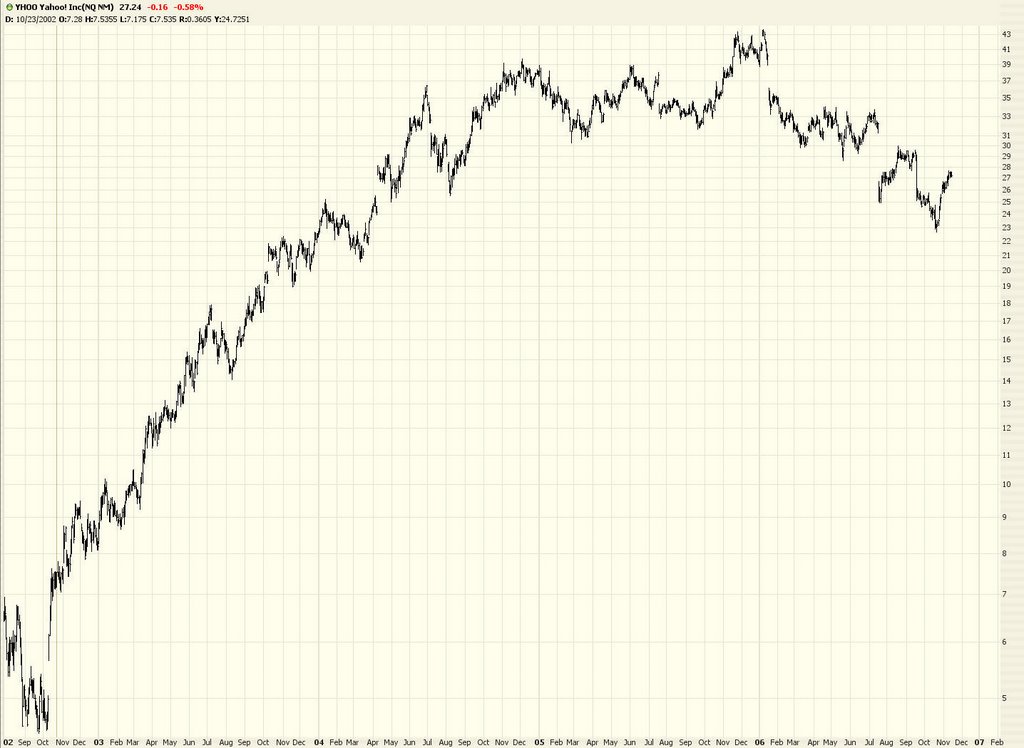
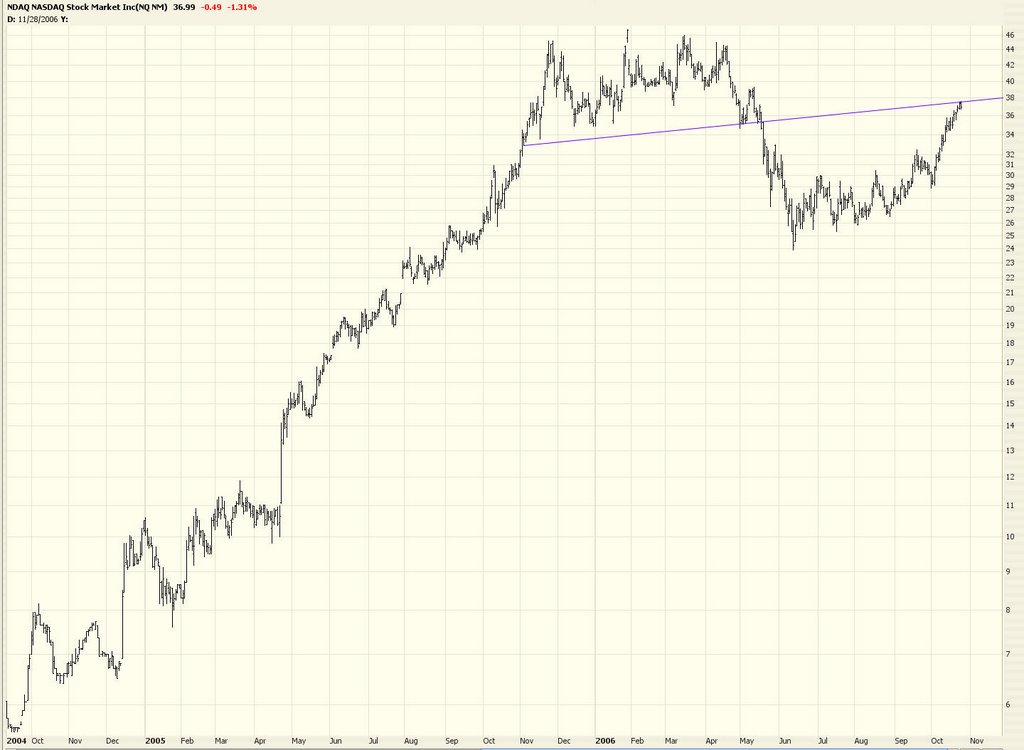
The NASDAQ continues to look weaker than the U.S. stock market as a whole.


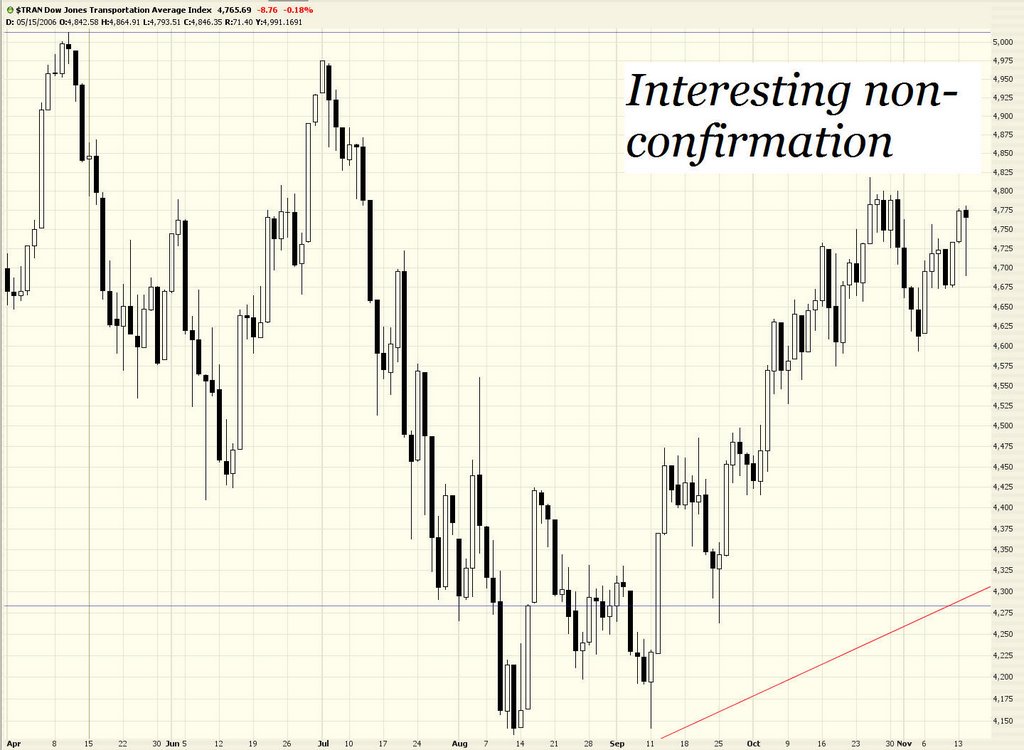
...and the Dow Transports continue to act (alone) in a truly bearish fashion.


CDX, a short I've suggested before, had a nice down day - - I suppose led by FedEx's action.


And speaking of FedEx, another item I've suggested shorting, it had a nice down day, although it certainly was no demolition of the stock. These things can take time, I suppose.


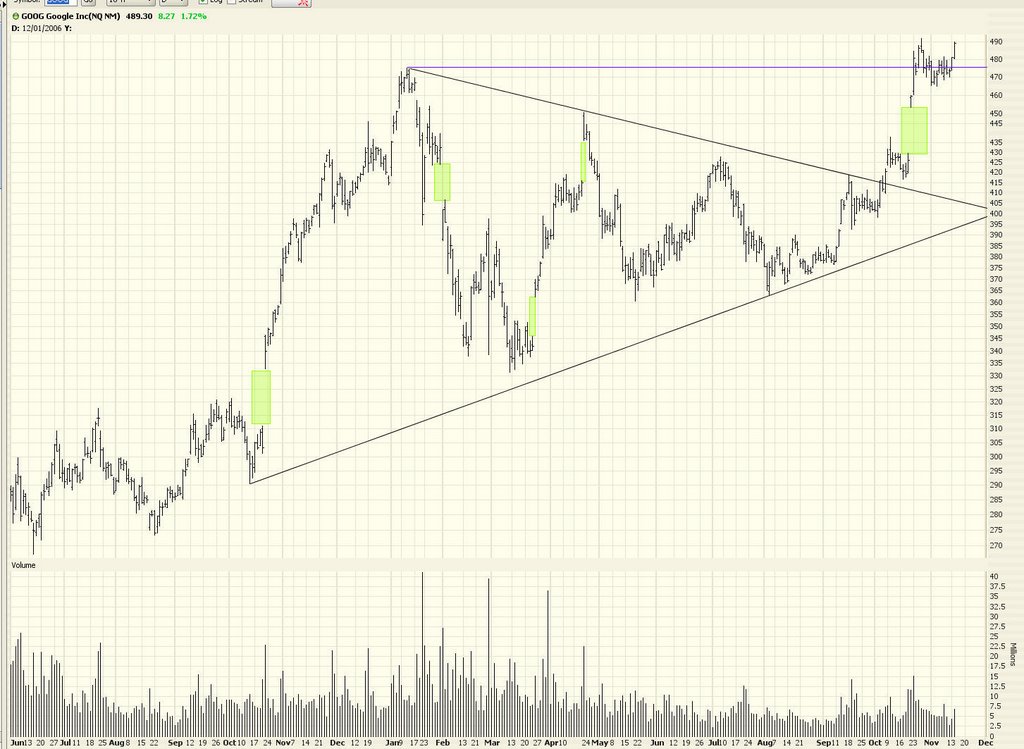
One could make a flimsy argument that GOOG is sporting a petite head and shoulders pattern. I wouldn't even mention it. Oops, too late. Anyway, I have high (low) hopes for GOOG in January.


Finally, TSO continues to be well behaved. This looks like a nice, fat toppy pattern to me.


Someone commented (and let me say, I really appreciate the comments section - - I read it religiously) that yesterday's graph of the coming disaster in Medicare has nothing to do with stocks or the financial markets. I dunno, I think the insolvency of the United States will surely be germane at some point.

Oh, I forgot. Liquidity. There's liquidity. And all that money needs a place to go. (Where it came from, no one knows - - actually they do - - leverage, leverage, leverage. Which, oh, is a two-edged sword). Anyway, liquidity is the current This Time It's Different argument. Just like how the Internet's productivity enhancement changed everything and justified the valuations of 1999.

People just never learn. Never. I simply cannot wait for those Liquidity twits to get blown to hell. Then at least we can wait a few years before we have to endure them again with another fabricated story.

Thursday, December 07, 2006

Making It Up to My Readers

Well, I'm going to make up for the lack of a decent post yesterday (although it certainly didn't seem to diminish the activity of the comments section). This is going to be a big 'un.

A couple of weeks ago I mentioned the disparity of wealth distribution in both the U.S. and the world in general. An interesting study came out about this in the past few days which illustrates that the top 1% of wealth holders control 40% of the world's wealth, and the top 2% control 50%. How about the bottom half? They have about 1%. That's right......50% of the world has 1% of the wealth, and 1% of the world has 40% of the wealth. Pretty skewed, eh? Here's the link.

Another interesting item I read in yesterday's New York Times was how bullish newsletter writers have become. The graph in the article shows, on the left side, the U.S. stock markets, and on the right side, the bullishness of the writers. They seem like virtually identical graphs. Make you wonder how much value these guys add. Anyway, again, here's the link.

Today was a nice (although modest) down day. Take a look at the Russell 2000, shown below (and, as always, clickable to be larger), which I've embellished a bit with some studies for those folks finding my graphs too plain. Examine the "waves" of the past, and notice how far the moving averages were at the peaks of those waves. Looking at the most recent data, the averages have never been farther apart.


The same can be said of the S&P 500. Just look how rapidly the index has ascended and how much distance is spread out among the averages. At the same time, look at the continuous softening of the RSI. Quite a divergence, wouldn't you agree?


The $VIX has finally gotten some legs. It seems to be pushing way higher, as the market seems to be not-quite-so-sure about the certainty of indexes rising every day of the year. And this is all in the context of the Dow 30 hitting a lifetime intraday high today!


Now, some specific stocks - most bearish, a few bullish. I've been terribly impressed with Akamai's (AKAM) strength. It seems to be defying any weakness right now. This is one of those stocks which, in 2002, you might have felt was doomed to bankruptcy. But it's been a barnstormer.


I must again offer Capital One Financial (COF) as a short suggestion. My puts on this are doing well, and I just really like the look of this chart.


My small bearish position on GOOG is doing OK as well. I do not normally watch CNBC, but at the airport yesterday I saw they were doing a featured story called something like "Can Anyone Stop Google?" That's my feeling exactly. People seem to think Google is perfect and unstoppable. A good time to fade the market's disposition. Can you imagine the collapse when they make their first earnings stumble? Whether it happens next quarter or in 2025, it will happen. And great will be the fall of it.


Being short investment banks has been tough lately, but maybe we've finally turned the corner. These banks got great news yesterday in the form of a very favorable court ruling, which stated that class action lawsuits against these banks were not permitted. I'm sure the 50 Goldman Sachs personnel getting at least $25 million each for their Christmas bonus (you read that right...) are having the time of their lives. But take a look at the graph below. How's that for a monstrous bearish engulfing pattern?


HYDL looks ripe for a short as well, with a nice, tight stop.


I've had puts on LEH for a few days (someone commented how I got whacked on it; I have no idea what they are talking about; I did not get stopped out). The way it's playing inside these Fib Fans is cool, and it seems to be losing its grip at this level.


Here's a longer view on LEH to bring more clarity to my explanation.


NVR has had a good run-up of late, and a look at the Fibonacci retracement levels gives good reason to short here, with a very tight stop.


I suggested Redback (RBAK) back on October 4 when it was about $14. It pushed to about $17.50 today on strong volume. This stock looks more bullish than ever.


I put puts on RIMM a few days ago for the worst of reasons - "it just seems really high." Luck has smiled on me so far and it seems to be tumbling more than a skosh.


I remain long puts on SHLD.


Apparently all eyes are on tomorrow morning's employment report, released an hour before the opening bell. It's one of those funny ones where if employment is strong, the market supposedly will take that badly, whereas if employment is weak, the market will respond well since rates are more likely to drop. Ya know, folks, interest rates are not the entirety of the economy! Take a look at Japan during most of the 1990's which was completely buried in recession and had negative interest rates. There's only so much good they can do.

Tuesday, November 14, 2006

Burying the Bear

See this towel? It's 100% cotton. And I just threw it in.

There's only so long we can pound sand, folks. Ever since July, the market has gone straight up. Iraq doesn't matter. The swing to the left in the political scene doesn't matter. The doomsday economic scenarios don't matter. There are way more buyers than sellers, and that's all the market needs to keep making new highs.

I had suggested recently that we probably should go back into our caves until the second half of January, at least. It seems that's probably the case.

I feel a personal commitment to doing a blog entry here each day. I must say, right now it's probably about as fun as someone doing a blog about the wonderful prospects of the Republican party. It's kind of a drag.

All the same, let's take a look. The NASDAQ Composite pushed higher today, and from a Fib retracement level, it's got plenty of upside left.


The NASDAQ 100 is just as disturbing. Just look at how much open air there is between where we are at and where we could go.


A closer look at the markets - this one is the S&P 500 - shows that you could basically put a ruler on your screen and plot the market from July 16 to the present. It's basically an unforgiving push higher.


The only bit of weakness today in the stock indices was the Dow Transports. It continues to not confirm the Dow Industrials strength. I'm sure there are some that could make an argument that Dow Theory is best left in the dustbin of history. I have no opinion.


Homebuilders were strong today, recovering from the collapse that everyone knows about. Here's BZH.


GOOG looks very strong. It has logged a new lifetime high, and this is a very nice looking pattern.


Redback (RBAK), which I've named here several times, continues to perform well.


If you're still looking for something to short, you might consider Yahoo (YHOO). This is a long series of lower lows and lower highs, and let's face it, Google has totally trashed these guys. Amazing that the Google guys wanted to sell out for a couple of million bucks to Yahoo early on. At this point, GOOG's market cap is $150 billion, compared to $37 billion for YHOO.

Thursday, October 26, 2006

Cut and Paste

I'm starting to think I should just cut and paste a generic blog entry each day: "The economy is on a precipice. The housing market is failing. Stocks are insanely overvalued. And a new high was reached today." It would save me plenty of time and effort.

Today it was reported that houses suffered the biggest year-over-year fall in over three decades. My local market (the crazy SF Bay Area) is looking like this lately:


So how did the market react to the news that the principal asset of every American is collapsing in value? It spiked to a new high! Of course! Here's the S&P 500 with the RSI indicator. The index is at the top of a channel and the RSI is in nosebleed territory.


I have no position in Red Hat, but this is an amazing stock. Below is the entire history. You can see broad trends of higher highs/higher lows and lower highs/lower lows over the course of its history. I guess the news that Oracle is going to provide support to Red Hat users at a deep discount tossed a nuclear missile at this stock (which had amazingly high volume - something like over 80 million shares).


Now here's a chart I simply cannot figure out. It's symbol IYR, which is an ETF for real estate in the U.S. This chart just goes up and up and up. Even on a day like today. Clearly this has nothing to do with domestic housing (I suppose). I would think that the shrinking of the housing bubble would be causing damage here. Not in this market.......


Perversely, in this bearish blog, my "long" suggestions are doing great. Once again, the hotties are Redback Networks (RBAK):


Sears Holding (SHLD):


and Immucor (BLUD):


I am having absolutely no fun in this market at all. You can tell by my posts. I hate not understanding a market, and I absolutely do not understand this one. Not a great thing for me to say in my own blog, but that's the truth.

Wednesday, October 25, 2006

Perpetual Motion Machine

I won't bore you. Same old story. New high. Relentless bulls. Bears being turned into hamburger. Not good.

I noticed early on Wednesday that the S&P was approaching its 78.6% Fibonacci retracement (as measured from the peak in January 2000 to the trough in October 2002). It doesn't necessarily represent a brick wall. There have been times that the index has blasted right through it. However, there does tend to be some gravitational pull near these retracement levels. Examine how it's behaved in the past.


Some readers have noticed how ungodly high the RSI has become on the market. They're right. Take a look at the Dow 30 over the past few years. I've highlighted in green the places where the RSI has gone over 70 (it's in the unprecedented 80+ vicinity right now). I've highlighted in pink the places where it's gone below 30. Interesting just how long we've been above the 70 level this time.


Here's a long (yep, long) idea to consider - AEE.


Another short idea - Nasdaq (NDAQ).


I also like BXP as a short.


As well as CBE.


I've mentioned Redback (RBAK) as a good long position. Just look at the swelling of volume. Very impressive.


Don't underestimate how far a stock can fall once it starts falling. Take Getty Images (GYI) for instance. Sometimes stocks can receive blow after blow. Although not shown here, the graph for ESRX will show something similar.

Friday, October 20, 2006

What a Week

This was quite a week. 12,000 pierced. A close above 12,000. It even managed to end the week above 12,000 (by 77/100ths of a point. Blowout earnings from GOOG. And a tidal wave of earnings reports, few of them shockingly bad.

If there's an opposite of fear and panic, we have it right now. The VIX pushed even below the trendline I drew for it a while back. These are epic low levels of complacency in the market.


Someone asked yesterday in the comments section about where I place stops. It depends on the chart. There's no set percentage or anything. That would be arbitrary. Take LLL, for instance, which I own puts on right now. I have an order to sell the puts at the market price if the underlying stock goes above 80. It's not based on a formula. It's based on the chart, and every chart is different.


I'm still 99% short right now (with a fair bit of cash on the sidelines), but here's a couple of long ideas for you. There's Redback Networks (RBAK):


As well as Sears (SHLD), which I've bashed for the longest time, but I cannot help but admire its gorgeous pattern. This has got to be the most perfect cup-with-handle pattern I've ever seen. It's beyond me why everyone on the planet would suddenly start buying their leisure suits and knit pants at Sears, but the chart doesn't lie.


I haven't indiscretely shown my positions in a while, so they are below (those that will fit on the screen, anyway; I ran out of room). As always, click on the picture (and any picture on this blog) to see a bigger version.


This market is in a "watched pot never boils" situation, and it's tiresome, I know. Some think we'll have to wait until after the elections are over. Some think we'll have to wait until January. And plenty of people think there's no such thing as a bear market anymore. Time will tell.