Showing posts with label ndaq. Show all posts

Monday, October 30, 2006

Tasty Shorts

The market didn't do too much of anything today. Oil (and therefore OIH) softened up a tad, which is consistent with my speculation that the energy market is going to resume its downward movement. Gold, in spite of the metal's rise in price, softened too on the $XAU. The Dow just lost a handful of points. At least we didn't have some big 'recovery' day after Friday's nice drop.

I just wanted to share a few charts on which I own puts right now. Here's AMG. This pattern is basically in a "post-broken trendline" situation, which is a favorite of mine. The general uptrend has been clearly broken, and the stock has recovered partly or fully to the underside of the trendline. These often represent low risk/high reward trades. Let's call this kind of pattern PBT for the sake of today's entry.


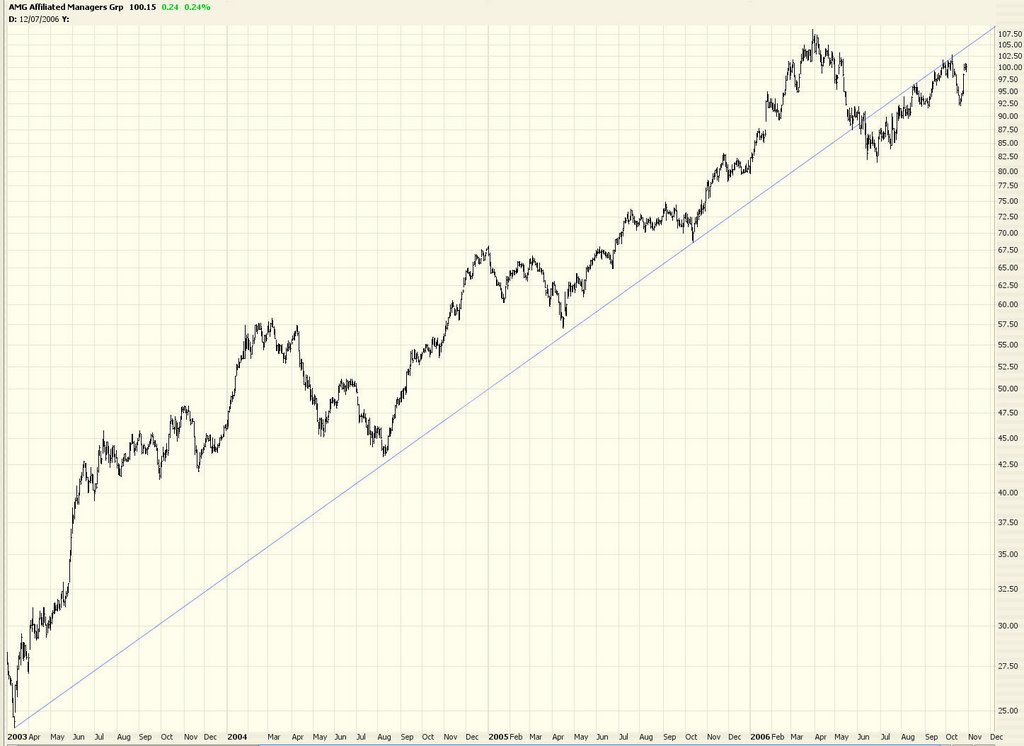
LEN is just a nice topping formation:
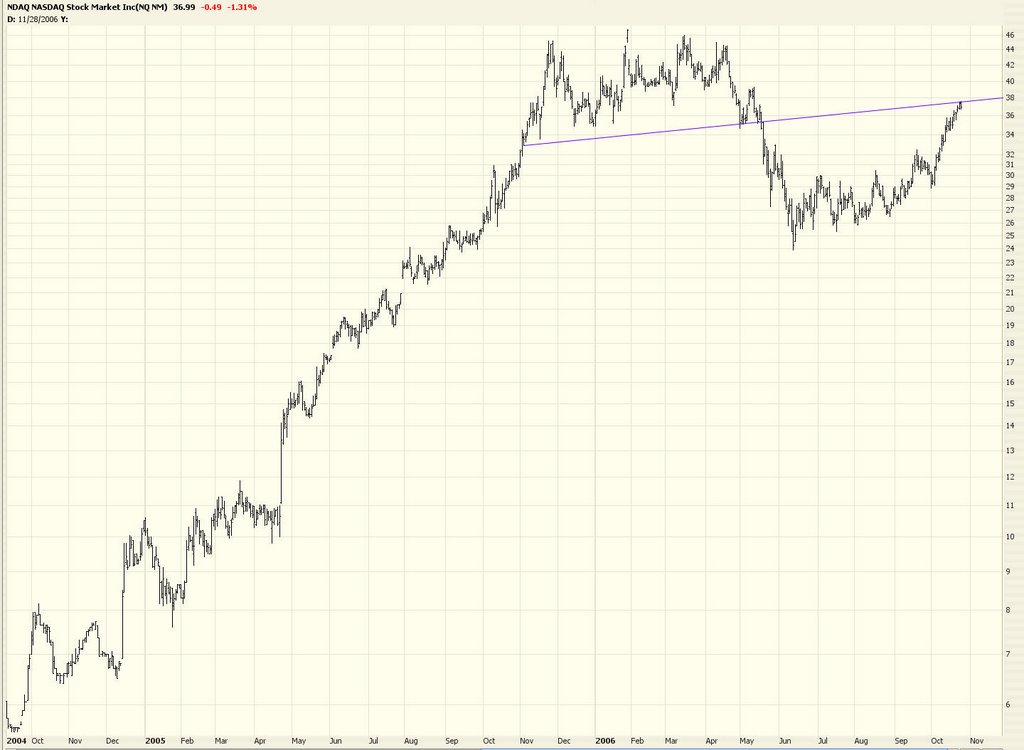

NDAQ looks pooped:


TXT is another "PBT":


I've mentioned MRO a few times already:


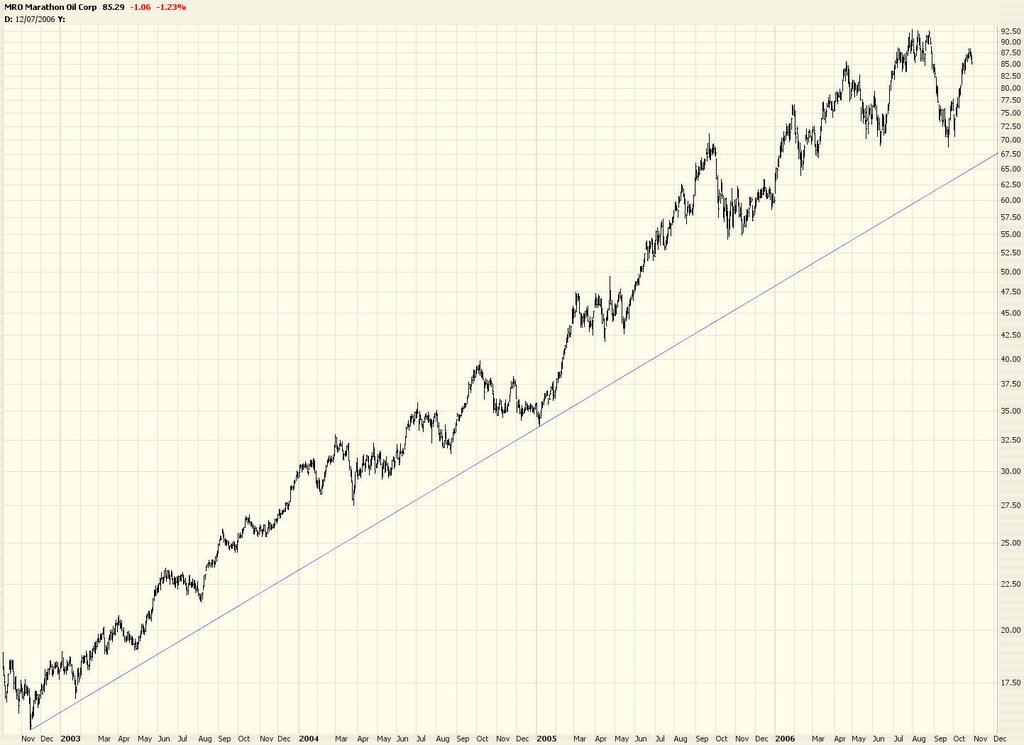
Altria (MO), yet another "PBT", which seems kind of common these days:


The VIX went up some time, which is also consistent with my view that we've bottomed out on volatility and complacency. The market misbehaved badly in September and October (typically bearish months, yet the market went up) so let's hope the typically bullish months of November and December likewise confuse everyone! We bears could use a break. A sustained break.

Wednesday, October 25, 2006

Perpetual Motion Machine

I won't bore you. Same old story. New high. Relentless bulls. Bears being turned into hamburger. Not good.

I noticed early on Wednesday that the S&P was approaching its 78.6% Fibonacci retracement (as measured from the peak in January 2000 to the trough in October 2002). It doesn't necessarily represent a brick wall. There have been times that the index has blasted right through it. However, there does tend to be some gravitational pull near these retracement levels. Examine how it's behaved in the past.


Some readers have noticed how ungodly high the RSI has become on the market. They're right. Take a look at the Dow 30 over the past few years. I've highlighted in green the places where the RSI has gone over 70 (it's in the unprecedented 80+ vicinity right now). I've highlighted in pink the places where it's gone below 30. Interesting just how long we've been above the 70 level this time.


Here's a long (yep, long) idea to consider - AEE.


Another short idea - Nasdaq (NDAQ).


I also like BXP as a short.


As well as CBE.


I've mentioned Redback (RBAK) as a good long position. Just look at the swelling of volume. Very impressive.


Don't underestimate how far a stock can fall once it starts falling. Take Getty Images (GYI) for instance. Sometimes stocks can receive blow after blow. Although not shown here, the graph for ESRX will show something similar.