Friday, December 30, 2005

The Decennial Pattern is Broken

The trading year of 2005 is over, and the bulls lost.

When entering this year, the bulls were counting on many winds blowing in their favor, not the least of which is the famed decennial pattern. For one hundred years, the bulls have had this at their side. Well, it didn't work this time. And I believe this represents the shape of things to come.

Below is a graph showing the percentage performance of the three major stock market indices this year. The Dow (which, importantly, had a loss for the year) is shown in black. The NASDAQ Composite is shown in blue, and the S&P 500 is shown in green. As you can see, even the strongest of these indices produced a return even more meager than what a risk-free CD at a bank would give you.


Regular readers of my blog know where I stand, so I won't belabor the point. I'm looking forward to 2006 as a year when the market really starts to fall to pieces. There will be tremendous trading opportunities all around.

I've enjoyed writing this throughout the year - - it seems like ages ago, but I only started in April - - and I'm looking forward to sharing my (sometimes overly opinionated) opinions with you in 2006. Happy New Year to one and all!

Thursday, December 29, 2005

The Moment of Truth

Well, folks, this is it. One day left. And, as of the close today, the Dow has a change on the year of ZERO. None. It borders on a statistical impossibility. After hundreds of days of wild market gyrations, the market has gone precisely nowhere.

So tomorrow, December 30, will represent the entirety of 2005's change for the Dow Jones Industrial Average. My fingers are crossed for a down day, but with no news at all on the horizon and a long weekend ahead, it's bound to be a quiet (OK, boring) session.

See you on the other side!

Tuesday, December 27, 2005

Rudolph's Light Goes Dim

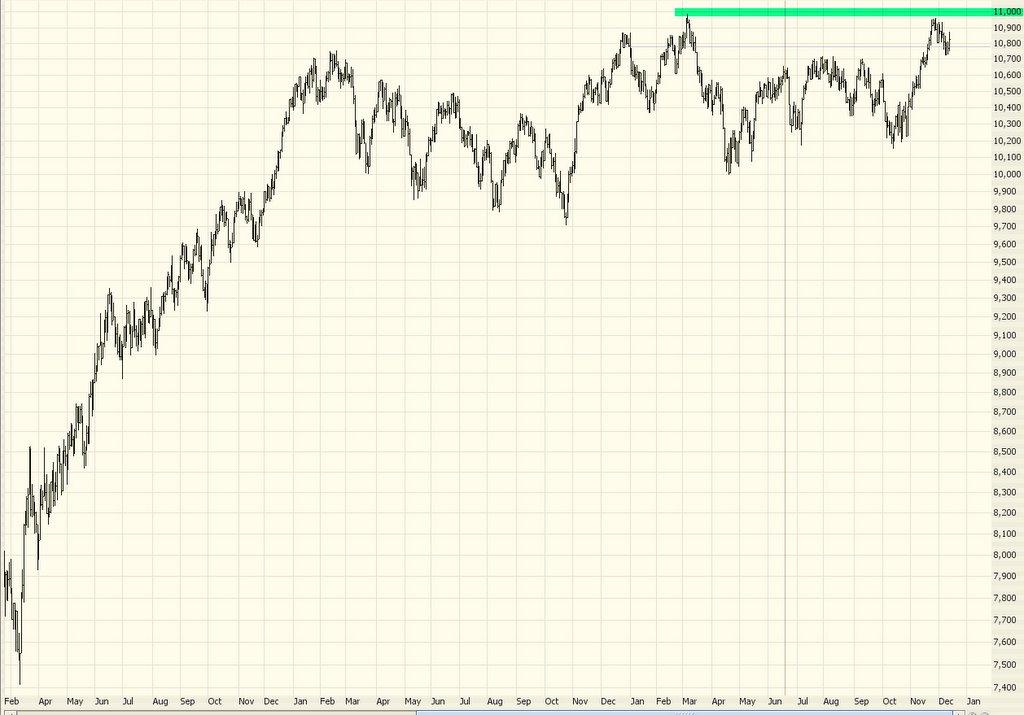
The first trading day after Christmas - Tuesday the 27th - was anticipated since people felt the Santa Claus rally would finally kick in, shoving the Dow cleanly over the 11,000 mark and giving 2006 a good rolicking start.

It looked that way at first. Early indications of holiday sales were quite strong, and the Dow swiftly moved up about 50 points. And then the same "rally....then fade" pattern took hold. After reversing 156 Dow points, the Dow finally closed with a triple digit loss. And it is once again in negative territory for the year 2005.

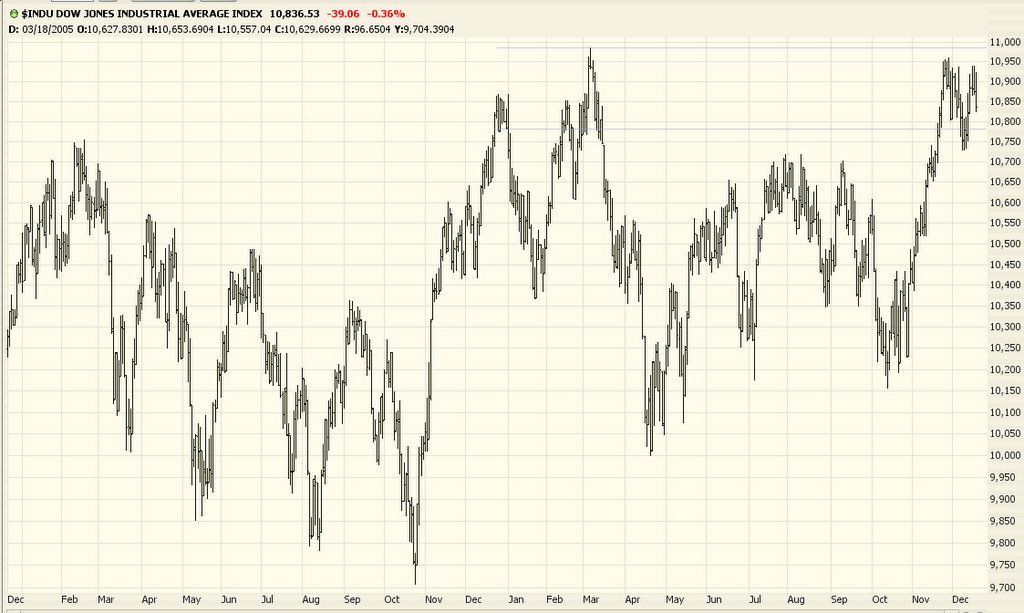
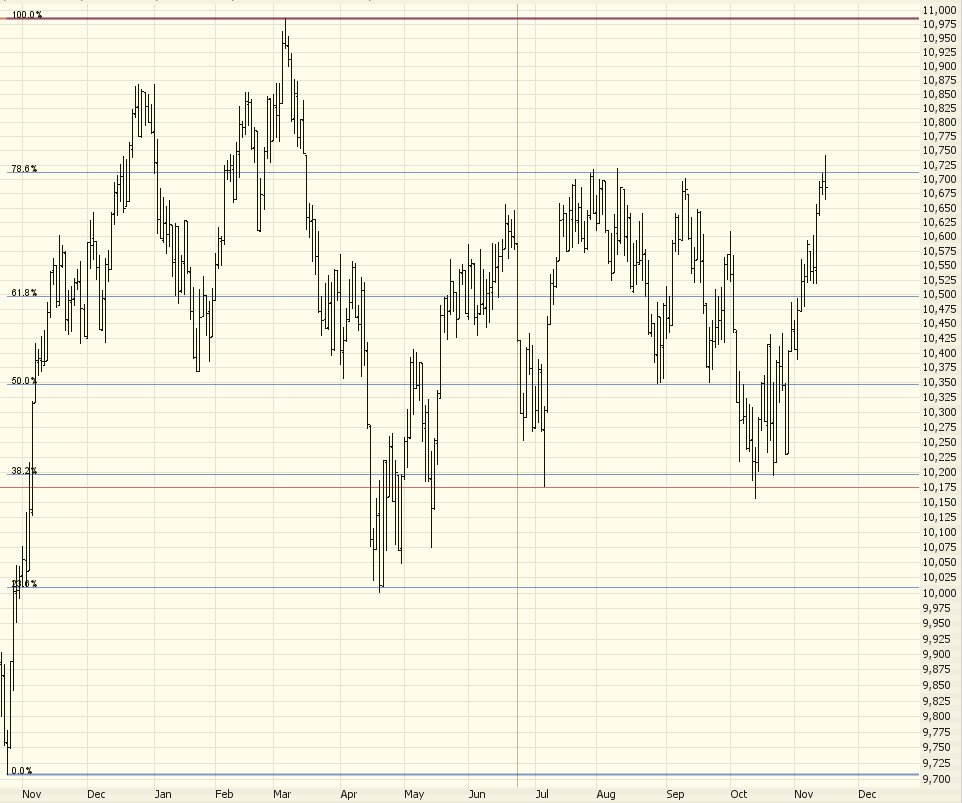
We have three days - 19.5 trading hours, to be precise - left in the year. As I've mentioned numerous times, closing below 10,783 on the Dow by year's end would break the never-before-broken Decennial pattern (for years ending with the digit five).

We are just a hair beneath 10,783 at this point, so it's way too soon to call. But I don't think I'm going out on a limb here by saying that - - after ten failed attempts to break 11,000 over the past month - - odds are that we're going to stay on this side of 11,000 and, at most, end the year with a gain so small on the Dow that it would hardly be worth measuring.

I've started to notice an interesting phenomenon lately, which is that many of the brightest shining stars have started to weaken considerably. Indeed, even when the Dow was up 50 points on Tuesday, one of the hottest performers of the year, NutriSystem (NTRI) was down a full 10% (which meant the puts I owned on it were up well in excess of that).

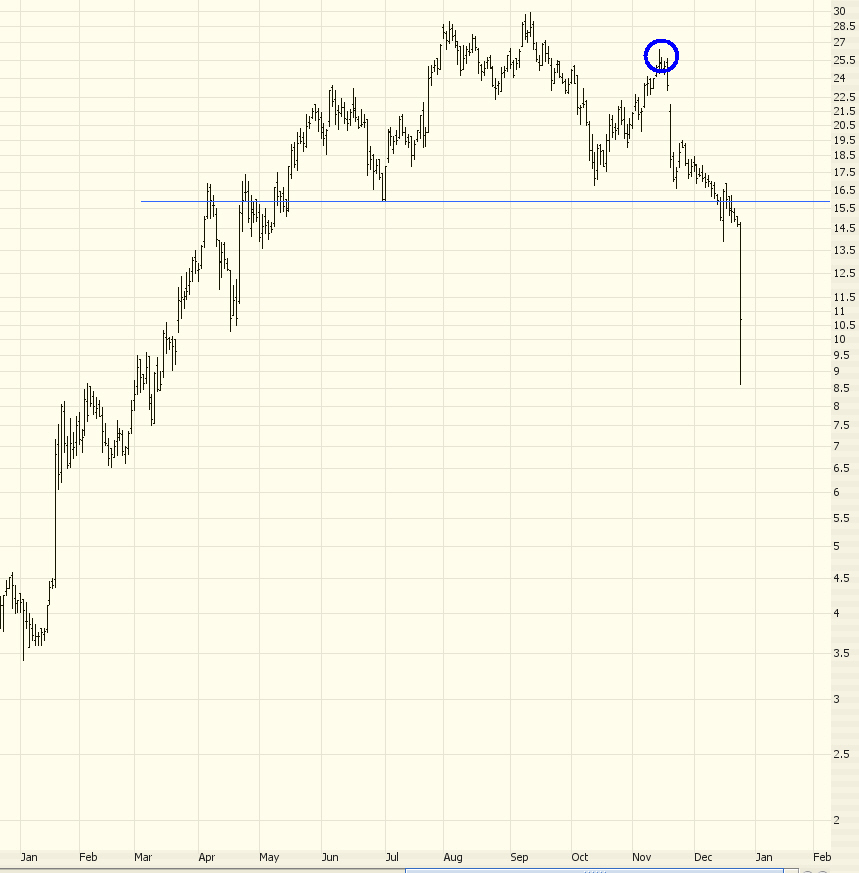
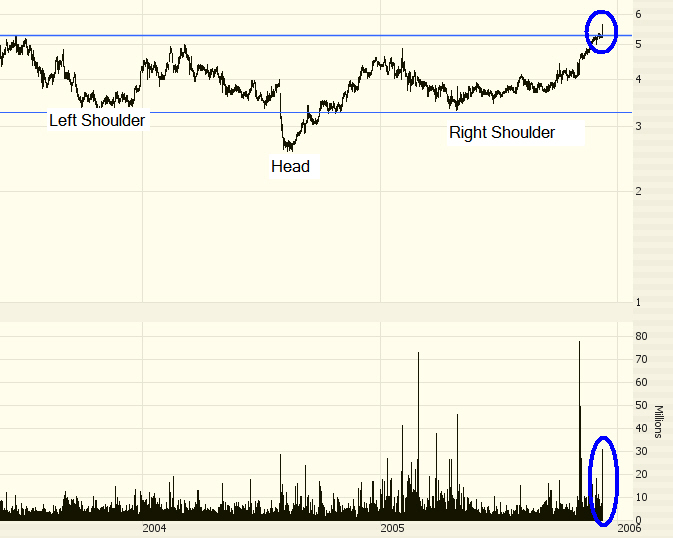
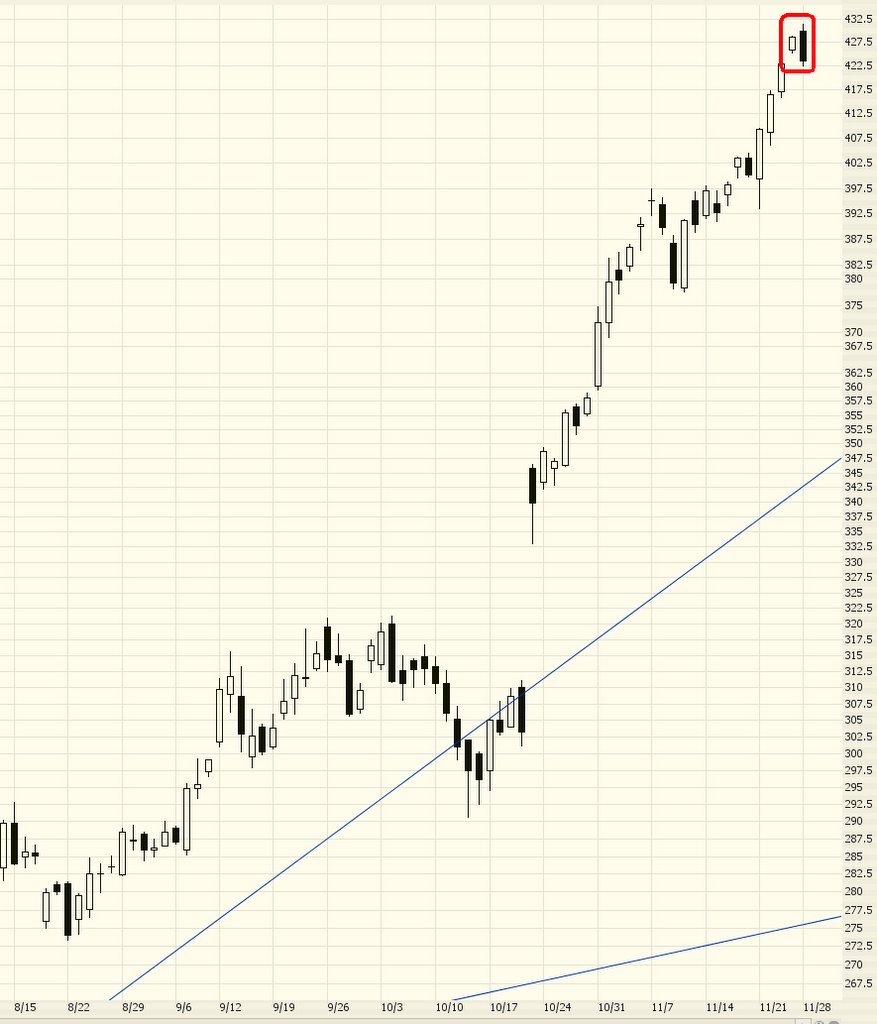
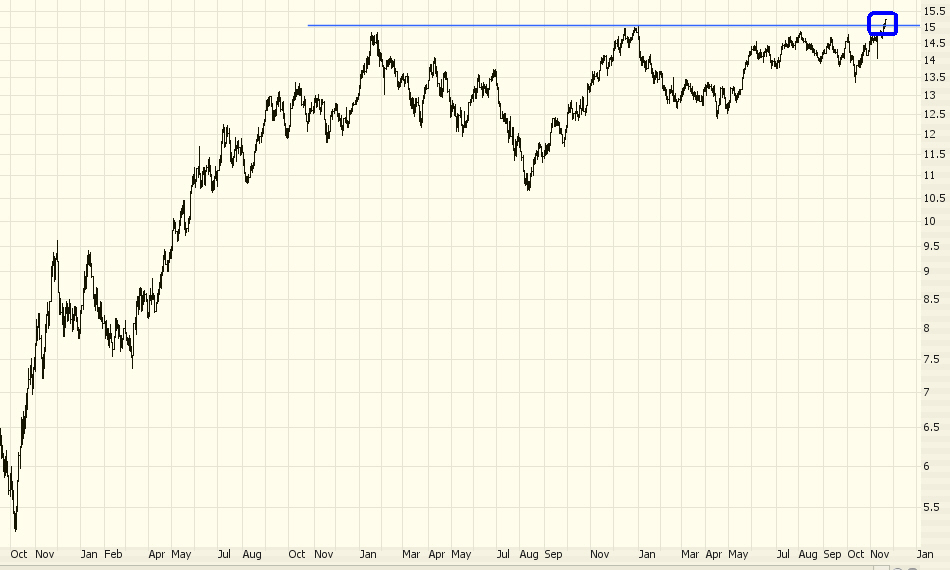
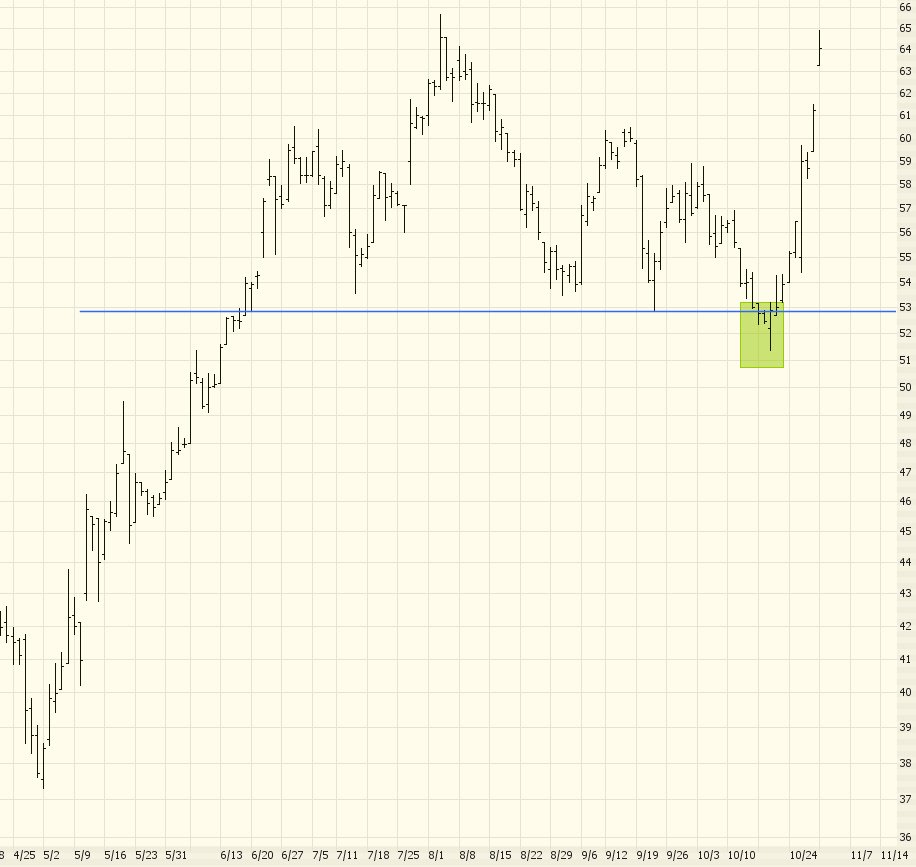
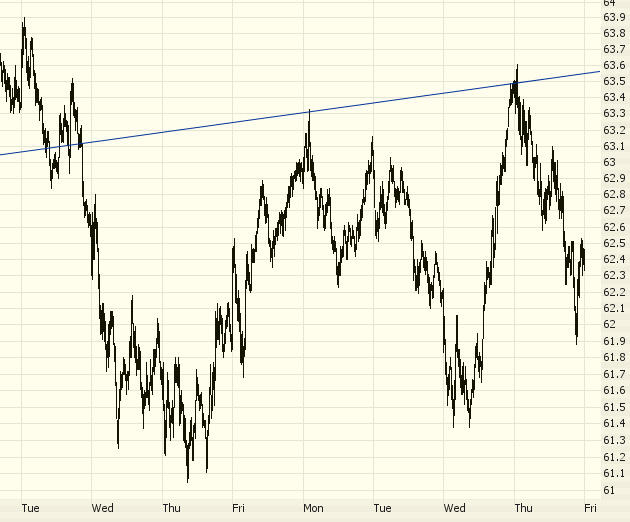
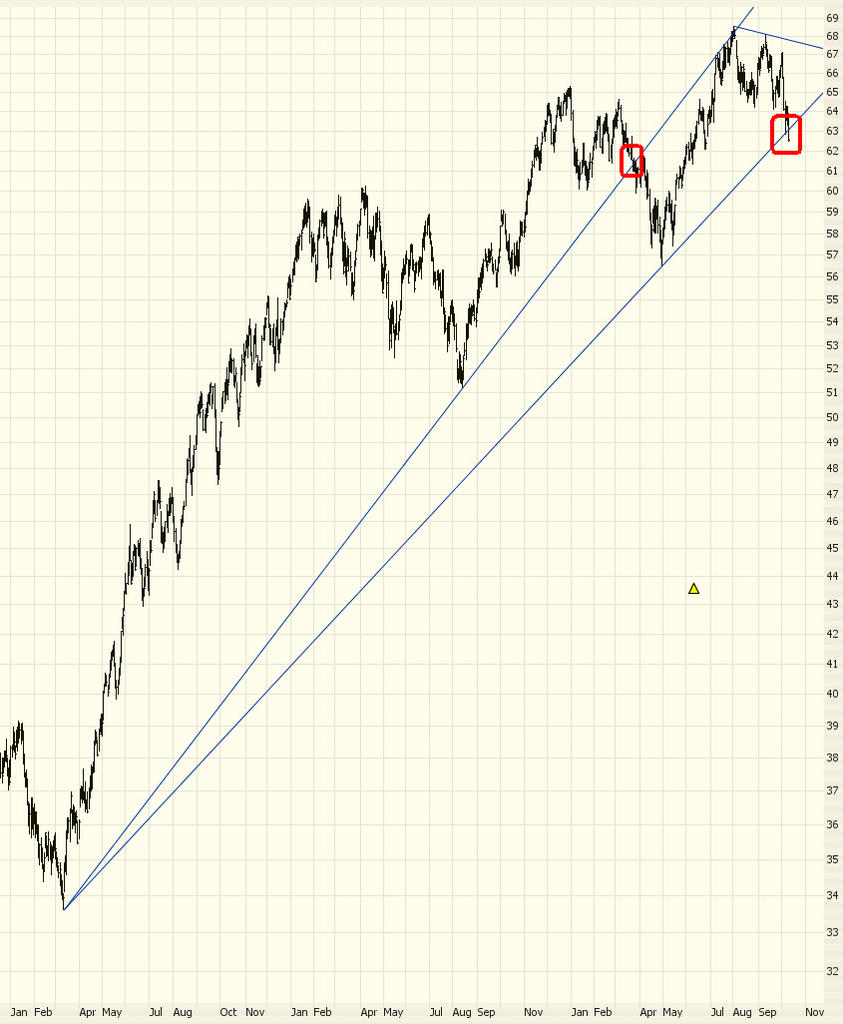
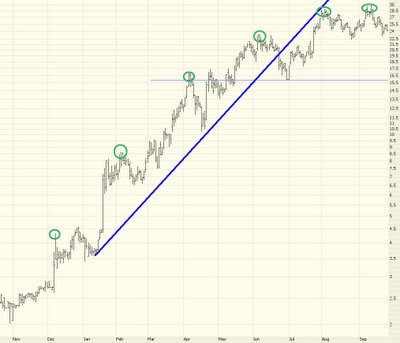
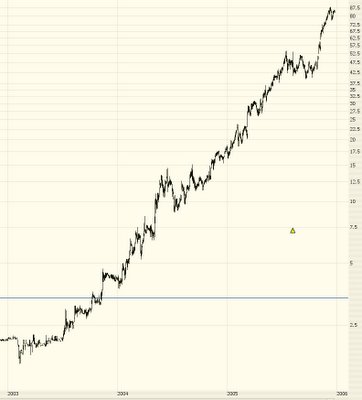
Shorting these momentum stocks can be risky business, but let me point to a recent example that was a pretty clean trade - Forward Industries (symbol FORD). Here's what the stock looked like over the past year or so. Notice this important fact - - although the stock was pushing higher, the momentum was clearly slowing.

I've circled the ascending highs to try to make this point more clear. I've also drawn a sharply ascending trendline to illustrate how its role as support plainly changed to resistance, thus indicating that at least the "straight up" direction of the stock was slowing down.


When I saw this stock a couple of months back, I was intrigued. What kind of business is this? I did a bit of research and found they were in the business of - - hold on to your hat - - cell phone covers. You know, like cases. I was floored. I don't pretend to know anything about that business, and I couldn't argue with the success of the company, so they must have been doing great. But cell phone covers? Was that really a rock solid high-growth business with high barriers to entry?

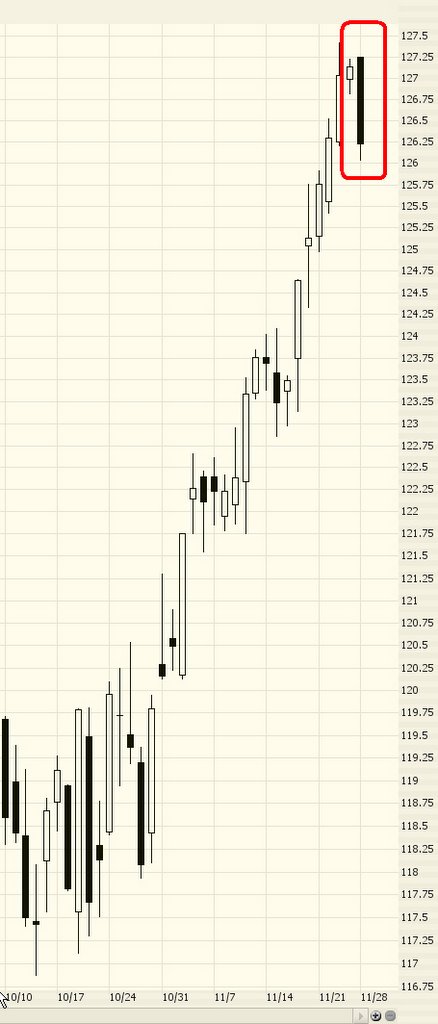
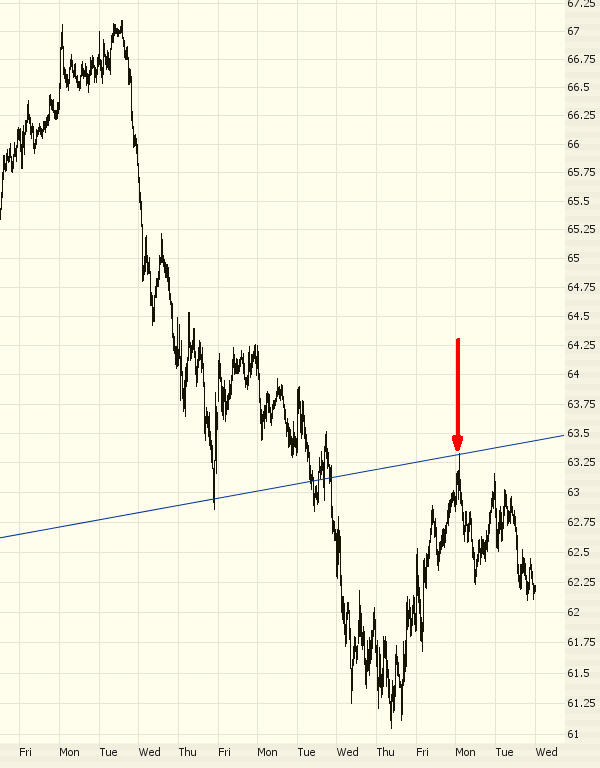
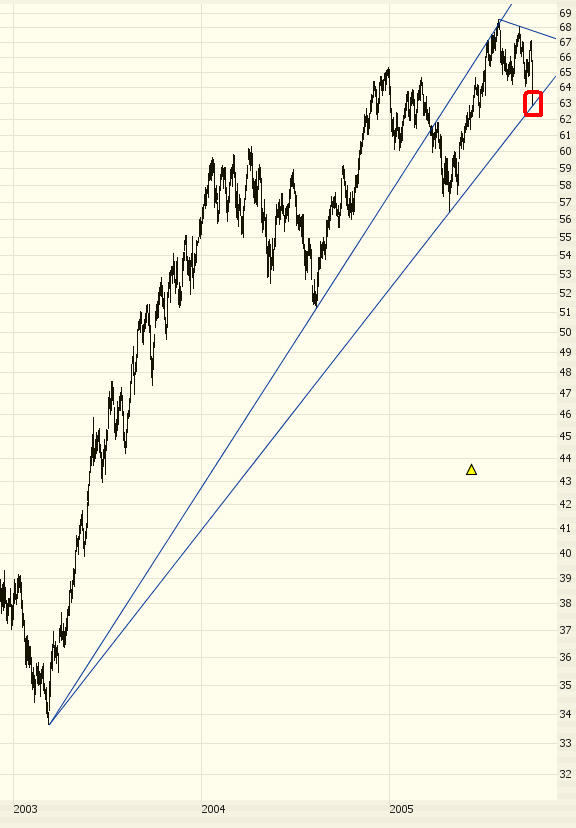
I kept an eye on the stock, and when it made another thrust upward, I shorted it. I've put a circle on the chart below to indicate where I went short the stock.


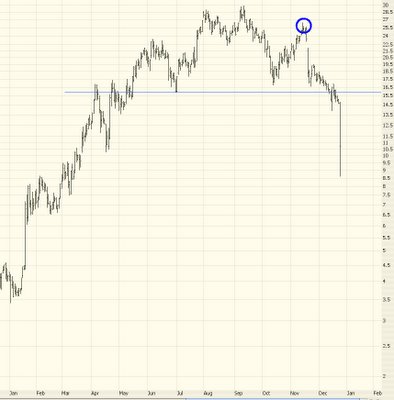
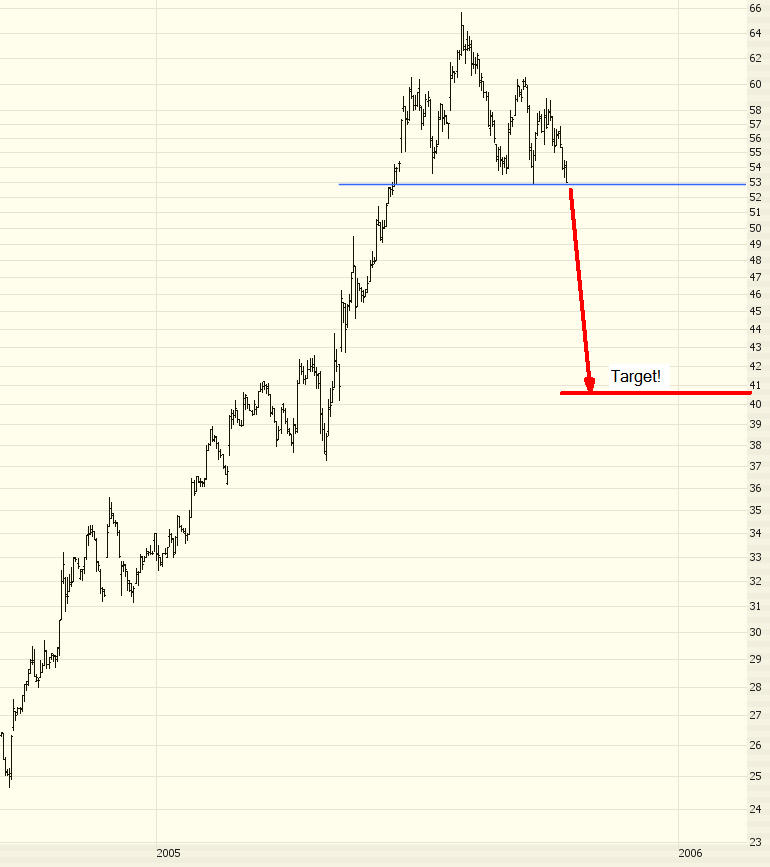
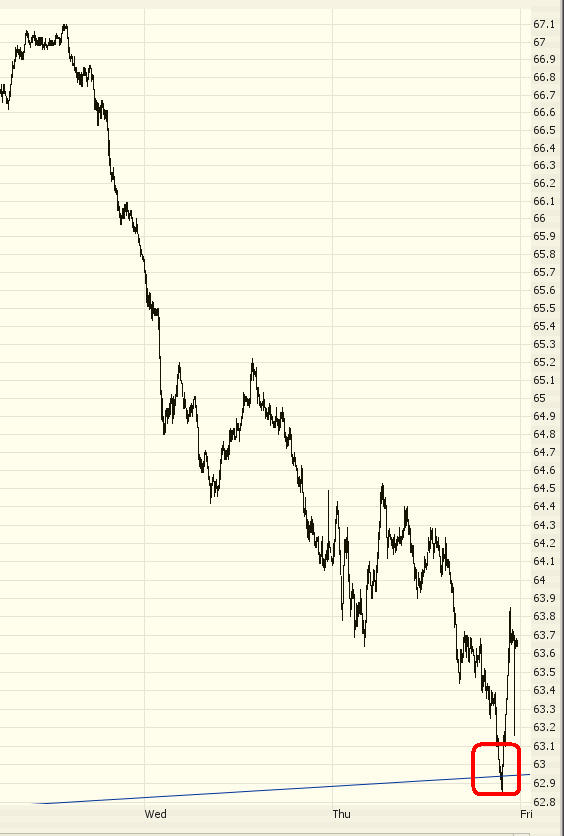
A few days back, FORD announced revised expectations, and the price just swooned. You can even make out a pretty decent head and shoulders pattern. My point here is that waning momentum on a former high flier can make for a great short.

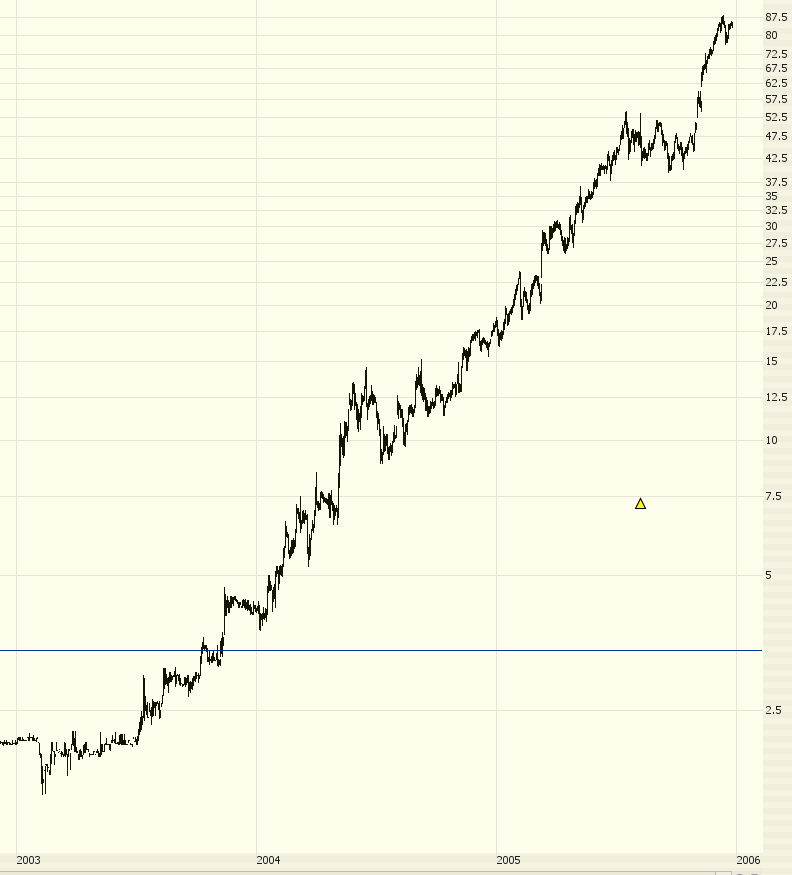
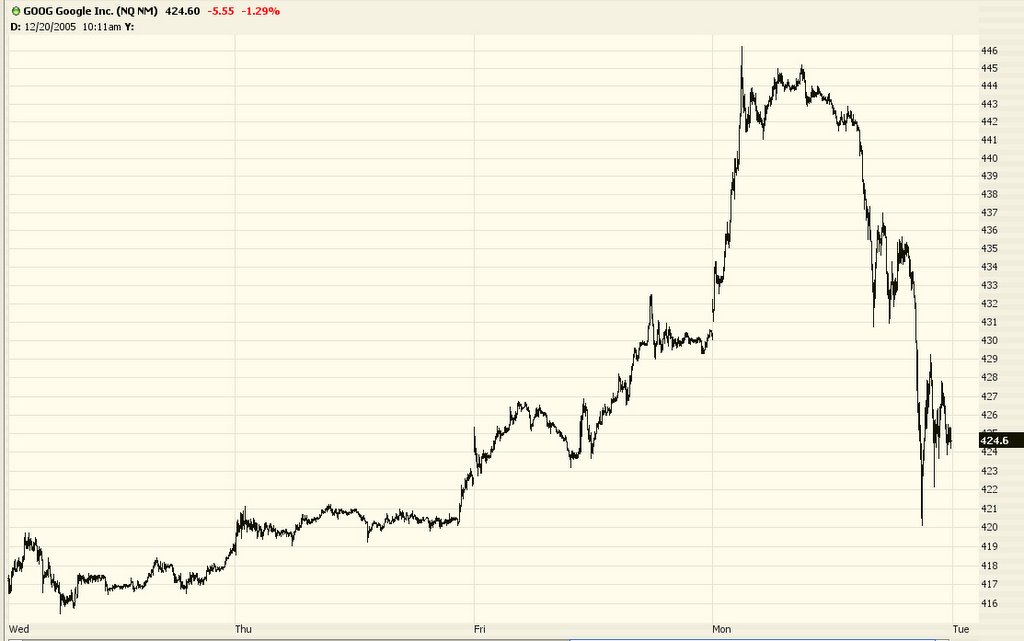
Some other high fliers (which may or may not turn out to be great shorts......only time will tell) including GOOG, HANS, WFMI, and, as I mentioned before, NTRI.

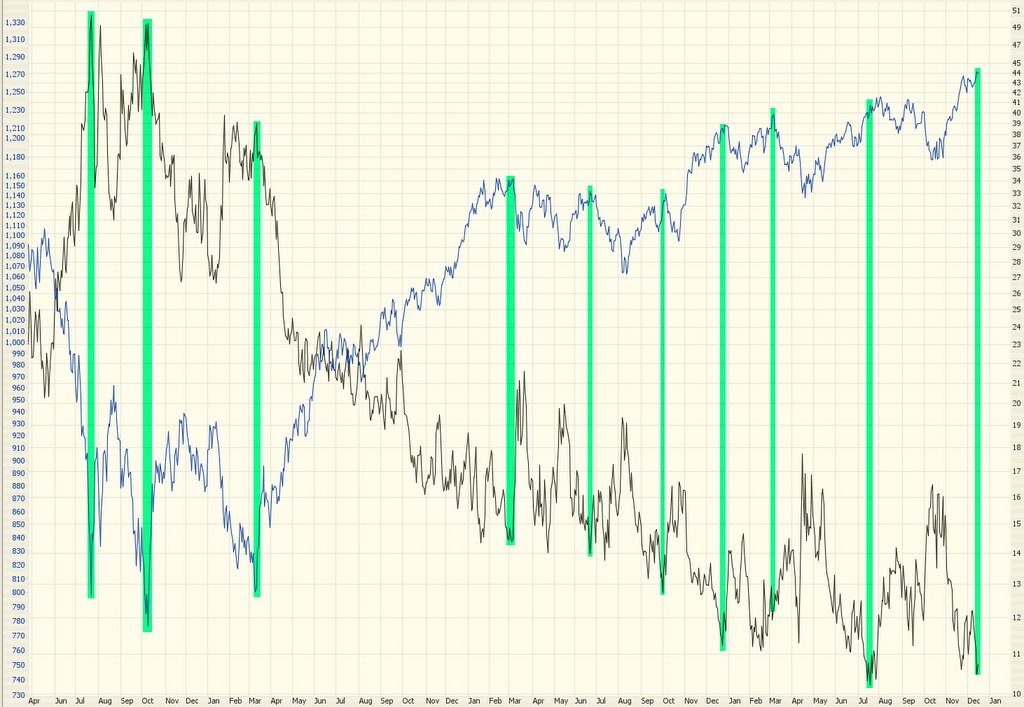
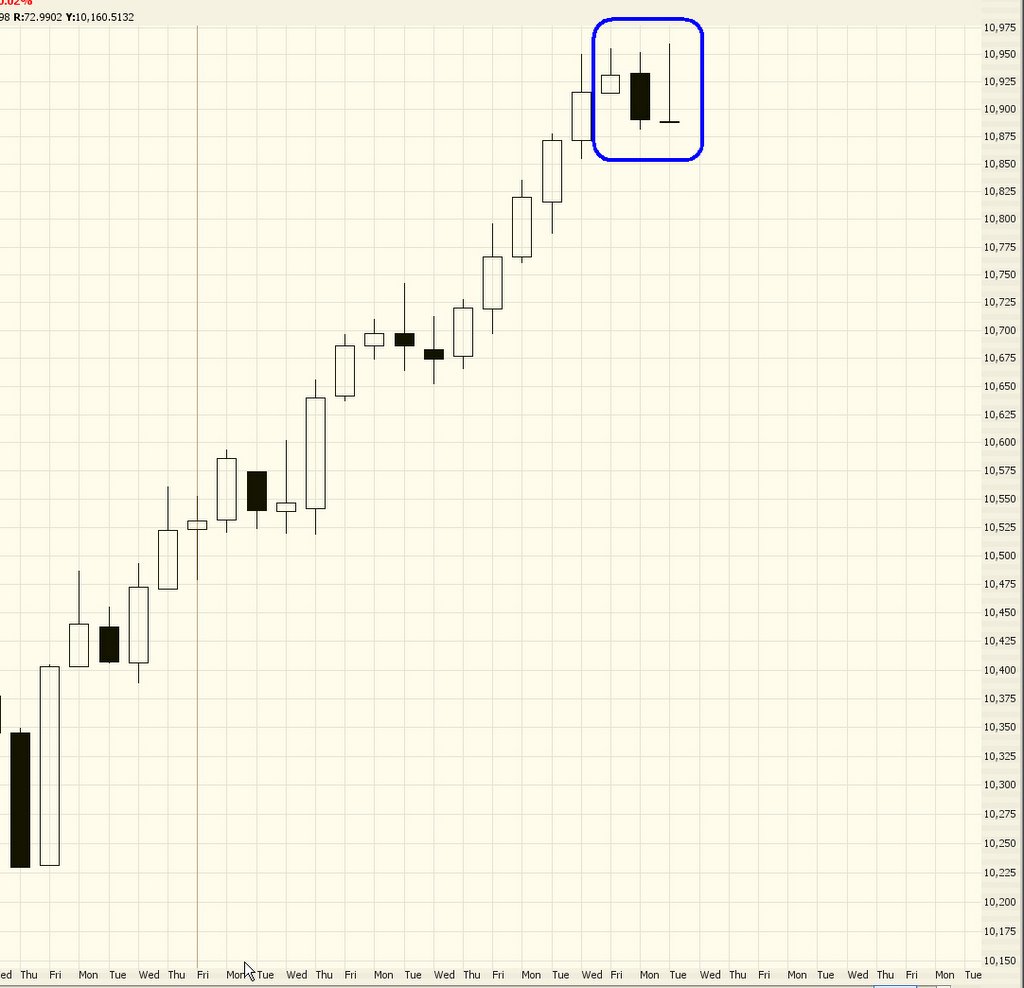
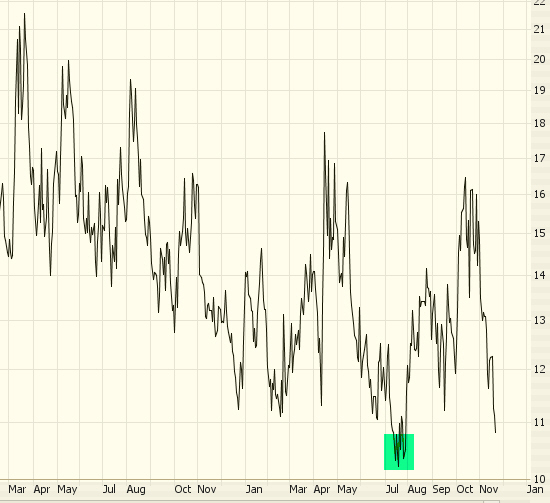
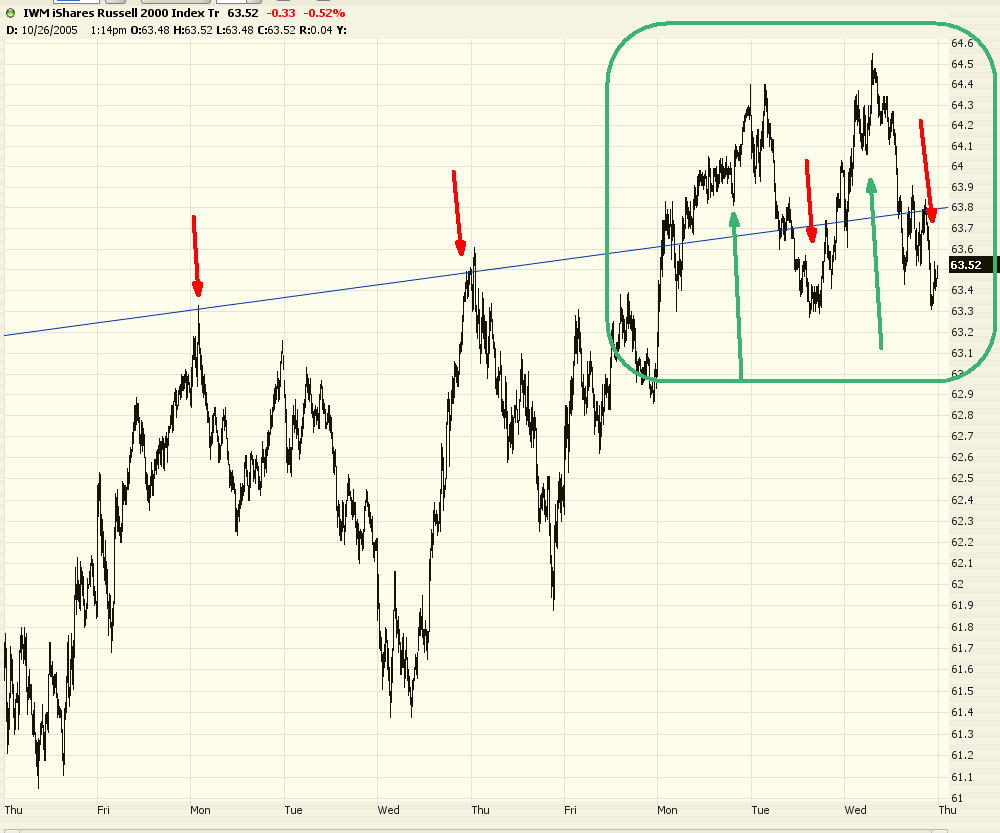
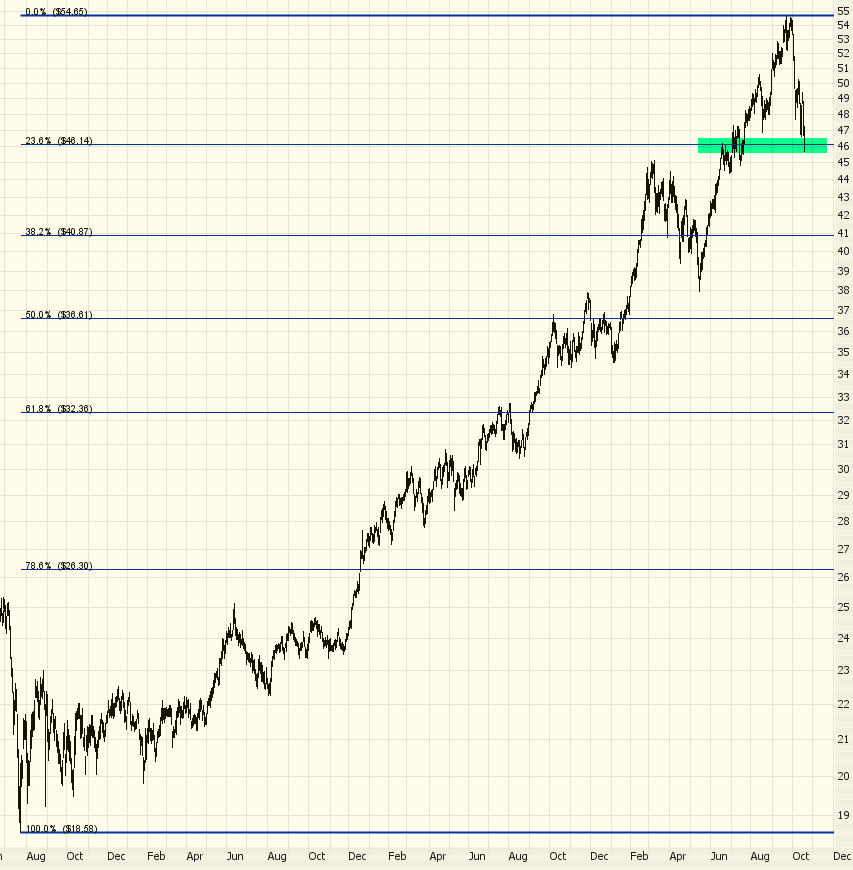
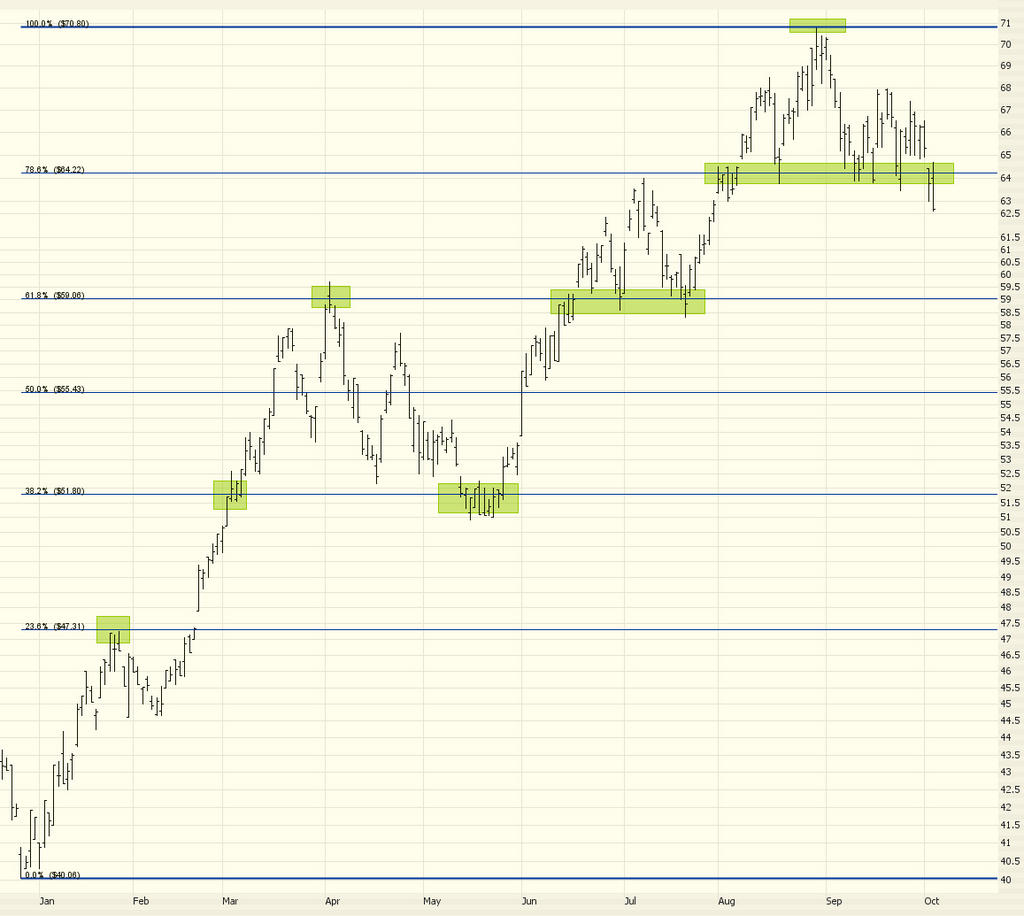
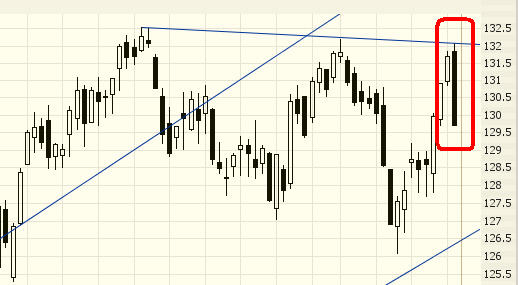
NTRI, shown below, has had a huge run up. If the broad market continues to weaken as it has been, and this stock doesn't regain its momentum, a trade like this could be a terribly profitable short, particularly if you're willing to take on the even greater risk of owning a put option position instead of a straight equity short.


I'll be sure to put up a post shortly after Friday's close to find out if the Dow wound up in the plus or minus column this year. It's going to be a photo finish!

Thursday, December 22, 2005

Borrrrrring.........

This market just can't make up its mind. A little up. A little down. Then a little up. And a bit down. Make up your mind! Sheesh!

Maybe this will be my last pre-Christmas post. Just wanted to let you know I'm still here. As I've said, if the Dow blows past 11,000 with force, the bears are in big trouble (umm, that would be me) and there are plenty of great looking saucer and inverted head & shoulder patterns around. But this market is doing nothing!

Well, happy holidays to you and yours, and let's hope this market decides to do something with itself sometime soon! A clear direction would be a welcome change.

Monday, December 19, 2005

The Bulls Will Fail

With each passing day I like this market more and more.

The sneering, smirking bulls, with their obsession over "Dow 11,000", keep failing to do it. They just can't. No matter what favorable news blows their way, and no matter how many millions of people are falling all over themselves to push the market higher, it's not working. The market's not going up.

What's cool is that every morning they try again, and they fail again. As I've said in the past, this is exactly what we want to see. The market opens, they stamp their little hooves and push the market 30, 50, 70 points higher.....and it stalls. And starts slipping. And spends the rest of the day giving those gains back and, more often than not, closing lower for the day.

There are now just eight trading days left in the year. At this point, for the entire year, the Dow has gain 53 points. I am hopeful that minuscule gain will be wiped out and replaced with a loss before the year is over so we can throw this decennial pattern in the garbage where it belongs.


Now let's take a look at the current insanity, Google. About a week ago or so, in an attempt to outdo other analysts, one stock analyst made a projected price target of $500 for Google. What's this thing with big, round numbers? Does this guy really get paid this much to just dream up a big round number? Is there actual analysis behind it? What about $600? Or $700? Why not a good old 1990s $1,000 price target?

Well, anyway, Google shot out of the gates today because they look close to catching some of that AOL magic (take a good look at the dog TWX stock to see how much life is left there). It was up $17 or so, blasting to another lifetime high. And it stalled. And started sinking. It finally closed down nearly $6 for the day. A daily range of something like $25. I actually had bought puts on it near the top but chickened out. Just look at this insane intraday chart (below is about the past 5 days).


I am hoping 2006 will put us in a position where the bears really take charge. We're sort of gently tapping the bulls away at this point. I'm wanting to rip a few thousand points out of the Dow and see real blood in the streets. 2006 could be the year for that kind of action. Below is a list of all my current puts and shorts. All of them are already deeply profitable, and I'm counting on many gains to come. Let the games begin!

Thursday, December 15, 2005

Bulls Still Struggling

The market opened strong this morning, with the latest economic report showing the lowest inflation rate in years. But when I clicked over to see how my dozens of short positions were doing, I noticed most of them were "in the green." And it didn't take long for the flimsy rally to fade away, as the market entered negative territory and stayed there for the rest of the day.

Let's take a fresh look at the VIX, the measurement of volatility on the S&P 500. Years ago, this indicator would typically range between about 20 (low volatility, usually indicating the top of a market) and 55 (high volatility, often preceding the bottom of a market).

Ever since early 2003, however, this indicator has sunk to never-before-seen levels. It currently reads an almost record low of 10.73, which might suggest an important top in the market.

Here's a chart showing the VIX (black line, right scale) versus the S&P 500 (blue line, left scale) over the past 3 1/2 years. As always, click on the image to make it larger so you can see it better. Look at the picture and judge for yourself what this chart might be telling us. I've put some green highlights to ilustrate how these two charts are often "mirror images".

Tuesday, December 13, 2005

Breakout........or Failure?

Today, for the 13th time in a row, the Fed increased interest rates. Perversely, the market rallied on the news (supposedly because there was a suggestion that perhaps the rate hikes would stop). It wasn't that many years ago there was a saying about "three steps and a stumble" (in other words, three rate hikes in a row preceded a bear market). I guess even 13 hikes haven't done the trick yet.

The market has been going nowhere for a long, long time. The flip side of this, however, is that when the market does finally decide to go somewhere, the move will be substantial. Even I, Mr. Bear, concede that if the Dow breaks 11,000 in a meaningful way, the market is going to rally strongly. There is simply too much pent up energy to hold it back. Conversely, if the market keeps failing to penetrate 11,000, as it has done repeatedly already, the market will finally succumb and wilt downward.

Take a look at the past couple of years of the Dow 30; notice where I have marked the 11,000 threshold:


There have been two earnest attempts to pierce 11,000. If it can't "punch through", the bear market I've been yacking about all year will finally start to take hold. Until then, everyone - including me - is in wait-and-see mode.

The market will either have the strength to push itself past the resistance that's been holding it back for many months, or it will finally throw in the towel as people rush for the exit doors and take profits as quickly as they can.

Thursday, December 08, 2005

Cute with a Capital Q


I'll stifle all the bearish hoo-ha for a day and mention one honey of a stock pattern - Qwest Communications (symbol Q). This is a fantastic inverted head & shoulders pattern with a good volume and price spike today.

I've mentioned this stock in the past, but I wanted to put out a reminder since it's clearly broken above its neckline at this point.

Wednesday, December 07, 2005

Battling the Decennial Pattern

There are only 16 trading days left in 2005.

As has been stated over and over again - particularly before the year began - 2005 is "fated" to be a positive year for the Dow because of the Decennial Pattern (e.g. years ending with 5 have, ever since the creation of the Dow in the late 19th century, had a positive return - - indeed, a VERY positive return).

Years ending with 7 and 0, by contrast, have done relatively poorly.

As a bear, I am wanting to snap this pattern. I want it to end this year, because (a) we'll never hear about it again! (b) it'll be a major psychological blow to the bulls, with whom we are engaged in this financial war.

Well where do things stand now? Let's take a retrospective with the most recent instances of the magical "5" years....

1975 - 38.3% return
1985 - 27.7% return
1995 - 33.5% return

Wow! Those are really impressive numbers. So how's it going, 2005?

2005 (to date) - 0.2% return.

Whoo-hoooo! A whole FIFTH of ONE percent! Wow! Considering risk-free CDs are paying twenty times that much, that's pretty weak, wouldn't you say?

But it's still a positive number! Yet again, the year's not over until the fat lady rings the closing bell at the NYSE.

Stay tuned. The magic number of Dow 10,783. Above that, the bulls have bagged another one. Below it - - - you won't be able to shut me up.

Sunday, December 04, 2005

The Windup......and the Pitch!

As a new trading week approaches, most of the talk is about crossing Dow 11,000 (as if this is unprecedented; we were last there in June 2001). Clearly, given the market's strength since October 11th, it would be a psychological boost to the bulls to cross this threshold.

It could well happen. In fact, given the market chatter, it seems almost a foregone conclusion. But what if it does? What next?

There have actually been a number of breakouts over the past few years, and it pays to take a look at their respective "windups" (the amount of time they were forming before they broke out) and "pitches" (just how much oomph was in the breakout).

I offer below the Russell 2000 for the past three and a half years. I've taken the liberty of illustrating each major breakout, showing the length of time (in purple) and the subsequent rise upward (in green). Click on the image for a bigger version.


You've probably noticed a pattern already. With each successive breakout, the length of time gets shorter, and the subsequent strength (and its longevity) gets weaker.

I put these figures into a spreadsheet, and here are the results:

Breakout One - 522 Days - 15.13% rise
Breakout Two - 216 Days - 8.07% rise
Breakout Three - 187 Days - 4.88% rise
Breakout Four - 120 Days - ??? rise

The breakout (if we agree to call it such) just took place on December 1st. If past patterns are any guide, if the breakout holds, the rise we may see is a relatively wimpy 2.44%.

But more important is this - - the trend will eventually change. It is inevitable. No market keeps going up forever, and eventually, a broad uptrend becomes a broad downtrend. And how does that happen? By a market ceasing to make new higher highs and instead making lower lows.

So when a breakout fails - - when the pattern breaks - - then the trend, ipso facto, can change. So has the trend changed yet? I have no idea. But one thing is clear - if the past several years are any guide, even if the Dow breaks 11,000 and the markets keep heading higher, there sure isn't a lot of windup behind this particular pitch.

Wednesday, November 30, 2005

Bears Getting the Upper Paw

It happened again.

Everyone was awaiting a major economic report - this time, the GDP. It was revised up - way up - which no one expected. The result?

The Dow 30 - down.

The S&P 500 - down.

The NASDAQ 100 - down.

This is exactly what we want to see. For even good news to be powerless. Because when the good news runs out and turns to bad, the slide will quicken.

I don't have any new charts to add today. There have been plenty of those recently. Just wanted to share the joy.

Oh, one stock I will point out that looks like a good (shhh.....) buy (yes, buy) is Akamai (symbol AKAM). Take a look at the entire history (daily basis) of this stock. Lovely saucer pattern, breaking out on strong volume (I certainly hope you're using Prophet JavaCharts and not some lesser system).

Actually, let me amplify that remark. Perhaps you think I'm a "Johnny One Note" who only talks bearishness. Not true. There are a host of BEAUTIFUL stock charts out there for those who want to buy. I'm just too bearish in general to do so. But if you want to check them out, here they are:

ABI
AKAM
ASYT
BIDU
BLKB
CELL
CSC
GFI
IVIL
MCHP
NOVL
PAYX
Q
RADN
RATE
RBAK
SIGM
STAK
VIGN

Tuesday, November 29, 2005

When Good News Can't Help Anymore

There were two very important economic reports that came due this morning.

The first was Durable Goods Orders. The consensus on this figure ranged from -.5% up to +2.5%. The general consensus was 1.8%.

The figure came in at a totally unexpected 3.4%, far stronger than even the highest estimate.

Half an hour after the market opened, another key figure came out: the Consumer Confidence Index. Its consensus range was from 88 to 92, with 90 being the average consensus. Once again, the actual figure blew away the estimates and came in at 98.9

What'd the market do? It shot up, of course. The Dow was up 70 points early in the day.

Then it started easing. And kept easing. And kept easing.

Where'd the market close? Up 50? Up 25?

The answer: the Dow Jones 30 closed down 3 points today.

Now, why does a gentle technician like me care about all this? Because if fantastic economic news can't keep this market from going limp, what's going to do it? Anyone? Bueller? Bueller?

I think you see what I'm getting at. If even great news can't move the market up, we bears don't have to fear it. Because what's going to happen when bad news comes out? Well, it probably won't be great for the bulls.

The market peaked today at 10,960, just 40 points shy of the psychologically key (but otherwise completely meaningless) 11,000 on the Dow. Google, mentioned yesterday as a stock on which I owned put options, closed down nearly 20 points (20 points! Most stocks aren't even worth that much!)

In my view, the market (as measured by the $SPX) peaked on November 23rd at 1,270.64. Look at the graph below, and notice how beautifully all the Fibonacci retracements line up:


I'd also like to point out the amazing shooting star pattern on the Dow. It's absolutely textbook!


There's about a month left in the year, and the Dow is currently up 1.5%. Hopefully the Dow will close out the year at less than 10,783, which will "break" this decennial pattern and be another feather in the cap for the bears.

Monday, November 28, 2005

New Hope for the Bears?

The stock market has been going virtually straight up since October 13th, much to the chagrin of dyed-in-the-wool bears (waving hands wildly, pointing at self).

Nothing would be better for the bears than for everything seem to be in favor of the bulls and then have the carpet yanked out from under their grimy little hooves. As a reminder, what's in favor of the bulls right now is (1) the Decennial Pattern (2) strong seasonal bias (the so-called January effect, which tends to take place in December!) (3) recent broad-based strength, particularly in the NASDAQ.

One day does not a trend make (or break), but today was heartening nonetheless. Witness first that the market opened higher and spent most of the day sinking. The Dow, approaching 11,000, may be turning tail again. A double top would be potent elixir for the bears. (Reminder: click on the image to see a bigger version of this graph, then click Back to return to this scintillating post):


I also want to point out that, across the board, both indices and individual stocks alike had examples of the bearish engulfing pattern (one of the easiest-to-spot and powerful candlestick patterns). Check out the SPY, and notice how it stands out from the price action over the prior six weeks:


Google, which has had a swashbuckling year, seems to do little but go up. Although I am loathe to call a top on this powerhouse of a stock (which, by the way, happens to represent a very fine company!), here is another fine example of a huge bearish engulfing pattern.


It's important to get a sense as to the scope of the market. I am, for example, long puts on Boeing (symbol BA). This is based on a recent trendline break. Boeing has recovered from this break, but the damage may have been done already. Although the above graphs are very recent history, look at the graph of BA below which spans about 12 years. Witness just how far BA has ascended over the past couple of years, and imagine the possibilities should the market ever start really falling (ahem, if it ever gets any traction in the downward direction). There's a looooong way to go.


For those interested, below are my current positions. I will once again state that this blog is merely a place for me to spout ideas and thoughts on the market. Your analysis is up to you. So trade at your own peril! Anyway, the underlying symbols for my put positions are:

BA
CI
DIA
GOOG
MAR
MMM
SBUX
SPY

And the straight short positions are.....

AIG
APC
BMHC
BZH
DOW
EMN
ET
FDO
HLT
KRC
MON
PETM
SGMS
YELL

Monday, November 21, 2005

What's Next for the Bulls & Bears?

These are the times that try bears' souls!

Between the "decennial" magic and this bullish time of year, bears are getting smushed. Some major indexes are reaching highs never seen before - - ever! Examples include the very important Dow Transports ($TRAN), the MidCap 400 ($MID) and less known but still important indexes like the Morgan Stanley High Tech 35 ($MSH) and the Morgan Stanley Internet ($MOX). These last two look extraordinarily bullish.

The Dow Jones 30 ($INDU) is only 180 points away from the psychologically important 11,000 level. The last time it got close, earlier this year, it turned tail and ran. Clearly if it manages to get onto the other side of 11,000, it will be extremely heartening to the bulls (big, round numbers make for great press).

I still believe - yep - that the market is ultimately in for a huge tumble. But you can't argue with the prices and the strength. This market has been powerfully strong since October 11, and there aren't any clear signs of it abating for any technical reason in the near term.

I am not seeing a huge quantity of individual stocks that look like great buys. Once exception is Quest Communications (symbol Q) which has a beautiful - - albeit slanted - - inverted H&S pattern. Notice, too, the handsome increase in volume in recent months:


The $MOX, mentioned earlier, sports a similar pattern, although it's so level you could do carpentry on top of it:


One cautionary note for you bulls out there - the VIX has, naturally, descended given the market's rise. It has reached a level not seen since July of this year, which was a high water mark for the market. I've highlighted the area of the VIX when it bottomed out and, subsequently, the market went into a sustained dive.


One short that has done quite nicely for me is PetsMart (which I've mentioned once or twice before). It's a beautiful head & shoulders pattern which has ascended to touch its neckline and, starting today, is moving away from it.

Thursday, November 17, 2005

The Bearish Case Weakens

Well, as much as I hate to admit it, the case of a downfall in the market anytime soon took another blow. Recent strength in the market - especially in the face of what should be viewed as weak economic data - speaks for itself. I'm getting very close to the point that even I'll have to admit the bulls are firmly in control for the forseeable future. (And some stocks are just beyond belief - check out NTRI and HANS!)

The S&P 500 ETF, the SPY, is getting terribly close to crossing above its highs for this year. If that happens, that will be the final nail in the bear's coffin for the time being:


Some major ETFs have already crossed into new high territory. Particularly strong is the Nasdaq 100 ($NDX):


Also strong, and until recently a favorite short of mine, is the MidCap 400 ($MID):


So, as long as I'm sheepishly visiting the bullish camp, how about some specific suggestions? The stocks below are in technical formations that appear quite attractive; I suggest you check out the charts and see for yourself:

ABI - Applera Corp
RATE - BankRate
JCOM - J2 Global
KYPH - Kyphon
NOVL - Novell
RBAK - Redback Networks
VIGN - Vignette

It will take a pretty serious swan-dive for the market to clearly be bearish again. I hope that it happens, but remember, the word "speculate" is derived from the Latin verb "speculare". Which means "I observe", not "I hope....."

Tuesday, November 15, 2005

Repelled!

As a devoted bear (ahem: duh) I have been nervously eyeing the Dow, which has been the strongest index of late and has threatened to cross above 10,725 in a meaningful way.

Over the past several months, the Dow has tried to pierce this level, as shown below. It has failed every time. And any failure to push past a resistance level only strengthens the bear's argument that that level will not be surpassed, and the fall will be just that much stronger when it comes.


I was disheartened to witness the Dow push through this level today, but the curious thing was that the 22 stocks in which I have short positions didn't follow suit. In spite of the Dow's strength, many of them remained weak.

Three hours before the close, the Dow peaked, it started falling, and it never looked back. Not to say today was some kind of amazing plunge - the Dow only lost about 10 points. But what's crucial is that the Dow was pushed away yet another time from this resistance level, and just about every index wound up in the red.

There are many time-based reasons the bulls have an upper hand. The decennial pattern (described here) is terribly potent. Plus the timeframe of November 1 to April 30 is traditionally the stronger half of the year. So the bears have plenty going against them. (I would note that, with 2005 almost over, the Dow is down a fraction of a percent. Hardly jibes with the awesome gains illustrated in the decennial pattern article).

As the Fibonacci retracement indicates below, this level of 10,725 is a key line in the sand. As long as it can stay below it, the odds of the market "cutting loose" to the downside stay strong. If this line is penetrated in a meaningful way and the prices close above this level, I will have to reconsider my position.

Thursday, November 10, 2005

Using Retracements Short- and Long-Term

Today's entry is going to be about using multiple Fibonacci retracements in different timeframes. Now, wait, wait; don't roll your eyes and turn on the TV just yet. This isn't as dry as you might think. Stay with me on this one.

The general point is that using the Fibonacci retracement is very useful not just for long term analysis but short term as well. On one given chart, you might have two, three, or even more retracements drawn.

For those of you relatively new to these, they are quite simple to draw - typically the reference line is drawn from one price extreme to another, and the retracement lines are automatically placed on the chart. Take one of my favorite examples these days - the NZD/USD currency pair (New Zealand/US Dollar). I have been touting this as a short position for quite some time.

Look at the chart below (frequent reminder: click on it for a bigger view). It shows the NZD/USD over the past couple of years. I've highlighted in green where the price tends to "hug" or bounce off of the various retracements. I find this behavior uncanny.


Although you can just barely see it, I've drawn another retracement way up in the upper-right hand corner of the graph. This is for just the past few weeks of activity. Below is a zoomed-in portion of that graph. Once again, you can see how the prices line up beautifully.


As you can see, these retracement levels are invaluable. If you are "between the lines" and moving either up or down in price, you already have advance warning as to where the price is probably going to pause. In addition, once it breaks through a price level (either up or down), you can have a higher degree of confidence that it will move more smoothly from that point until the next level is reached.

Tuesday, November 08, 2005

Two Great Short Ideas

Since this market still can't make up its mind about which direction it's going to go, I thought I'd share a couple of favorite short ideas, both of them in massive head & shoulders patterns. I've mentioned each of these before, but they are both so good, I wanted to revisit their latest charts.

The first, PetsMart (PETM) broke beneath its neckline, took a sharp fall, and then has retraced beautifully to the neckline. This is a gift! It represents a much lower-risk place to put in a short order. Prices don't always return to the neckline, and the stock has already "tipped its hand" about the direction it will probably go. I've put an arrow indicating a target price.


The second, Family Dollar Stores (FDO) is a much, much larger pattern. In fact, whereas the chart above spans five years, the chart for FDO spans a much broader period. In addition to being in a head & shoulders pattern (albeit not as squeaky-clean as PETM), it has broken beneath a major ascending trendline. So you have a breakdown from not just one pattern, but two.


Two reminders - first, you can click on any chart on this blog to see a bigger version; and second, take these suggestions at your own risk! Your own analysis needs to drive your trading. I merely offer these as interesting examples of technical patterns.

Saturday, November 05, 2005

Best of The Blog

I enjoy writing about my trading in this blog, but there have been so many entries, I thought some newcomers might like to see a few "best" choices of my favorites. Click on any of the links below to read the article, and click the Back button to return to this list.

Century-Long Pattern - Probably my favorite one, this shows the incredible convergence of Fibonacci fans showing major turning points of the Dow 30 index. Spooky!

The Bearish Big Picture - As will quickly become clear to newcomers, I am a raving bear. This shows the long-term picture of my opinion.

False Breakouts - My predictions are not always right! (Far from it.......) This gives you some guidance as to how a TA-based assessment is useful in helping you know when a breakout has failed.

VIX Tricks - The VIX is the widely-followed volatility index on the S&P 500. Here I describe the correlation between the VIX and market direction.

Russell 2000 Cracks! - I'm proud to say that I nailed to the day the top of the Russell 2000 (so far, at least). This post pinpoints the turning point.

Short Ideas - A post with some specific short recommendations; some worked, some didn't, but check out IVGN, CNMD, HSY, and KMG - they all got walloped after this posting.

Reasons to be a Bear - My five reasons for bearishness in this market.

Fabulous Fibonaccis - The crude oil market provides a stellar example of how useful Fibonaccis can be for providing price prediction.

Trendline Bounce - A marvelous example of those amazing trendlines in action.

Friday, November 04, 2005

Revisiting FOREX (NZD/USD)

I've posted a couple of different times about the attractive short position in NZD/USD (which basically means the New Zealand Kiwi should fall in relation to the US Dollar).

This continues to be a good trade. Over the past several days the US Dollar has been very strong, so NZD/USD continues to get pounded.

As the graph below demonstrates, these markets are extremely volatile (the graph on the left is the past several days of the EUR/USD and on the right is NZD/USD). As the highlighted portion shows, these markets can spasm on news in one direction and then flip around and rush the other direction. Trying to trade on too short a time horizon is almost always a money-losing proposition in the FOREX markets.


I am not sure if NZD/USD is temporarily oversold at this point; it was definitely hammering out a short-term bottom near the end of trading today. The big picture remains superb for shorts. But, having fallen so far, it isn't as safe a bet in the short term since it could recover to the upside. Over the course of weeks and months, however, this still looks terrific.

Monday, October 31, 2005

Knowing When You're Wrong

For those of you who follow this blog regularly (and there are millions!) you may recall I made a strong suggestion that Carter's (symbol CRI) was headed for a tumble in this recent posting.

Well, I was wrong. The stock did go just beneath its neckline, and then ZOOM, it shot up like a rocket. Anyone who stuck with this short would have gotten creamed.


The reason I'm pointing this out is to show that technical analysis has two roles: (1) to indicate trades that have a strong likelihood of moving in a particular direction (2) more importantly, to have a precise point where you know the prediction is invalidated and the trade should be closed. In other words, technical analysis shows you when you're wrong. Other approaches permit you to talk yourself into "hanging on just one more day" until you're broke.

Take the above example. Yes, the stock moved under the neckline. But it moved back above it! At this point, you know that this trade isn't going to work out, and you close it for a small loss. Small losses are totally OK! It's the big ones (which you would encounter if you just blindly stuck with this trade) that kill your account balance.

Modesty is key to successful trading. Part of that modesty is to recognize quickly when you are wrong, get out of the trade, and move on a little poorer and a lot wiser.

Wednesday, October 26, 2005

The Bull & Bear War of 2005

Until Friday of last week, the market was a bear's dream. On Monday the 24th it became what looked like a nightmare, as the Dow rocketed over 160 points and there was strength across the board.

Now that a couple more days have passed, I have had the opportunity to look again at the markets overall. My point-of-view remains utterly unchanged. I still believe we are at the beginning of a major descent, and Monday's action was one of many "one-day wonders" that we are bound to see that will frighten less stalwart bears away.

As you may recall from my earlier postings, the market (specifically, the IWM, which is the broad Russell 2000 ETF) "kissed" the underside of its broken trendline not once but twice (as shown by the down-pointing red arrows on the graph below). On Monday it kissed it again, then it kissed it good-bye as it jumped to the other side.

This was discouraging at first, since it seeemed the broken trendline had been overcome. But look at the graph below. A violent war is ensuing between the bulls and bears. You can practically see the opposing sides shoving the price from one side to another of this "line in the sand" that is so important to the market's future direction.


The key, as always, is which side has more strength. Judging from the charts I am looking at (and I look at hundreds), there is an overwhelming case for a severe downfall. Trendline after trendline, Fibonacci after Fibonacci, they all point to the same thing - - that the market IS broken already, and we're going to keep heading lower in fits and starts.

Since I mentioned my beloved Fibonaccis, I'll point out again how marvelously helpful these can be in trading. OIH, which is representative of the oil group, descended sharply from its wild ride recently. It bounced perfectly off the retracement line, as you can see in the highlighted area below.

The upward bounce has exhausted itself. I re-entered the oil market on the short side in a big way today. Just look at the massive shooting star pattern (for you candlestick fans out there). As always, just click on the image to see a bigger version.

Thursday, October 20, 2005

You Knew This Already

See my post yesterday (click here) and then look at the chart below, which brings you up-to-date:


The market was repelled again. "The kiss of death" - twice - is what's happened this week. And you knew what to do a day ahead of when it actually happened!

Such is the beauty of technical analysis.

Wednesday, October 19, 2005

Kiss Me Twice!

I wrote yesterday about how the IWM had "kissed" the underside of a huge three-year long trendline, indicating how clearly support had turned into resistance.

After an initial softness this morning, the market firmed up and exploded higher. As you can see with the chart below, it once again "kissed" the underside of the trendline precisely!


The key question, of course, is what will it to tomorrow? If it is once again repelled, this will encourage the bears and discourage the bulls. If, however, the line is penetrated, it makes for a more shaky bearish argument, and the line becomes less meaningful for either camp.

I wanted to offer another example of how useful Fibonacci retracements can be. Over the past week or so, I was extremely short various crude oil markets, particularly oil service stocks. These positions (both shorts and puts) did quite well, but it's nerve-wracking to have a position racking of profits if you don't know when it's going to turn and go the other way.

That's where Fibonacci comes to the rescue. All I had to do was take a look at one chart - the XLE - to see that it was approaching a retracement level, meaning that both the XLE and the oil stocks were likely to bounce up.


And bounce they did. I closed out everything (and even bought XLE calls) just as the market whipped around the other direction. Thanks, Mr. Fibonacci!

Tuesday, October 18, 2005

Kiss My Trendline

On Friday, Saturday, and Sunday, I was speaking at a trade show in San Francisco about Prophet.net, and I was enjoying talking to users of our products (both current and prospective) and sharing ideas about the market.

Because I did a lot of demonstrations, I had more time than usual to look at charts, and I was amazed at just how beautifully bearish everything seemed. I can't remember a time when everything seemed to line up so well.

So much so that I told many people my belief of what the market would do when the new week began - - and not in general terms, but in specific, to-the-penny terms.

My prediction was that the market would open higher on Monday, carrying through with its upward momentum on the prior Friday. But that it would "kiss" the bottom of its major ascending trendline and start reversing, and that it wouldn't look back.

My term "the market" is specifically about the IWM, although the market in general applies. Below is the intraday, minute-by-minute graph of IWM. Notice how, early on Monday, it kissed the underside of the now-broken support (which means it's resistance at this point) and fell.


To........the............penny! (I would hasten to add that I don't "adjust" my trendlines after the fact; this is a well-established, multi-YEAR trendline; you are just zoomed in very close to it).

I am writing this on Tuesday afternoon, after the close, and one of the most critical earnings reports has just been issued (Intel, INTC). Revenues and earnings were sensational, and INTC shot up higher shortly after the announcement. Then it was breakeven. Then it's down. Last I looked, it had fallen about 3%, even on that terrific news. They haven't even held their conference call yet, so who knows if INTC will be up or down tomorrow.

But having a down market on bullish news can only bring tears of joy to a bear's big brown eyes.

Friday, October 14, 2005

Oh, Baby!

I could go on and on about the breakdown in the market this week (oh, Tim, please.....) but I won't. This Friday - like last Friday - our dear friends the bulls bid the market up in a one-day rally. Sorry, guys, it's too late. The giant ascending trendlines have been broken, and you were only able to push prices up to the underbelly of your former support. Game over, man. The bears are ready to party.

So while we look forward to next week, let me offer up just a single stock - a short, naturally. This one is baby clothes maker Carter's. A stellar head & shoulders pattern that holds the potential for a terrific drop, as indicated by the chart below.


Oh, and hey - it's optional! (Try .CRIWK) Good luck!

Tuesday, October 11, 2005

Crack.....

The "recovery" from last week's selloff lasted all of one day - - specifically, last Friday. And it could hardly be called a rally. The selling simply abated for a few hours.

The selling has resumed, and chart after chart looks like the one below (which is the symbol IWM), with major ascending trendlines being shattered to the downside:


I've highlighted the point where today's prices punched through the trendline as well as when this last took place in late March of this year. You can see what happened next.

I am short quite a few stocks right now, besides being short the market in general; specifically:

AH
BA
BMHC
BOOM
CMTL
DIA
DNA
FD
GOOG
HANS
HSY
LGF
MAR
PETM
RL
SUN
WCC

I see that Apple reported stellar earnings after hours today, and yet over $4 billion of its market cap has been taken away in after-hours trading. This is exactly the kind of event a bear wants to see: even good news takes the price down, indicating expectations are far too rosy.

Thursday, October 06, 2005

Boing!

Recently a couple of general "bets" I've made have worked out. Specifically:

+ That crude oil was toppy and about to fall, and thus all these sky-high service stocks (AHC, HP, KMG, etc.) were going to drop hard.

+ The market was, in spite of crude's fall, going to plunge as well.

Today I pretty much covered all my oil shorts at handsome profits. I confess I covered my market shorts somewhat prematurely, but they worked out quite profitably as well.

I want to show you something fascinating - look at this graph of IWM (which is the ETF of the Russell 2000). Notice the lower trendline. It is VERY old (about 3 years) and, as the red square indicates, its price was getting extremely close to touching it today.....


Near the end of the day, the price of IWM did touch this trendline, and just look at the incredible and instant turnaround in the price!


Is that not amazing? Think of it! A trendline spanning three years is so strong that the price is only permitted beneath is for about 90 seconds before whipping around!

Don't get me wrong; I still think the market is doomed. But, for the very short term, I'm long the market. I merely think it's oversold for right now, and I'd like to ride a quick bounce up in the meantime.

Wednesday, October 05, 2005

Those Fabulous Fibonaccis

As happy as I am with the market's plunge recently, I'll just have a short entry today to comment about crude oil.

The graph below shows crude oil (specifically, the December 2005 contract) over the past year. I've drawn a Fibonacci retracement on it. Notice how amazingly it forces support and resistance on the price. I've highlighted areas of particular "bounce".......


I am short quite a few oil service stocks now (which already have shown a nice profit), and this chart indicates that crude oil is going to take a fall more due to the nice head & shoulders pattern. I imagine the next stopping point will be at about the $59 Fibonacci level.

Tuesday, October 04, 2005

Five Reasons This Bear Loves This Market

Today's market action was exactly what a bear likes to see: a rise at the early part of the day, a gradual softening, and then a steady fall until the close. This kind of "gotcha!" to the bulls is psychologically key in pushing a bear market forward.

But my fondness of the current market extends far beyond just today's action. Here are five specific reasons I'm feeling optimistic about the prospects for a continued fall in the stock market:

(a) Crude Oil's Not Helping - a lot of people have blamed the softness in the market on the huge increase in energy prices. If that was true, then today would have been a terrific rally, because oil is falling fast. But this isn't the case. Oil's getting cheaper, but stock prices are still soft.

(b) Huge Bearish Engulfing Pattern - all right, this one was just today - but it's important. Take a look at the graph below. There's a marvelous example of a bearish engulfing pattern (this chart is the MDY). The market opened higher and closed beneath yesterday's open. Very discouraging for the bulls.

(c) Bounce Off Resistance - Take another look at the same graph. See the descending trendline at the top? A series of lower highs and lower lows. And today the price couldn't penetrate this resistance line. Just another affirmation of a top.


(D) Major Trendlines are Broken - On all the indices, multi-year ascending trendlines have been broken to the downside. You can see an example of this in the longer-term MDY chart below (reminder: you can click the image to see a larger version). There is another, lower, trendline that hasn't been broken yet, but I'm confident it will be sometime this month.


(e) Utter Complacency - People still think the bull market is intact. They still think that, at worst, the market will return 5% each year (indeed, this is the 'bad news' that is shared in popular circles.....that modest returns must be accepted instead of 25% annual returns). Here, for instance, are the subject lines over the past several weeks from a major technical analyst - look how, day in and day out, every single subject has a positive spin:


As has been widely reported, September is typically the worst month in the market, and it's somewhat discouraging to me that it was actually an 'up' month. But charts are more important than time-based folklore. Let's see how October turns out.

Tuesday, September 27, 2005

NZD Forex Revisited (Again)

About five weeks ago, I posted about shorting the New Zealand Dollar here.

The timing just was about perfect. The market "topped out" the very next day, sank, recovered some, and then really starting sinking.


So the NZD/USD market moved from about 71 cents to 68 cents. Three pennies. So what, right? Well, the FOREX market is so highly leveraged, that three penny move would have resulted in a three hundred percent return over the course of those five weeks (e.g. a $10,000 account would be worth about $40,000).

What's exciting to me about this graph is how cleanly it played within the Fibonacci retracement. NZD/USD is considered an exotic currency market. But it's a terrific-looking graph. I'd step aside at this point, although long-term I can see this graph heading much lower.

Tuesday, September 20, 2005

Eleven Steps then a Stumble

Finally, some direction! It's about time.

There's an old saying about the market - "three steps and a stumble" - which implies that if the Fed raises rates three times in a row, the market will fall. Well, the Fed has raised rates ELEVEN times in a row, and finally the market looks like it is starting to take notice.

Below are three charts of the largest ETFs - our old favorites SPY, QQQQ, and DIA. Each of them tells a similar story of a slow shift from upward market to downward market.

The first chart of the SPY (the S&P 500 "spiders") shows the ascending trendline which the prices are approaching. This trendline is still a ways away, but if it's cracked, it bodes well for the bears out there (like me).


Next are the "cubes" (QQQQ, the NASDAQ 100 ETF) which have already broken their ascending trendline. This market has never recovered quite as well as the other markets (especially the Mid Caps and the Russell 2000, which hit lifetime highs not long ago). All the same, it's just as vulnerable as everything else. I've drawn the ascending and descending trends to make it more clear. You can see where the ascending channel has been clearly violated.


Finally are the "diamonds" (DIA, the Dow 30 ETFs). As with the SPY, the ascending trendline has yet to be violated. But if it is, bulls need to watch out. The shifting tide continues to work its way in favor of the bears.