
A Century-Long Pattern
The graph above (even if clicked) is too small to do this point justice, but I'll say it anyway.
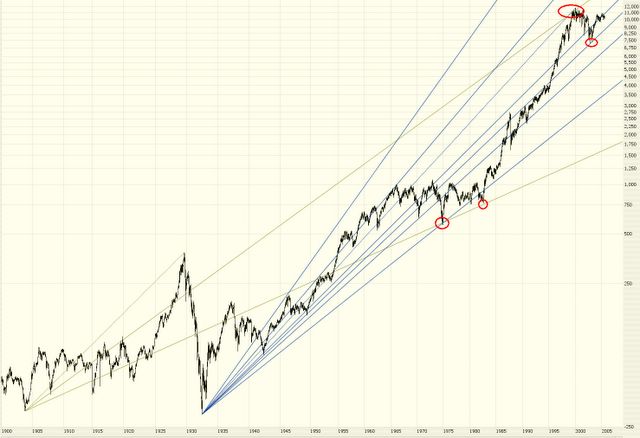
This shows two fibonacci arcs. One of them is drawn from the lowest part of the 1900s (early in the century) up to the "roaring 20s" peak in 1929. The other is drawn from the nadir of the market in 1933 (when the Dow was at 40.60) up to the apex in January 2000 of 11,750, nearly 300 times higher than the value in 1933.
The number of places where the prices "hug" the various fib lines and bounce off of them is almost miraculous to me. There are probably 20 different examples of this. Most astonishing of all is that the lines converge on the peak. Indeed, the 50% fib line from November 1903 almost EXACTLY matches the high set nearly 100 years later!
Breathtaking.
No comments:
Post a Comment