Tuesday, January 31, 2006

GOOG DOOM

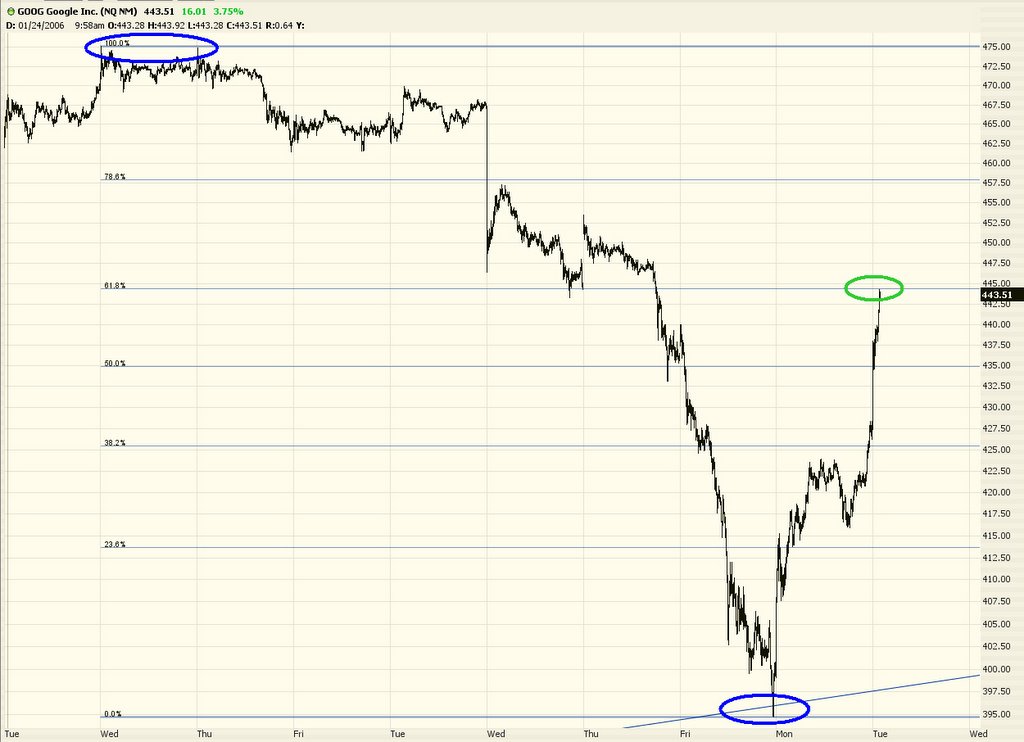
Friends, let's pause and reflect a moment on a recent anonymous post, in response to my brilliant GOOG analysis. He writes:

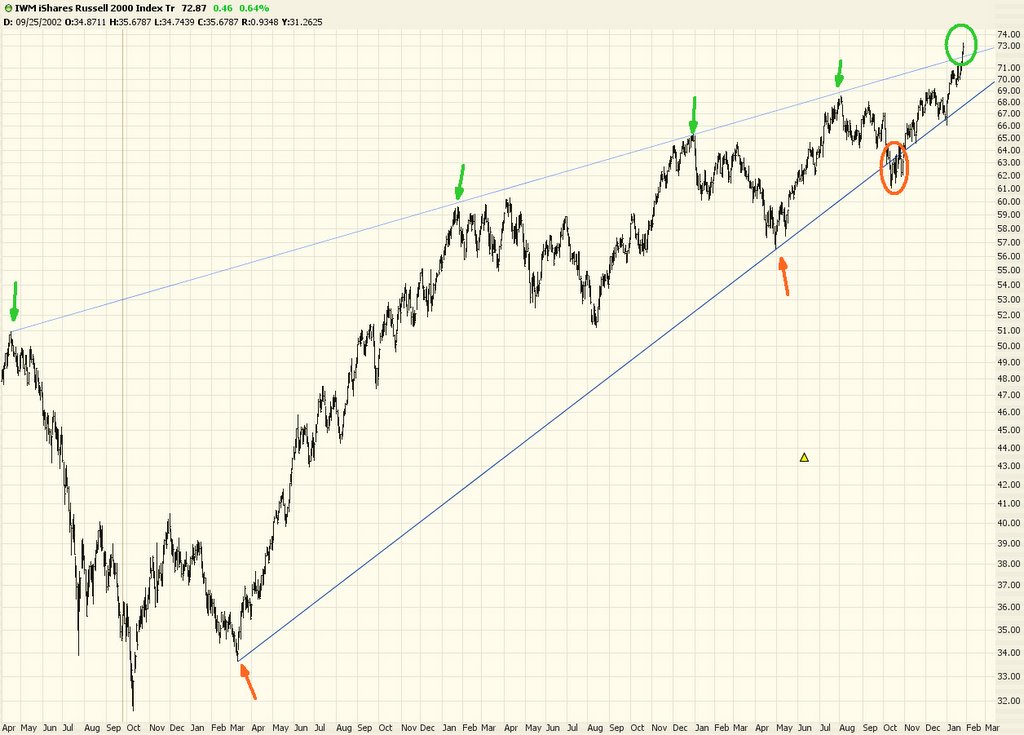
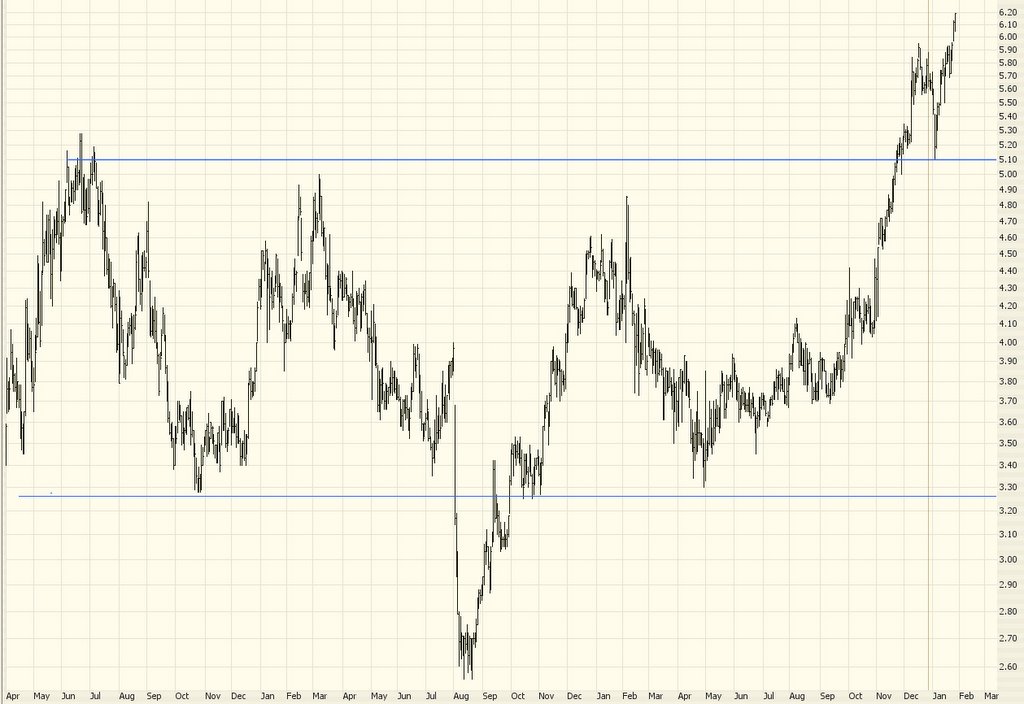
Google is going to rock to all time high very soon. Time to close your put position and buy some call position now if I were you. The stock market is in a super bull mode right now with $rut, $mid, $nya, $tran, $util, $bkx, $xbd, $xoi, $osx all in or near ALL TIME HIGH. Dow, S&P and Nasdaq are near multi-year high. This is no time to be bearish.

Well, you 1999-on-the-brain bullish twit, now that GOOG has reported their earnings, how are they doing? Down about $70 in after-hours trading. That means your call options - of which I hope you owned a boatload - are going to get wiped out. Whereas my puts are going to go up hundreds of percent instantly at the opening bell.

I resolved earlier this year to be a bit less dogmatic with my bearish views. Screw that. Let me lay out The Truth for you.

Bulls brought us Enron. Bulls brought us Excite. And Worldcom. And CMGI. And HealthSouth. And all of the rest of them.

Bulls have a stench of fraud to them. In a market this wildly overvalued, the world is fed to the teeth with these charlatans trying to convince you that stocks are worth anything close to these prices.

Bears, on the other hand, are truth seekers. I offered the truth in my GOOG post. And the truth is out now.

It's going to take some time for the market to get wiped out. Probably years. But when NTRI is at $5 (or 50 cents......) and GOOG is about $20 and the Dow is at 6,000, it might be amusing to reflect back on this blog and see what I was saying back in the day.

And to all you GOOG bears out there - - well-earned congratulations. It's time we finally had our place in the sun after 24 years of bull lies and tyranny. Enjoy the ride down. There's going to be a few pops up now and then to get the bulls excited and provide them fodder to try to defraud the unsuspecting.

But, slowly but surely, this market is going to be utterly laid waste. Trust those noble bears who are seeking the truth. And remember who brought you the bubble of the late 90s.

Friday, January 27, 2006

Bull Run or Bear Trap?

I've been tracking the Russell 2000 ETF (symbol IWM) not only because it is a very broad-based instrument, but also because it's been by far the strongest of any of the index ETFs for the past year. If the IWM really starts to break down, it's a serious bearish signal. So far, this has not happened. On the contrary, the IWM has shown amazing strength and resiliency. Click on the image below to see a larger picture:


As you can see, the index has been creating an ascending wedge. Although it has historically bounced off its support and resistance (indicated by the arrows), it did appear to break beneath support in September, highlighted here with an orange circle. However, this was a false breakout, and it pushed back into its wedge and has been moving up pretty much ever since.

I stated in an earlier post that the IWM was pushing on a resistance level again. As you can see, it has now broken above this level. So the question at this point is whether it, like its cousin in September, is a false breakout, or if it represents a true breakout above the wedge.

We should know in the next couple of weeks. If the price can stay above this trendline, then resistance has changed into support. However, if the price sinks the trendline back into the wedge, this is just as bearish as the push away from the false breakout in September was bullish.

Q up 11% since Last Month's Post

Regular readers of this blog may remember that I pointed out the beautiful head & shoulders pattern on Quest (symbol Q) back on December 8th. Well, the stock has performed very well since then - up 11% since my post. Let's revisit the chart and see how handsomely the price is moving up and away from its breakout:


I'll also mention (hat in hand....) that NTRI has gone to a new all-time high, rendering my recent suggestion of it as a short moot. As I mentioned in that post, any price above $46 should be taken as a stop-loss, which it has by now. It seems a very bullish analyst report has pushed the stock skyward. It's still below its ascending trendline, but the cold fact is that it's not breaking down at this time.

Wednesday, January 25, 2006

Decision Point

Tonight's post will be short and chartless.

Even though the Dow was only down 2 points today, it was my best day in a long time. I'm very short oil service stocks, as well as a hodgepodge of other items (like GOOG, down over 10 points today). Many indexes had a "spinning top" formation, which indicates that tomorrow (Thursday) is a pretty important short term direction-setter.

It sounds glib to say, but tomorrow's market will either be up or down. In other words, the market will either shake off the recent downward movement and move decisively upward. Or it'll continue to soften (which is what I'm inclined to believe) and regain its downward momentum. It's not going to continue to flatline.

Below are some indexes with some recent lows. If and when it takes these out tomorrow (or anytime soon), it'll add to the likelihood of more bears joining the ranks.

$INDU 10,661
$COMP 3,663
$TRAN 4,059 (this index has been very strong but looks super toppy)
$XMI 1,072
$COMPQ 2,241
$NDX 1,633
$OEX 569
$SPX 1,245

Tuesday, January 24, 2006

Is Google Going Soft?

I have something amazing to show you.

Google's lowest price ever was on the day of its IPO. Its highest price ever was recently, on January 11th.

I drew a Fibonacci retracement from the lowest low to the highest high. The first retracement level indicated a price of $394.74.

During last week's fall, Google got hit hard. How hard did it fall? What's the lowest price that it reached? The answer: $393.97. Do you know how close that is to the predicted retracement? One TENTH of one percent! Incredible!


Taking this a step further, this morning I saw Google was strong. It bounced up quite a bit yesterday, and it was headed north again today. I was interested in going short this stock (buying puts, actually). I wanted to get in at a good price. So I drew another retracement on a much shorter time horizon, as shown below. As you can see, the price got right up to the retracement level and then softened up.


Now, there's no guarantee of course that the price will plummet. But at least I have a nice clean stop-loss point (the same retracement level).

Although I'm a strict technician, I will say one thing about Google....they seem to be slipping. Don't get me wrong; I think the company is amazing. They're obviously one of the greatest business successes in human history, and their search page is my home page. Google Maps can't be touched. Almost everything they've done is the best in its class.

But their most recent offers.....and I'm thinking of their video search and their blog search.....leave a lot to be desired, in my opinion. I was kind of flabbergasted that Google would have put these things out there. I'm not alone in that. I've heard a lot of disappointment about their video offering.

This has nothing to do with technical analysis. But I'm just wondering if a company with this much of a Midas touch might already be past its prime. Food for thought.

Monday, January 23, 2006

NTRI Follow-Up and MTH

Today was a relatively quiet day in the market, which isn't surprising considering the sell-off last week. I see the major media wasted no time in declaring that, since the market was actually up 21 points today, we were "Back to Bullness" (that's the top headline at MarketWatch). I'd suggest a different eight-character word beginning with "Bull", but I don't have any sway at CBS.

I wanted to follow up on a short suggestion I made on January 12 regarding NutriSystem (NTRI). Well, so far, so good. Indeed, unless the stock blasts back above $46 unexpectedly, I nailed this thing 100% on the dot. Take a look:


I have another short recommendation for your consideration - Meritage Homes (symbol MTH). This stock has already fallen a long way - about 40% since August of 2005. But it has formed a gigantic, textbook-perfect head & shoulders formation. Should it break the neckline at $57, traditional measurements in technical analysis target a descent to $17.50 (!). Here's a close-up of the chart:


I received a ton of emails and comments on Friday about my "Victory for the Bears" posting. Many questions, too, were sent along. I'll try to answer these in the coming days. Thanks for your attention!

Friday, January 20, 2006

Victory for the Bears

I've been accused of wanting to be right in this blog. Well, I confess it. I'm opinionated, and I want to be right. Take a look at my blog's archive and then the market and you'll see some encouraging signs that I'm not too far off the mark. This market is going to belong to the bears for a long time. You "GOOG @ $1,000" freaks will need to seek greener pastures.

The bulls got kicked in the head again today, and although there will be plenty of jiggles up and down along the way, I believe this is just the beginning. The joke of Dow 11,000 is past us now, and we can consider more important matters, such as Dow 7,000.

I predicted nine days ago that the market as measured by the broad Russell 2000 index was nearing the very top of its resistance trendline. It touched this line first thing this morning and never looked back. Here's where we are at now (as always, click on the image to see a much bigger picture, then click your browser's Back button to return to this posting):


If you ever need proof of the power of leverage, just take a look at the chart below of Google puts. One class of these puts went up 9,900 percent today alone! Now this is obviously an extreme case. Stocks don't typically lose 40 points in the span of one day, and we're talking about an option that only had a few hours left to live. All the same, it's an incredible chart!


Some of you have written to ask specifically what my short positions are. At the moment, they are as follows.......


As we end this week, the year 2006 is already a loser. All of the early gains have been wiped out. There's no doubt that bulls in the long run make a lot more money than bears. After all, the most a bear will ever make on an equity position is 100%, whereas there's no limit to what a bull can make. But in a market like this, I'd advise you to brush up on your short-selling skills.

Thursday, January 19, 2006

Trendline Magic

Just a quick posting today. I've remarked many times about how almost magical trendlines can be. Particularly how, even on a steeply-angled trendline, support can change into resistance. It's as if the price is magnetically drawn to the line, but stays rigidly on one side or another.

Even unusual instruments seem to have this property - check out this mutual fund, symbol USPIX, which is a double-inverse bear fund from ProFunds (in other words, if the S&P 500 goes down 1% on a given day, this fund goes up 2%). Notice how this security's trendline changed from resistance to support.

Wednesday, January 18, 2006

Notice a Pattern Here?

Yesterday, earnings started to flow in.

Intel disappointed. The stock got killed, erasing $16 billion in market cap.

Yahoo disappointed. The stock also got killed with a double-digit percentage loss, just like Intel.

Perhaps the bulls think this was a one-day wonder. A temporary dip, representing a buying opportunity on their way to Dow 36,000. Twits.

Well, more earnings are out now. Ebay. The stock's getting pummelled. Apple (everyone's darling). It's down nearly 7%, and after-hours trading has just started.

Could there be a pattern here? Perhaps the incredibly inflated market, which is priced for perfection, is starting to show its true colors?

There's an interesting three-part series written by a gent at TheStreet.com I think you might enjoy. He's predicting the Dow will fall to 6,800 within this year. It's called Cult of the Bear. Enjoy!

Part 1
Part 2
Part 3

Tokyo Halts Trading

Reality seems to be appearing finally in these frothy, wildly overvalued markets. The Nikkei had to shut down early due to overwhelming selling pressure. The GLOBEX is limit-down on the S&P and NASDAQ futures (I am typing this at 2 in the morning, so the market doesn't open for over 4 hours).

Quite a difference in the headlines this morning versus the absurd obsession from just a week ago.

Tuesday, January 17, 2006

Looking Good, Bears!

Well, the "one hit wonder" of Dow 11k continues to fade into memory. The Dow lost another 61 points today. Better yet, earnings season is here, and IBM, Yahoo, and Intel just reported.....and it's not looking so good for the bulls tomorrow morning!

Earnings were reported just minutes ago, but Intel has already lost over 7% of its value whereas Yahoo has lost over 11% of its value! Here's a piece of the after-hours data:


For myself, I'm going to simply stay the course - all twelve short positions I have already have nice profits, and I'm only expecting those to grow. My NTRI recommendation has inched down since I made it last week, and I'm expecting great things from this position.

Thursday, January 12, 2006

Dow 11k, We Hardly Knew Ye

Well, the Dow's triumphant mounting of the 11k level has come and gone. Three days of glory in the sun, and now we're back into the 10s. C'est la vie.

Here's a six month candlestick chart of the $INDU to put this into perspective:


I'd like to offer a pretty interesting short candidate - NutriSystem (NTRI). This was, I believe, the top percentage performer of 2005, and it's at an all-time high right now.

What's interesting to me about this graph is that NTRI broke its ascending trendline and now it's just kissing the underside of it. To me this implies strong resistance, and now is just about the ideal time to short this, because if you're wrong (e.g. the stock moves on to new highs), you'll know almost immediately!


The stock topped out Wednesday at 45.65, so I'd say $46 is probably a pretty good stop-loss point. Good luck!

Wednesday, January 11, 2006

Pushing at the Top of Resistance

A picture's worth a thousand words - so I offer you TWO thousand words today. The charts speak for themselves. Here is the S&P MidCap 400:


.....and the Russell 2000......


Notice in particular the progressive breakouts in the Russell 2000, and how each one is shorter-lived and weaker than the prior one. These breakouts are indicated by the horizontal lines you see drawn four times on the graph.

Tuesday, January 10, 2006

If You Like a Good Scare

Yesterday I read a fascinating article about a multi-billionaire investor whose latest investment "theme" is that the world is going to run out of oil. Check out this favorite web site of his to read this fascinating point of view.

Monday, January 09, 2006

Dow 11,000: BFD

Well, the Dow finally crossed 11,000. Big deal.

The amount of ink being spilled on this non-event is incredible. Looking at the Fox News website this evening, it is the top news story. As if there's nothing going on in the entire world that could be more significant. Astounding....


I realize I should be having a big helping of humble pie a la mode right now based on the market's rise, but as I look through my charts, I am more convinced than ever that this little fresh-new-year rally is just an short-term blip.

And just to show I'm not making this up as I go along, step back with me to the blog I posted a month ago where I made an assertion that the "breakout" would be a wimpy one. My exact words were, The breakout (if we agree to call it such) just took place on December 1st. If past patterns are any guide, if the breakout holds, the rise we may see is a relatively wimpy 2.44%.

The breakout I described is still very much in place. The closing price on "breakout day" was 690.21 for the Russell 2000 (the index in question). A 2.44% gain would push that to 707.05. Today was the highest level the Russell 2000 has reached so far. What did it close at today? 706.24. So it seems we're pretty close to the top of this rally, based on my estimates from over a month ago.

Let's take a look at the index chart itself (reminder - click the graph to see a bigger version):

Friday, January 06, 2006

The Bulls Break Out

Well, there's no arguing with prices, and the market pushed through across the board to new highs.

Some of the ETFs - like the MDY - reached never-before-seen highs. Others, such as the QQQQ, reached multi-year highs. Gainers trumped losers by about 2-to-1, and there is a very bullish tone to the market in general.

Let's take a look, for instance, at the big breakout QQQQ had recently. Notice the former resistance line and how powerfully the QQQQs have burst through it (the arrow indicates the year-end pullback, which was a bear trap, and the subsequent rise in the market).


Now before we get totally carried away, let's take a look at a graph which you'll have to admit looks awfully similar. It's also the QQQQ, and a virtually identical breakout is shown. (This happens to be from a year ago).


But look at what happened next (I've left the rectangle drawn so you can see the relative point of reference).


As you can see, the breakout didn't have a follow-through.

What's going to happen this time? Will the markets continue to surge upward? Or will the magical Dow 11,000 number be crossed only to be crossed back on the downside once more? I have no real way of knowing. At this point, the markets are clearly pointing skyward. Whether it can be sustained or not will be revealed over the balance of the month.

I will offer some evidence of froth, however. Google - which continues to blast upward - keeps drawing higher and higher target prices from analysts. Remember back in the late 90s how Qualcomm, which peaked at about $100, fetched an analyst target of $1,000? That's often held us as an example of how bonkers everyone went during the bubble. Today a report came out suggesting a Google price of $2,000. And - amazingly - the report stated how it was "different this time" (compared with the bubble). People never learn, I guess! Anyway, if you're interested, the article is here.

Wednesday, January 04, 2006

A New Trading Year Begins

Happy New Year to one and all. My new year's resolution for this blog is to be not quite so dogmatic with my bearish views. After all, my role here is to be as objective as possible - - - not proselytize! So having said that, let's take a look at what the markets are doing.

The story is pretty much the same across all the major markets: for about six weeks, from October 11th through November 29th, the markets were strong. For the whole of December, the markets generally had a stair-step pattern downward. Nothing dramatic, but definitely a series of lower highs and lower lows.

With the first two trading days of the year behind us, the market has shown strength, ostensibly due to some clarity from the Fed that they won't keep cranking interest rates up forever. And January, being the strongest trading month of the year historically, has a lot of favorable bias to it.

Let's look at the three biggest ETFs - DIA, QQQQ, and SPY (respectively, the Dow 30, NASDAQ 100, and the S&P 500 ETFs). I've pointed out the "high water mark" for each of these. Simply stated, the prices must exceed these prior levels for the market to show continued strength. Otherwise, we're just looking at a start-of-the-year anomoly and little else. Here, then, is the DIA.....


The QQQQ.......


And, finally, the SPY (remember, you can click on any image to see a bigger version)....


I'd also like to point out an example of a stock in a nicely-shaped inverted head & shoulders pattern, which is typically seen as bullish. The symbol is ASYT. Below I've drawn the two shoulders and the head, and I've shown the neckline above which the price has already broken. As you can see, the price fell back to touch the neckline and is starting to move upward again. I've marked the target price for this stock - about $7.50 according to traditional measurement techniques.