Tuesday, October 31, 2006

Trick......or Treat?

What a roller coaster of a day. I thought we bears were going to get a real treat (Dow was down over 50 points) but it turned out to be more of a trick (market went positive before the close, and finally settled down only 11 points). Here's a line chart of the action over the past few days on the Dow. Totally direction-free. What a mess.


I continue to tout the Russell 2000 as a good place to own puts if you think the market is going to fall. It's got a super-clean stop price too. Puts on this aren't heavily traded, but the bid/ask spread isn't too godawful.


The Transports are looking ready to begin a fresh descent. I like this progression of lower lows and lower highs. A clear tumble here would spook all the Dow Theorists pretty badly.


Bear Stearns (BSC) isn't in any textbook bearish pattern, but the puts on these will have a lot of juice if the steam ever starts to come out of this stock. It is high enough to make this a relatively low-risk/high reward trade.


A more conservative trade would be along the lines of Cigna (CI). I would buy puts many months in the future on this one, since a gigantic insurance stock isn't going to be horribly volatile.


Earnings season isn't providing the kind of clarity/direction I was hoping. Bulls and bears are both losing their minds in this market. So we wait.

Monday, October 30, 2006

Tasty Shorts

The market didn't do too much of anything today. Oil (and therefore OIH) softened up a tad, which is consistent with my speculation that the energy market is going to resume its downward movement. Gold, in spite of the metal's rise in price, softened too on the $XAU. The Dow just lost a handful of points. At least we didn't have some big 'recovery' day after Friday's nice drop.

I just wanted to share a few charts on which I own puts right now. Here's AMG. This pattern is basically in a "post-broken trendline" situation, which is a favorite of mine. The general uptrend has been clearly broken, and the stock has recovered partly or fully to the underside of the trendline. These often represent low risk/high reward trades. Let's call this kind of pattern PBT for the sake of today's entry.


LEN is just a nice topping formation:


NDAQ looks pooped:


TXT is another "PBT":


I've mentioned MRO a few times already:


Altria (MO), yet another "PBT", which seems kind of common these days:


The VIX went up some time, which is also consistent with my view that we've bottomed out on volatility and complacency. The market misbehaved badly in September and October (typically bearish months, yet the market went up) so let's hope the typically bullish months of November and December likewise confuse everyone! We bears could use a break. A sustained break.

Friday, October 27, 2006

A Momentary Dose of Reason

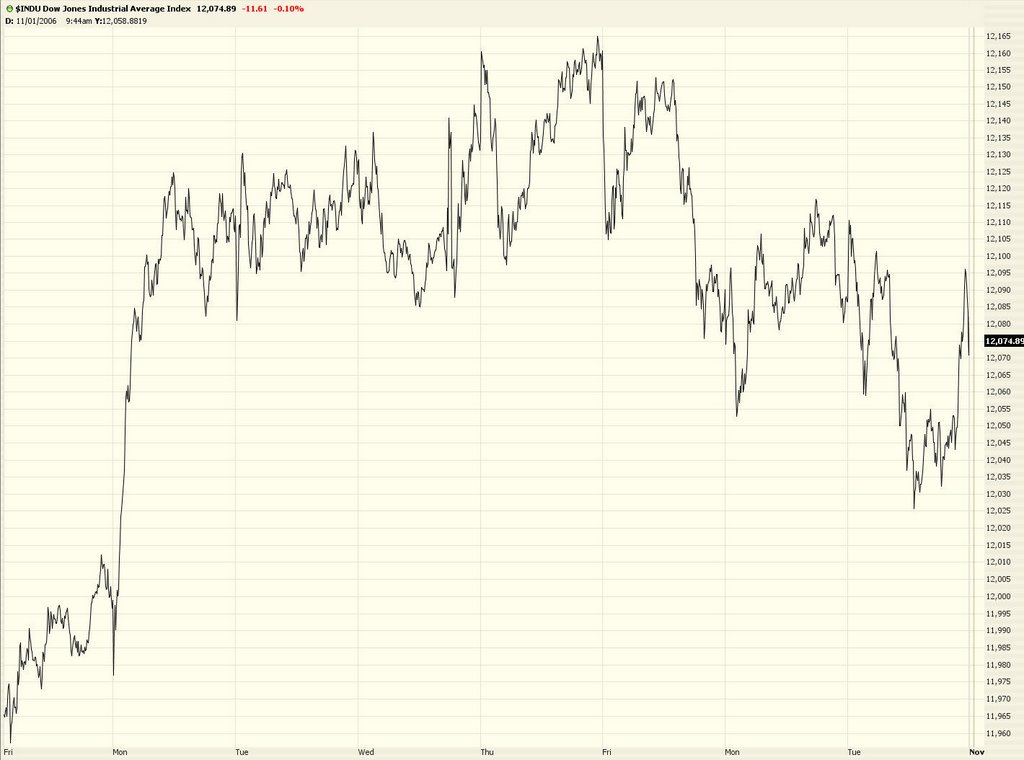
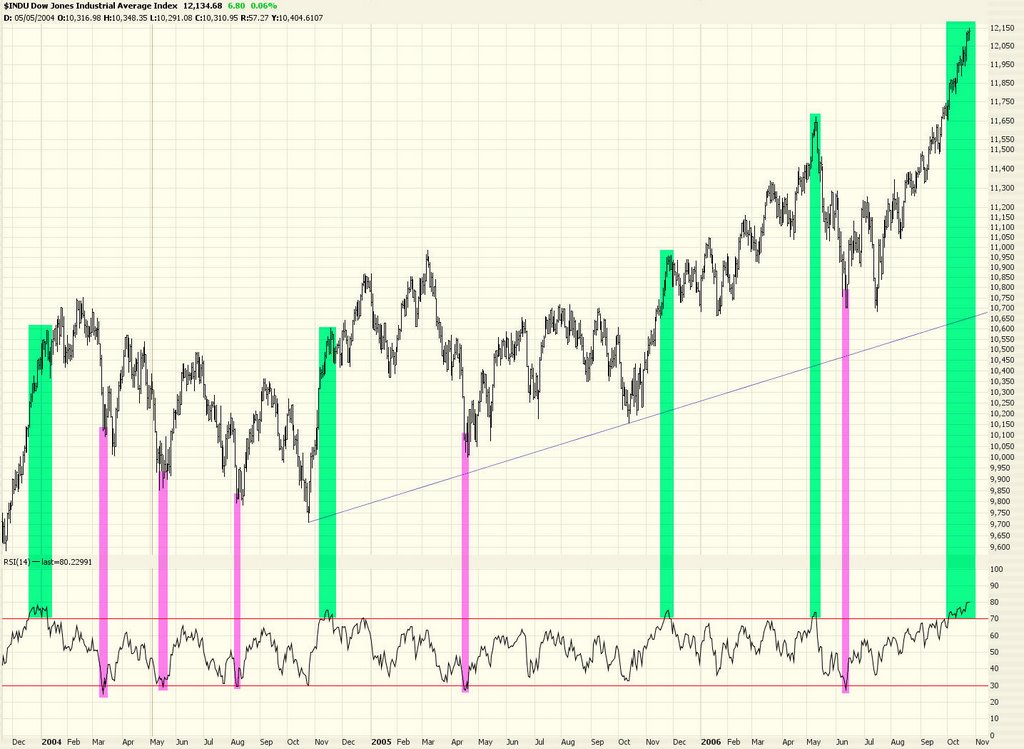
Keee-Rist. It's about flippin' time. The Dow fell 73 points today, after going up for the past 1,342 days in a row. Earlier in the day it looked like another "drop and pop" session where we'd have another new high. Not this time. Some people with triple-digit IQs are actually getting a tiny bit of press and a few people are paying attention. Of course, any fall in the market which doesn't last for months on end will simply be labeled profit-taking.

If the market does ever get around to being sensible and falling for a while, one juicy thing for us put-owners is that the intrinsic value and the volatility premium will go up. The $VIX is at nearly the lowest level in human history. Just look at how much higher it was in June (ahhhhh, now those were good times).


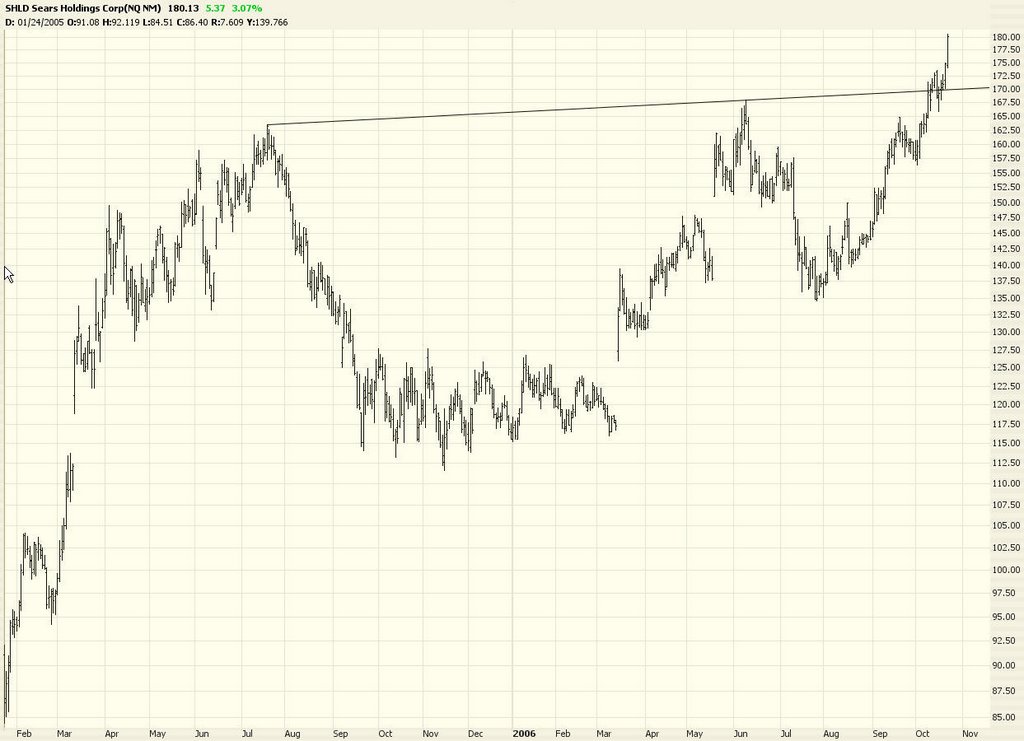
We're just going to look at some indexes today. You guys have seen enough stock charts.

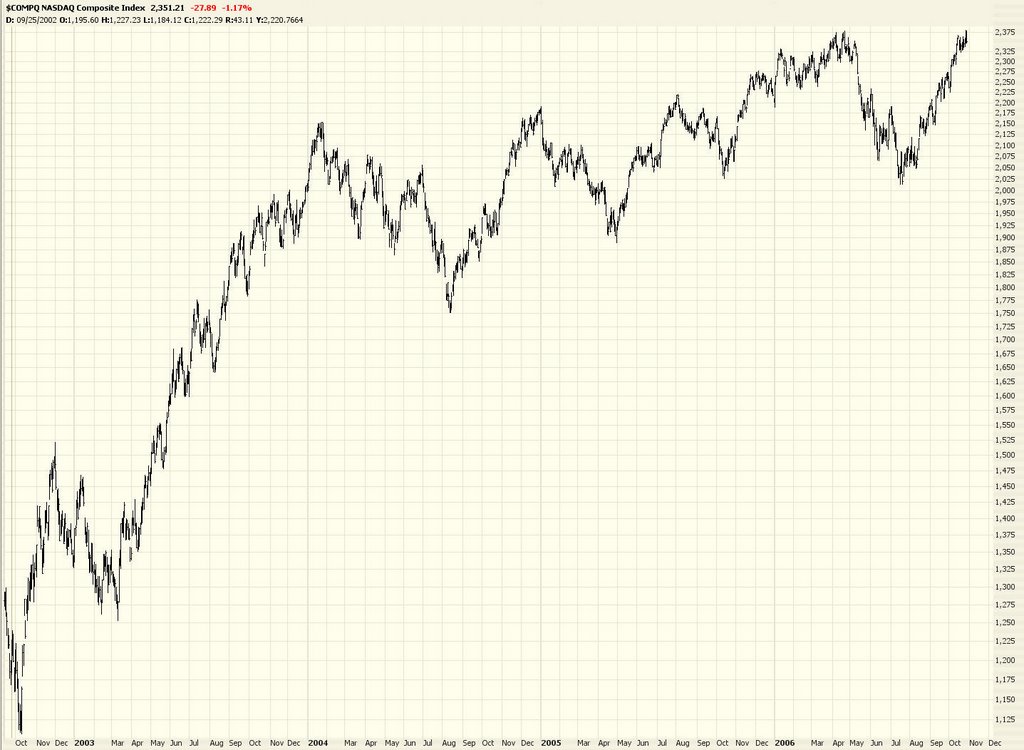
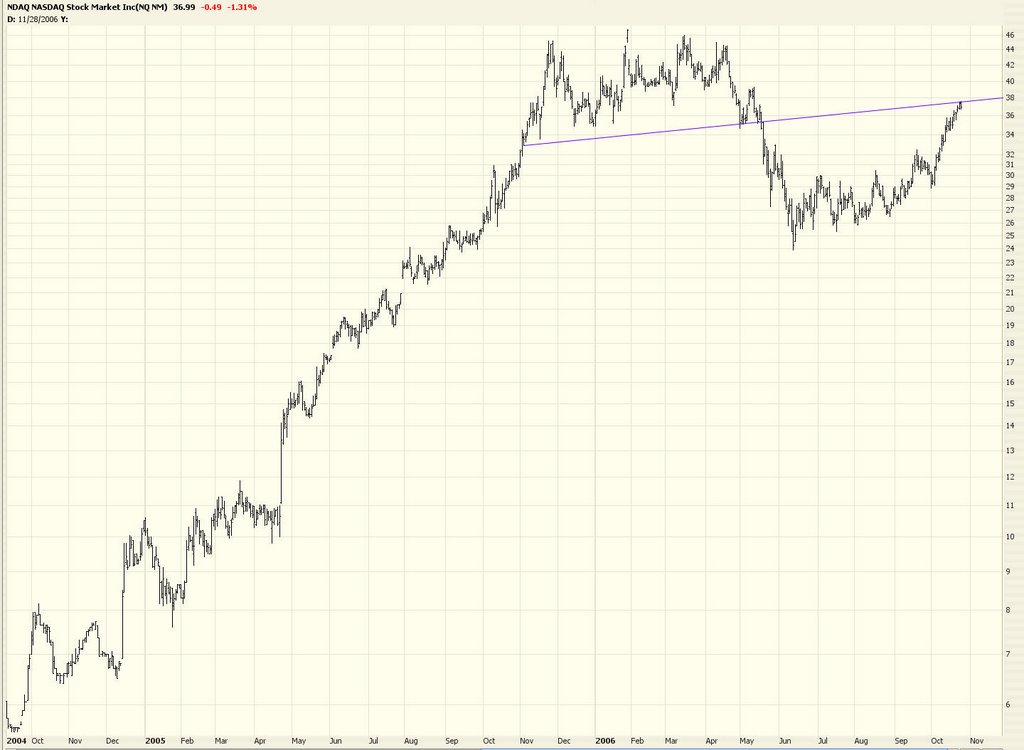
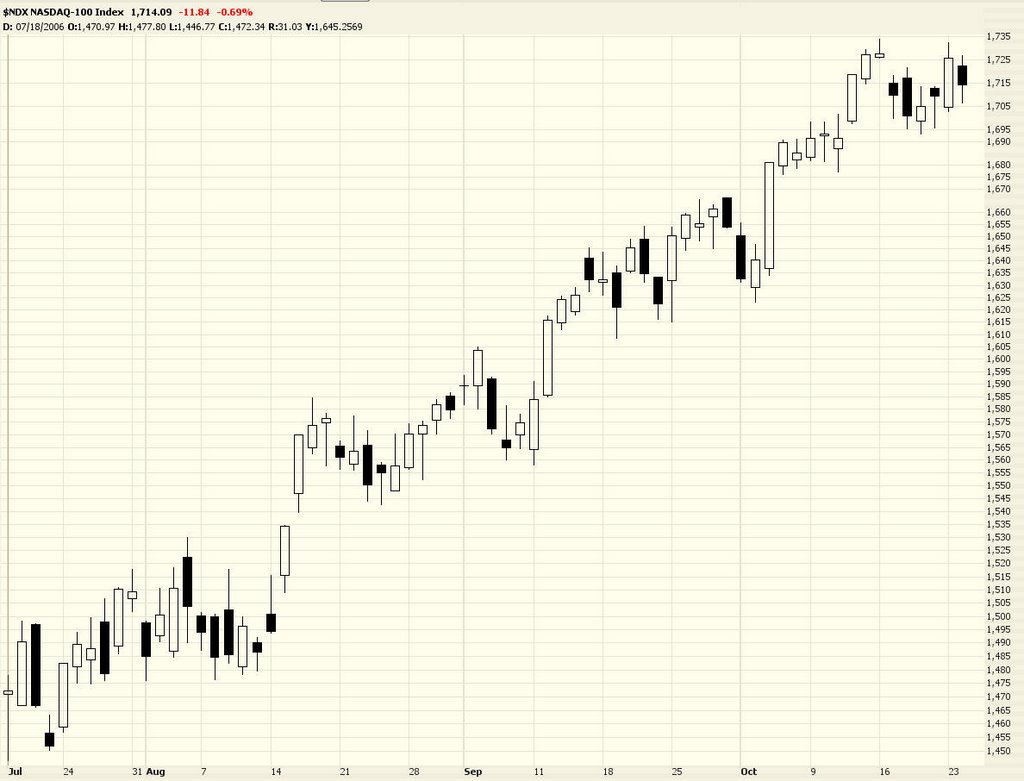
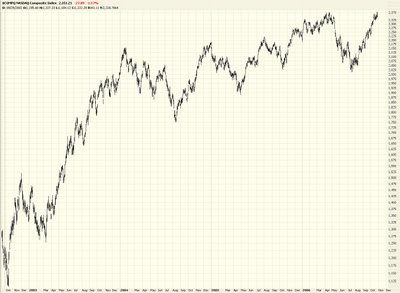
The NASDAQ hasn't been as lusty as the big caps lately. Here's the NASDAQ Composite. It's not in any clear technical formation per se. But at least any short position would be stopped out promptly, since we're so near multi-year highs. In other words, the "I must be wrong for now" levels are not far away, so the risk is pretty low.


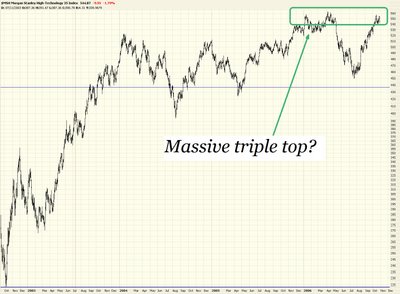
The Morgan Stanley Tech Index (which I affectionally call "mush" based on its $MSH symbol) has thinly-traded puts. Indeed, I am the open interest on the options strike that I own. Considering the massive amount of overhead resistance, this could be a fantastic triple top.


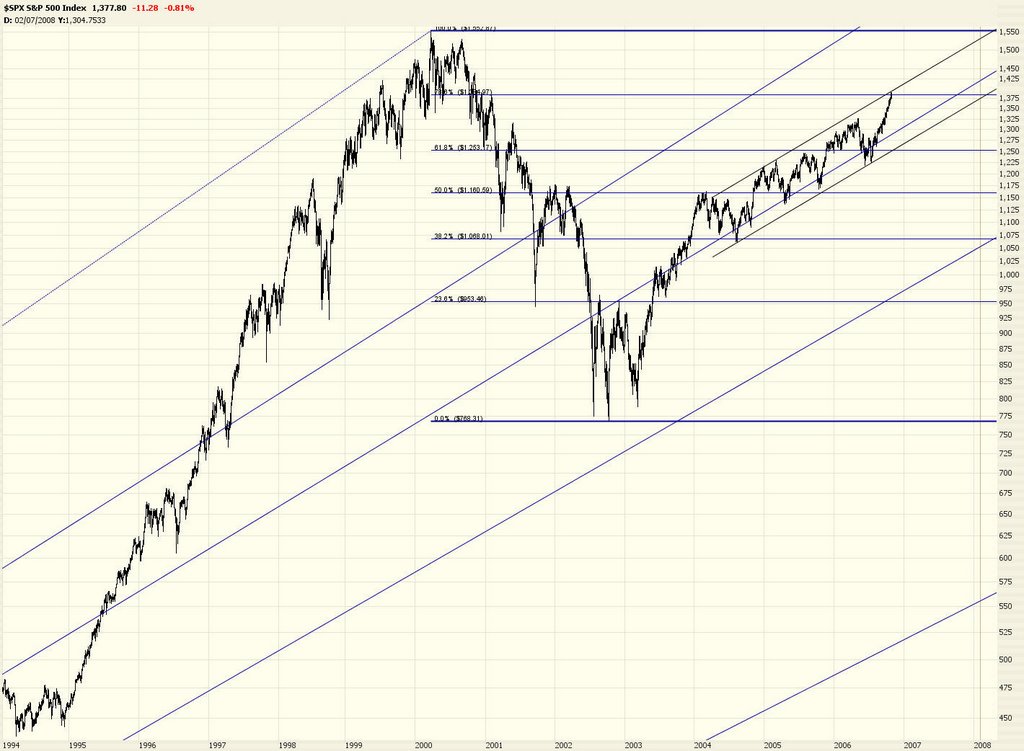
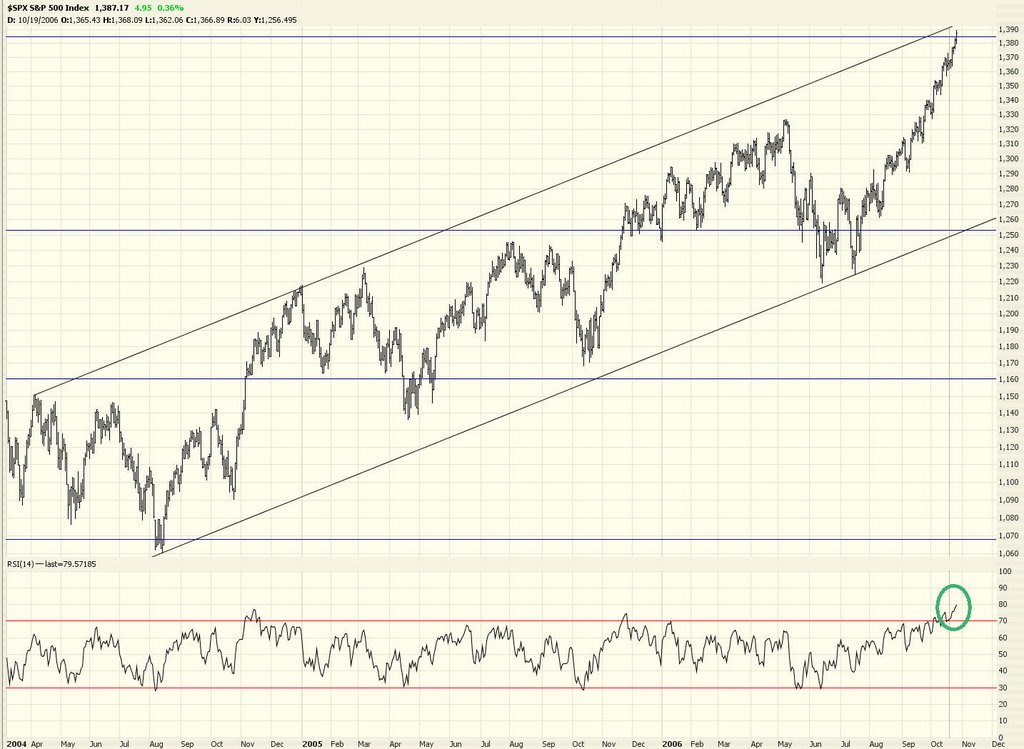
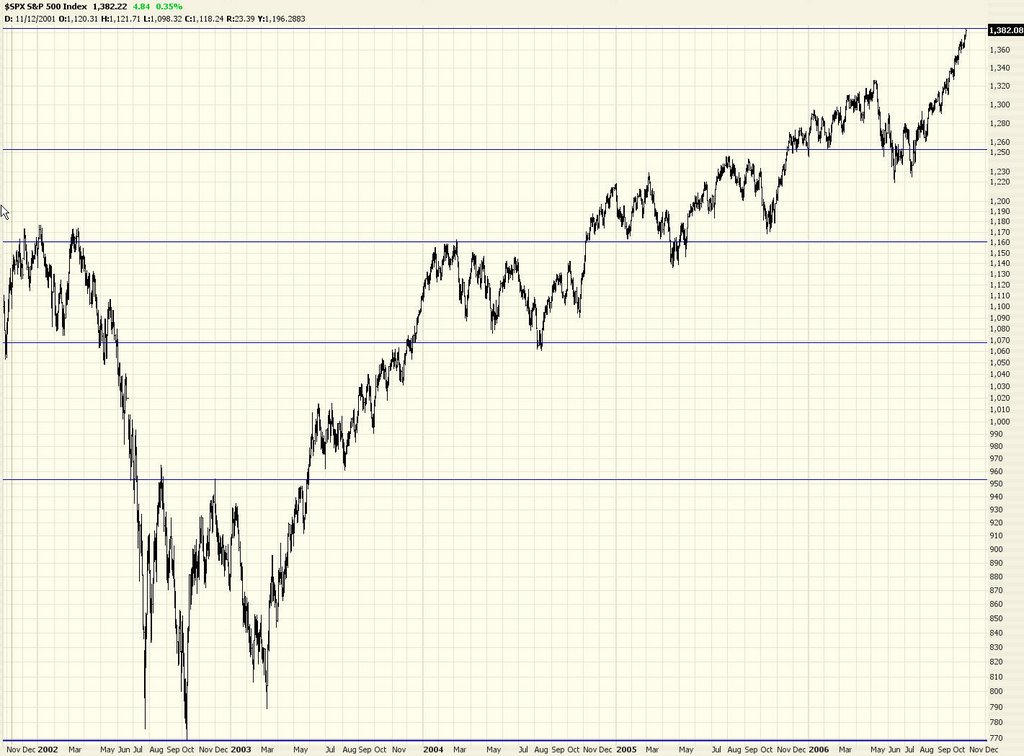
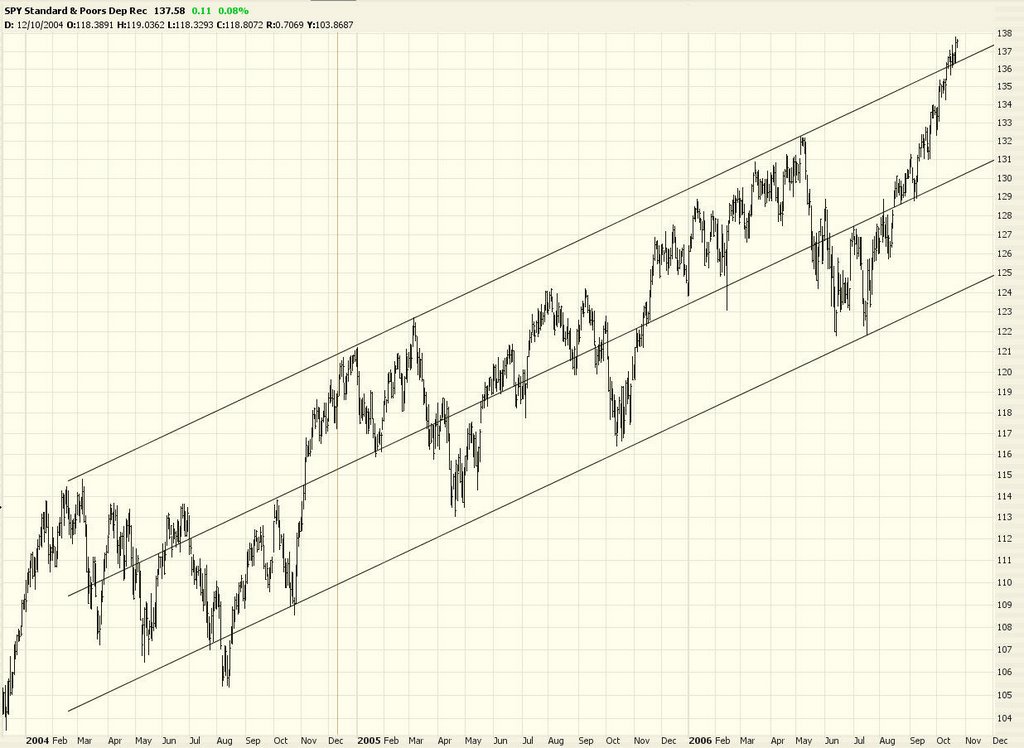
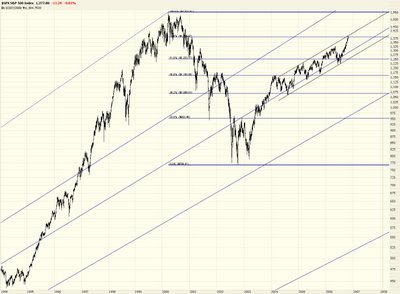
Here's a somewhat long view on the S&P 500. Those diagonal lines you see are Fib Fans. Back in mid-July, when I said we had bottomed out, I wish I had the foresight to look ahead to just how far we would have climbed. I'm afraid the bearish goggles I was wearing didn't let me do that. But I haven't changed any of these studies. They clearly permitted the index to push its way this high. But it makes sense that it's reversing at this point. There's a ton of reasons for it to turn now.


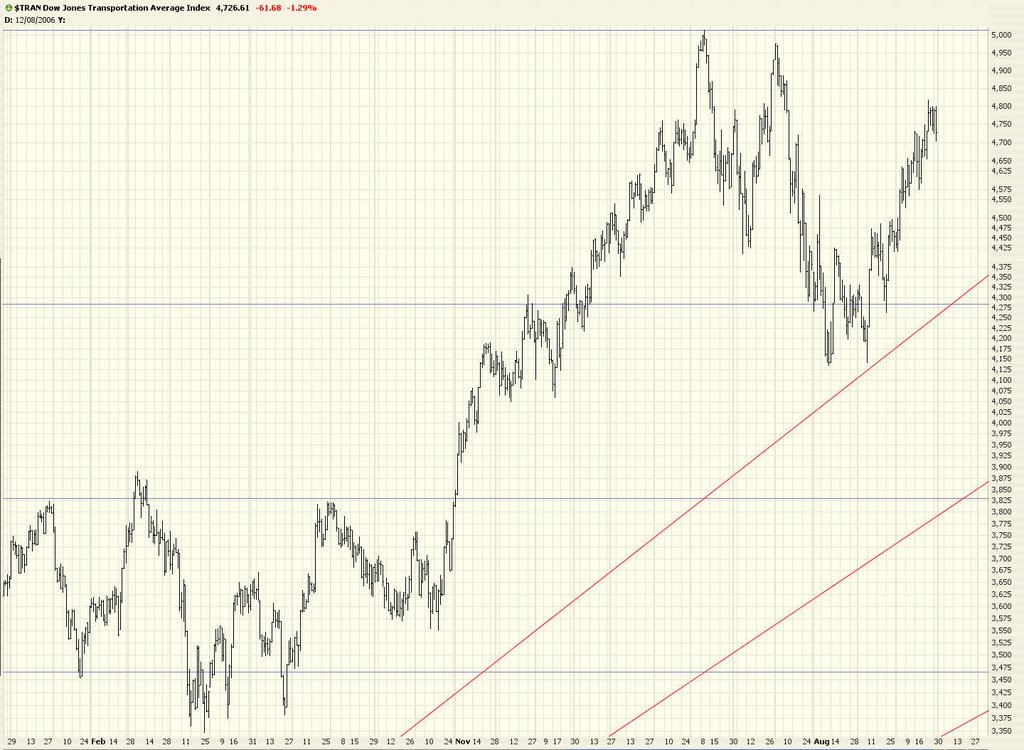
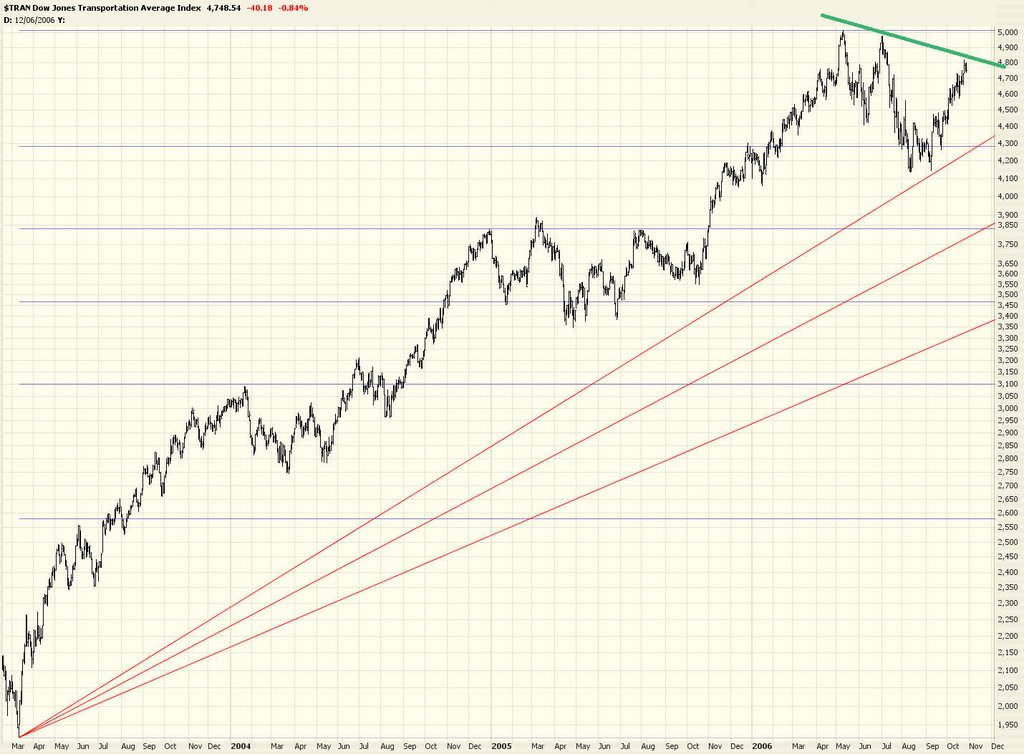
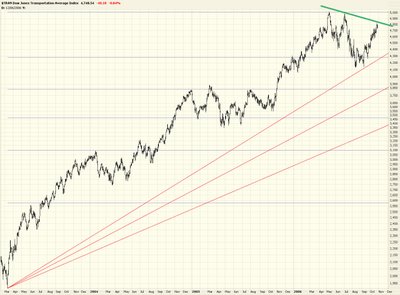
The Transports have not been confirming the Dow Industrial highs. This shows a clean progression of lower highs. Not good for the bulls out there.


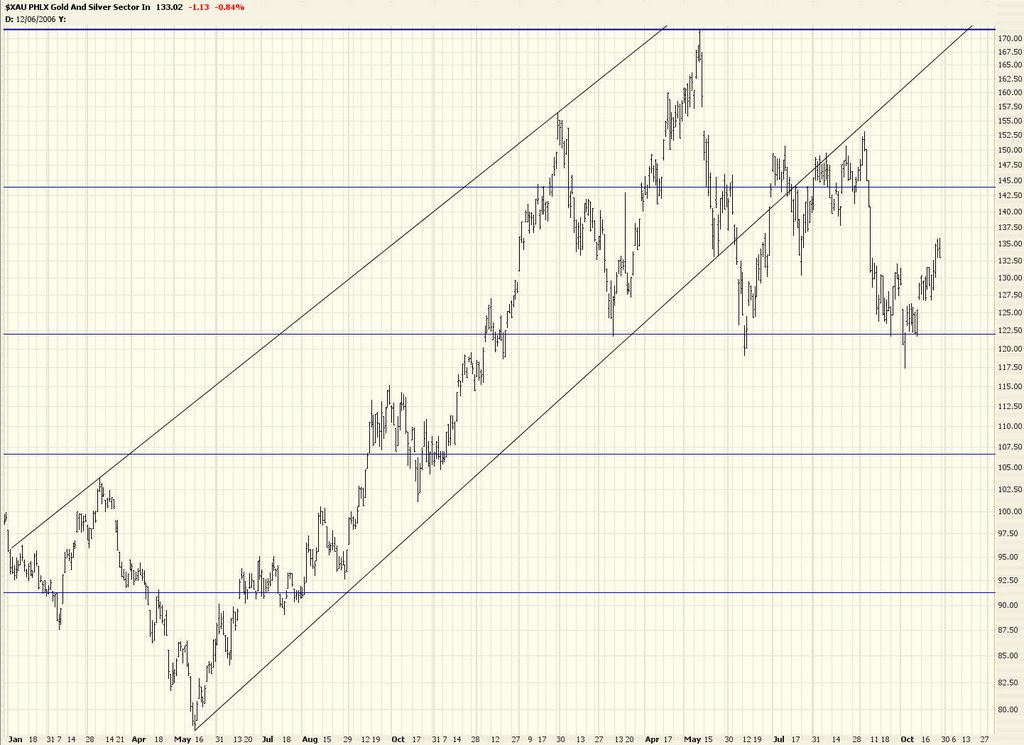
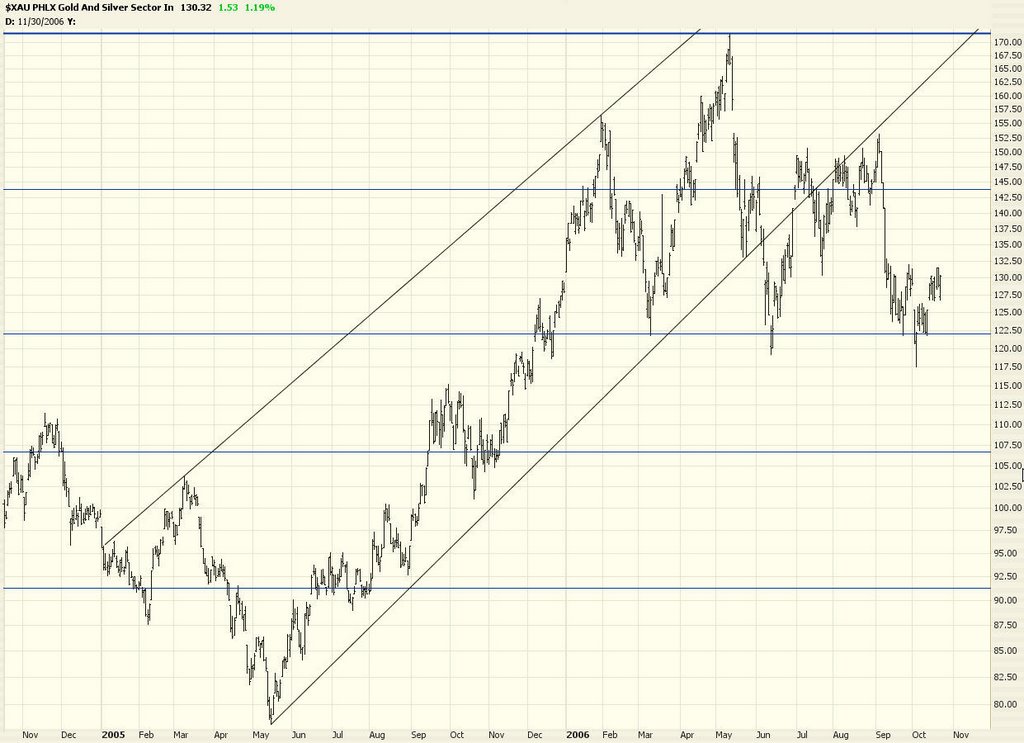
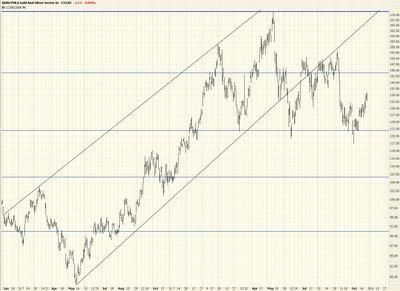
The Gold & Silver index ($XAU) could go either way. I bought puts on this today, but I've got a really tight stop at about the $141 level. This isn't a head and shoulders anymore. But it could still blow through that lower resistance level to the next line down.


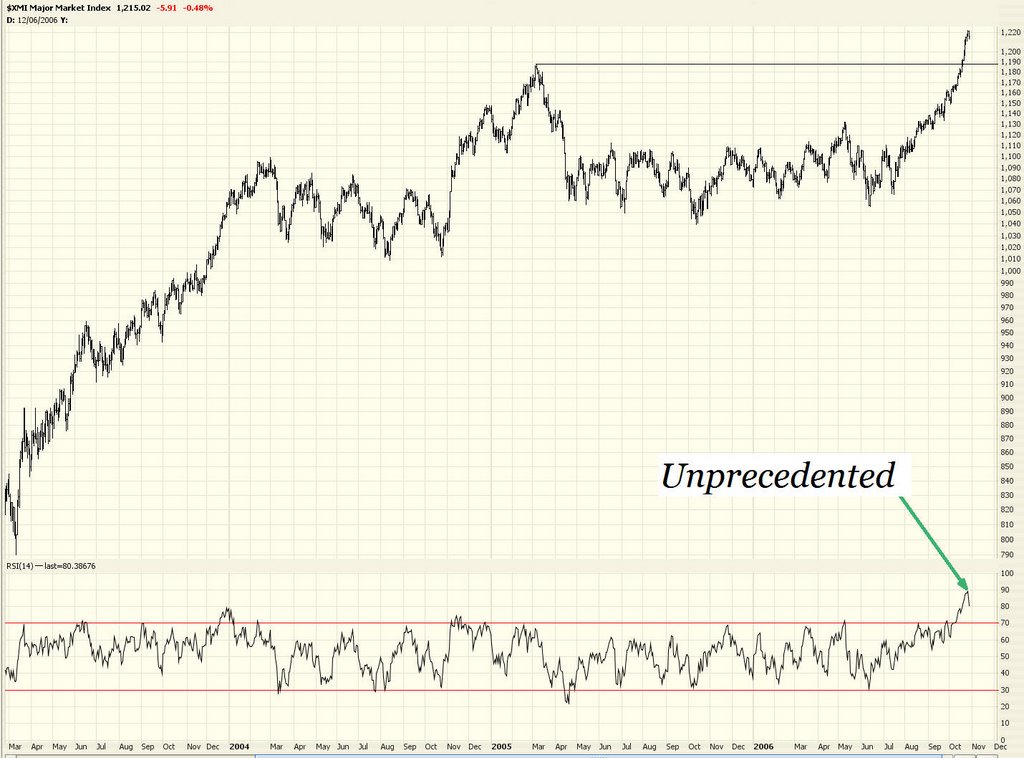
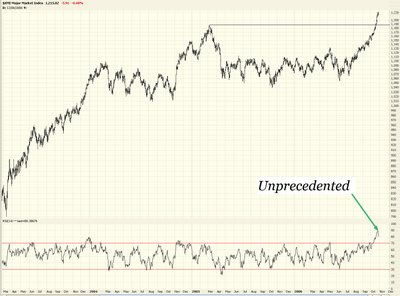
Check out the ungodly high RSI on the $XMI. Total nosebleed territory.


I really hope next week brings us more of today (and less of the prior four days). The economy is weakening. That's not speculation - that's a known fact. The housing bubble is shrinking. I think a comment I saw on this blog Wednesday represents the bullish mentality: "Forget about nuclear weapons and all the other turmoil for now and just enjoy the ride upward." That's crazy. My view is that the market is going to get crushed, and I want to make a fortune in the process of watching everybody else lose theirs.

Thursday, October 26, 2006

Cut and Paste

I'm starting to think I should just cut and paste a generic blog entry each day: "The economy is on a precipice. The housing market is failing. Stocks are insanely overvalued. And a new high was reached today." It would save me plenty of time and effort.

Today it was reported that houses suffered the biggest year-over-year fall in over three decades. My local market (the crazy SF Bay Area) is looking like this lately:


So how did the market react to the news that the principal asset of every American is collapsing in value? It spiked to a new high! Of course! Here's the S&P 500 with the RSI indicator. The index is at the top of a channel and the RSI is in nosebleed territory.


I have no position in Red Hat, but this is an amazing stock. Below is the entire history. You can see broad trends of higher highs/higher lows and lower highs/lower lows over the course of its history. I guess the news that Oracle is going to provide support to Red Hat users at a deep discount tossed a nuclear missile at this stock (which had amazingly high volume - something like over 80 million shares).


Now here's a chart I simply cannot figure out. It's symbol IYR, which is an ETF for real estate in the U.S. This chart just goes up and up and up. Even on a day like today. Clearly this has nothing to do with domestic housing (I suppose). I would think that the shrinking of the housing bubble would be causing damage here. Not in this market.......


Perversely, in this bearish blog, my "long" suggestions are doing great. Once again, the hotties are Redback Networks (RBAK):


Sears Holding (SHLD):


and Immucor (BLUD):


I am having absolutely no fun in this market at all. You can tell by my posts. I hate not understanding a market, and I absolutely do not understand this one. Not a great thing for me to say in my own blog, but that's the truth.

Wednesday, October 25, 2006

Perpetual Motion Machine

I won't bore you. Same old story. New high. Relentless bulls. Bears being turned into hamburger. Not good.

I noticed early on Wednesday that the S&P was approaching its 78.6% Fibonacci retracement (as measured from the peak in January 2000 to the trough in October 2002). It doesn't necessarily represent a brick wall. There have been times that the index has blasted right through it. However, there does tend to be some gravitational pull near these retracement levels. Examine how it's behaved in the past.


Some readers have noticed how ungodly high the RSI has become on the market. They're right. Take a look at the Dow 30 over the past few years. I've highlighted in green the places where the RSI has gone over 70 (it's in the unprecedented 80+ vicinity right now). I've highlighted in pink the places where it's gone below 30. Interesting just how long we've been above the 70 level this time.


Here's a long (yep, long) idea to consider - AEE.


Another short idea - Nasdaq (NDAQ).


I also like BXP as a short.


As well as CBE.


I've mentioned Redback (RBAK) as a good long position. Just look at the swelling of volume. Very impressive.


Don't underestimate how far a stock can fall once it starts falling. Take Getty Images (GYI) for instance. Sometimes stocks can receive blow after blow. Although not shown here, the graph for ESRX will show something similar.

We Cannot Catch a Break

I was on a business trip today. I had to get on a plane, but I was still on the ground to see the Fed announcement and the usual up and down craziness. The market seemed to be moving down nicely, minus over 40 on the Dow.

I got on the plane, flew home, landed, and checked the close on the Dow. Up 6. Jesus Christ.

I'm too depressed to do a post now. Maybe tonight. This is just ridiculous.

Tuesday, October 24, 2006

The Tireless Bull

Each day seems to bring more of the same. The market jumps down. Firms up. Dances around the +0 net change all day long. Then does a late day surge. It's teasing the bears. And the bulls don't seem to be getting tired.

One silver lining to this very big cloud is that the leadership is thinning. Take the NASDAQ 100 for instance. In spite of the Dow making lifetime new highs virtually every day, this index has been a laggard. It was even down a decent amount today.


As you can see by the chart of SPY, the market is ahead of itself. It has "overshot" the channel, just like it "undershot" it early on.


Worth considering as a short - Adobe (ADBE):


Another candidate - Allergan (AGN):


I suggested Checkfree (CKFR) earlier this month, and it's getting smashed in after hours trading today. Nice to have a bright spot in this horrible market.


Health Net (HNT) is another short candidate.


And, lastly, Textron (TXT):


I've noticed in the comments section (which is much quieter now that the anomymous people are locked out) that people sometimes append their ideas with "do your homework" or "do your due diligence" or something else along those lines. Let me save your typing fingers - - you don't need to say such things. The whole idea behind charting is that whatever knowledge the market has is already built into the chart.

Does anyone really think that by puttering around the net they are going to uncover some explosive new information about a stock, be it good or bad, that it absent from the minds of the collective body that trades it? If so, have at it. I personally think you're wasting your time.

To everyone who has survived so far - my hat's off to you. This sucks!

Monday, October 23, 2006

The Stampede Continues

Another day the bulls owned the bears. Big time. Google blasted toward $500 to a new record high. The Dow was up over 100 points early in the day and closed at a new all-time high. These are the times that try bears' souls. Assuming there are any bears even left.

Russell 2000 remains on my list of favored indexes to short (for those still insane enough to do so):


Capital One Financial (COF) is still on my favorites list (again, short).


Fluor (FLR) is doing relatively well (once again, bearish position) considering the market's strength.


I think NBL for a short position related to the oil markets.


Same applies to old favorite Oil Service Holders (OIH) which has a nice clean stop price for limited risk:


Another oil shortie, OII:


For a long position, think about Red Hat (RHAT) which has gorgeous volume to boot:


I finally (!!!) bought Sears (SHLD) today and am already in the green. Beautiful pattern here.


TSO is another short idea.


And, although higher risk than OIH, similar logic applies to shorting $XAU:


This is a rushed post, since I'm off to a business dinner. Considering how high the market is, my portfolio is pretty well intact. Hang in there, everybody.