Showing posts with label fibonacci. Show all posts

Wednesday, March 07, 2007

I See Debt People

I made a remark (shortly before last Tuesday's huge drop) that I was starting to feel good about the market again. I believe that even more strongly now. This market is actually starting to make sense again. And act rationally. And predictably (to a degree). Maybe some sanity is coming back.

I was also gratified to see that someone finally posted the first review on Amazon of my book. Those of you who have purchased it, please do the same!


Today's market reminds me of the contrast between fantasy and reality. See, the market people were all swept up with (until quite recently) looked a lot like this:


But the market I see (and, believe it or not, it's the exact same person in the photo above and below) is something I try to view with clearer eyes and a more logical mind:


The market is older, more tired, and more dangerous than the glossy photo shoots on CNBC might make you believe.

I continue to be fascinating by the NZD/USD trade. I don't think I've ever seen a market bounce off Fib retracements this predictably. It is incredible! Continued weakness here can only be good for U.S. stock bears.


The behavior of the Dow recently has been fascinating. (1) shows the point where the market was bottoming out and beginning to get the confidence to turn back up. At (2) it completes a beautiful saucer pattern, and it accelerates to (3). The market begins softening, which causes short-term worry, but then it regains its strength and zooms to (4). Now the bulls are starting to feel really good. But the drop from point (4) to point (5) is what this market is all about.......dashed hopes.......and, to me, is a strong sign that we may be headed for more marvelous weakness.


Here's a short term chart of my favorite index short, the Russell 2000. I don't know why the bid/ask spreads on this, a much more thinly traded option, are so much more reasonable than the gigantic S&P options, whose bid/ask is a complete rip-off. In any case, the horizontal line at 782 is my stop loss point.


A longer term view of the same index reveals the many Fib retracements I've laid down.


Now for a few short picks. Bank of America (BAC) seems to have exhausted its recovery.


Continental Airlines (CAL) is right at the cusp of a full blown breakdown.


I am madly in love with my CME puts right now. This stock looks so juicy you can just about cut it with a steak knife.


I haven't touched Google (GOOG) in ages, but I picked up some puts today.


MWP looks like a good short play on a hyperbolic stock.


And Reynolds (RAI) is a very clear toppy pattern.


I read the big economic news isn't until Friday morning. In spite of that, both Thursday and Friday are bound to be fascinating! See you again soon.........

Wednesday, October 25, 2006

Perpetual Motion Machine

I won't bore you. Same old story. New high. Relentless bulls. Bears being turned into hamburger. Not good.

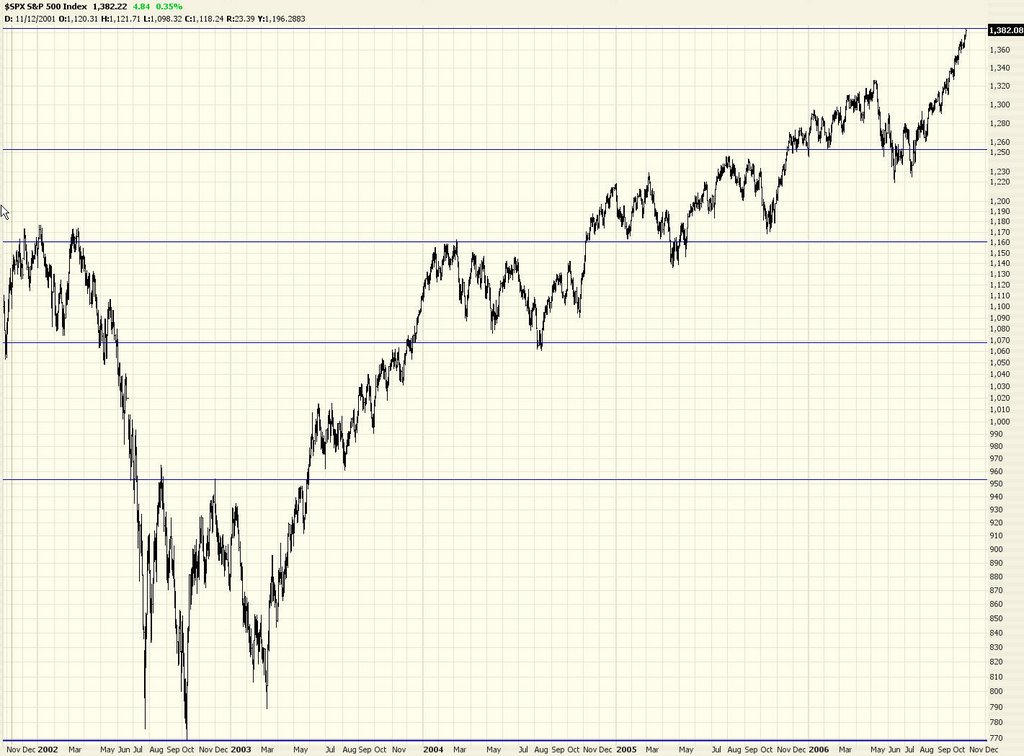
I noticed early on Wednesday that the S&P was approaching its 78.6% Fibonacci retracement (as measured from the peak in January 2000 to the trough in October 2002). It doesn't necessarily represent a brick wall. There have been times that the index has blasted right through it. However, there does tend to be some gravitational pull near these retracement levels. Examine how it's behaved in the past.


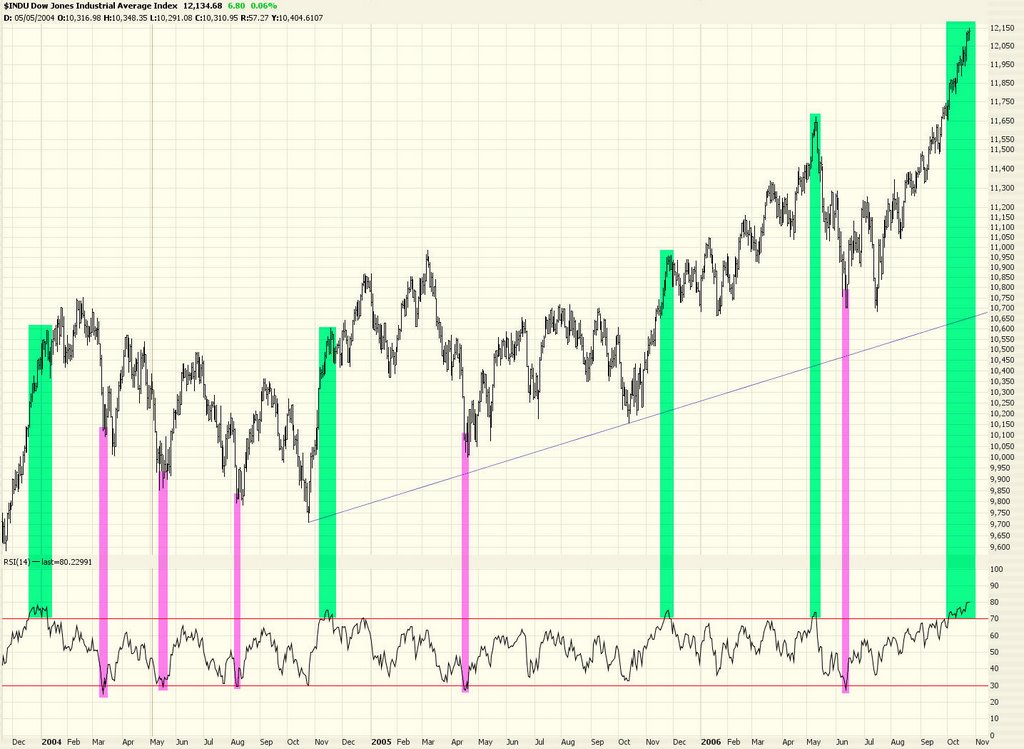
Some readers have noticed how ungodly high the RSI has become on the market. They're right. Take a look at the Dow 30 over the past few years. I've highlighted in green the places where the RSI has gone over 70 (it's in the unprecedented 80+ vicinity right now). I've highlighted in pink the places where it's gone below 30. Interesting just how long we've been above the 70 level this time.


Here's a long (yep, long) idea to consider - AEE.


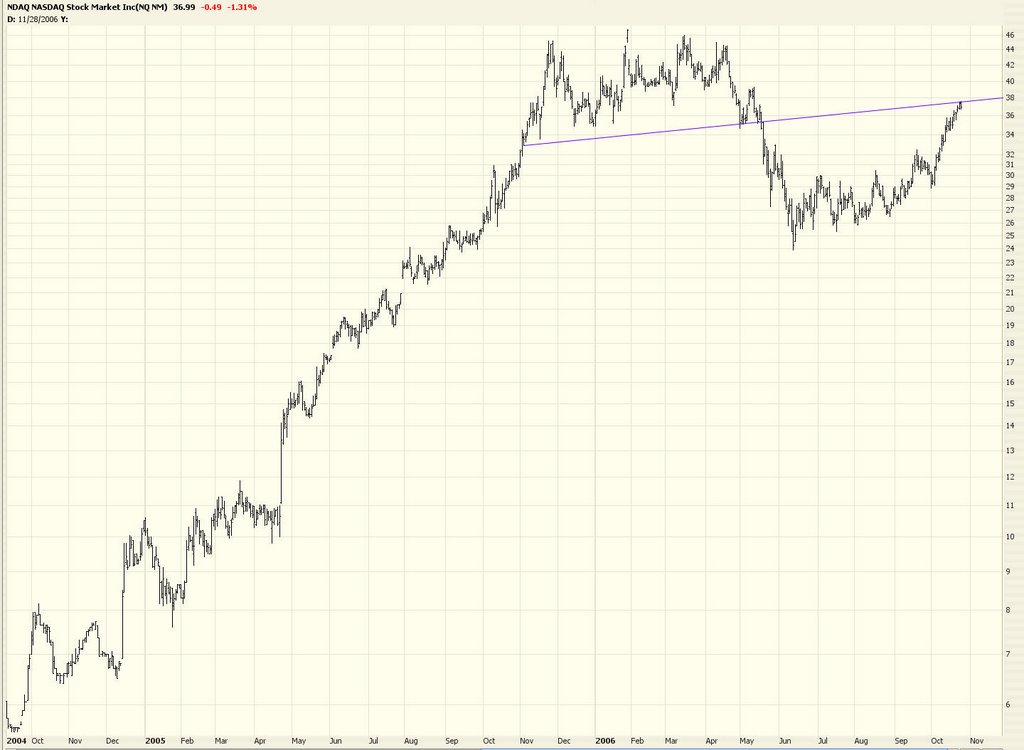
Another short idea - Nasdaq (NDAQ).


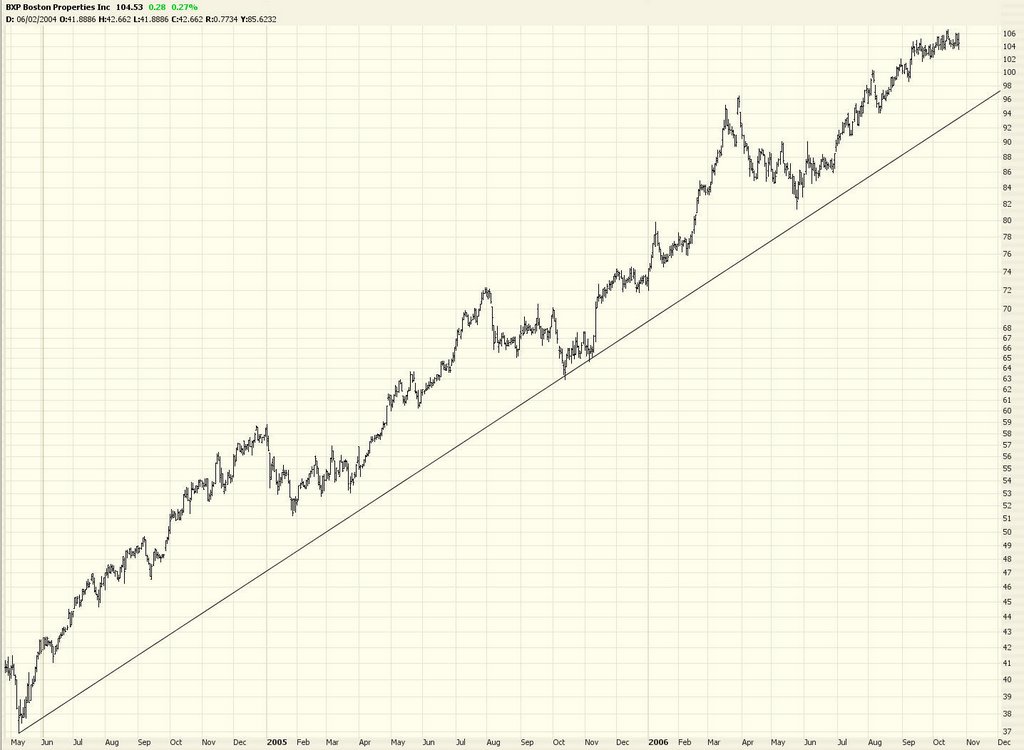
I also like BXP as a short.


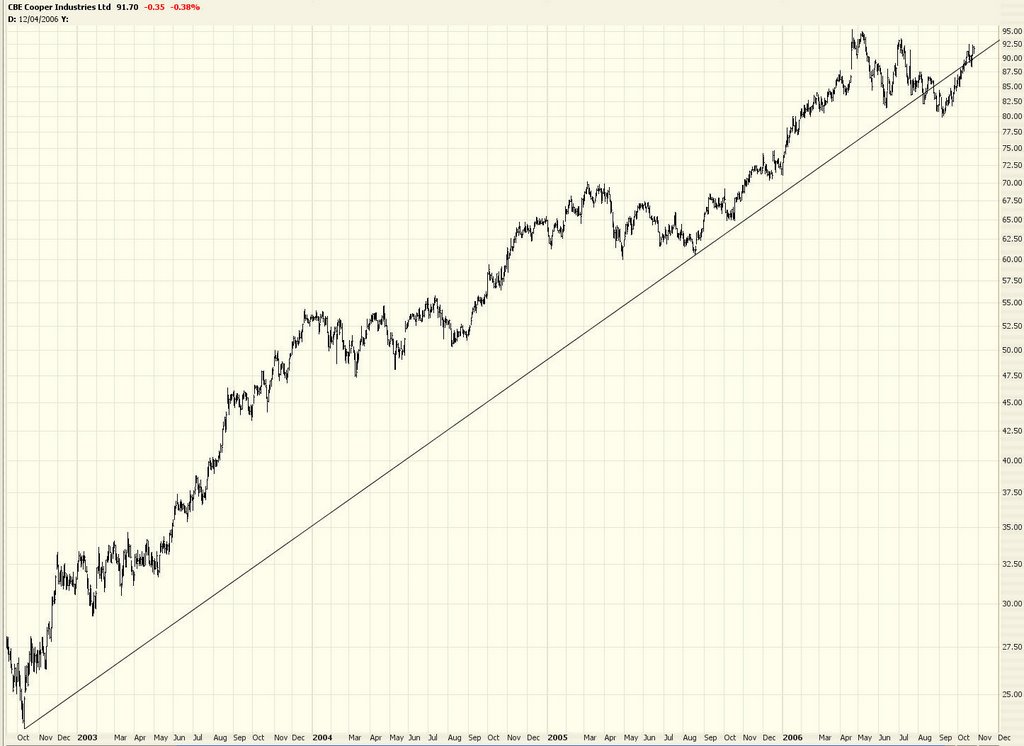
As well as CBE.


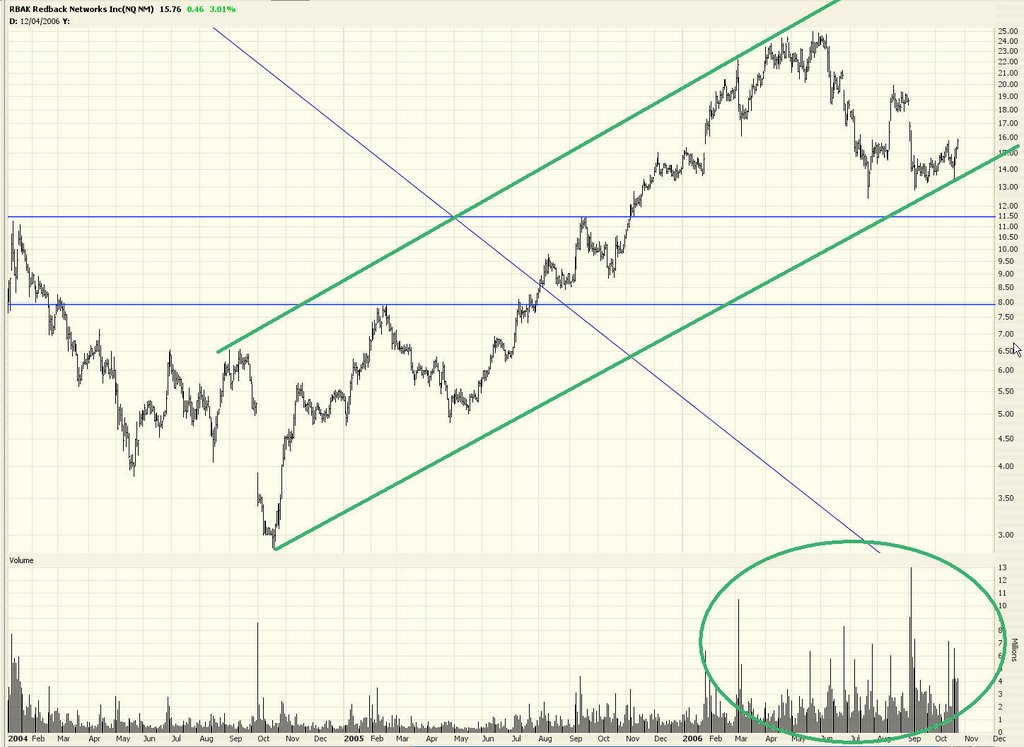
I've mentioned Redback (RBAK) as a good long position. Just look at the swelling of volume. Very impressive.


Don't underestimate how far a stock can fall once it starts falling. Take Getty Images (GYI) for instance. Sometimes stocks can receive blow after blow. Although not shown here, the graph for ESRX will show something similar.

Monday, September 18, 2006

Oil and Gold turn to Rubber

Just a quick intraday post.

Oil and gold are having a pretty big up day, which is no surprise considering how badly they've been pummelled in recent weeks.

Oil - more precisely, OIH, which I consider a proxy for the major oil services stocks - is doing a textbook retracement to its neckline. The bolder among us may want to short aggressively here. This is a gorgeous head and shoulders pattern. It's always scary shorting at a time like this, naturally, because there's a lot of strength. But retracements to necklines often represent the lowest-risk time to go short, since you've got a crystal-clear stop loss level in case you're wrong.


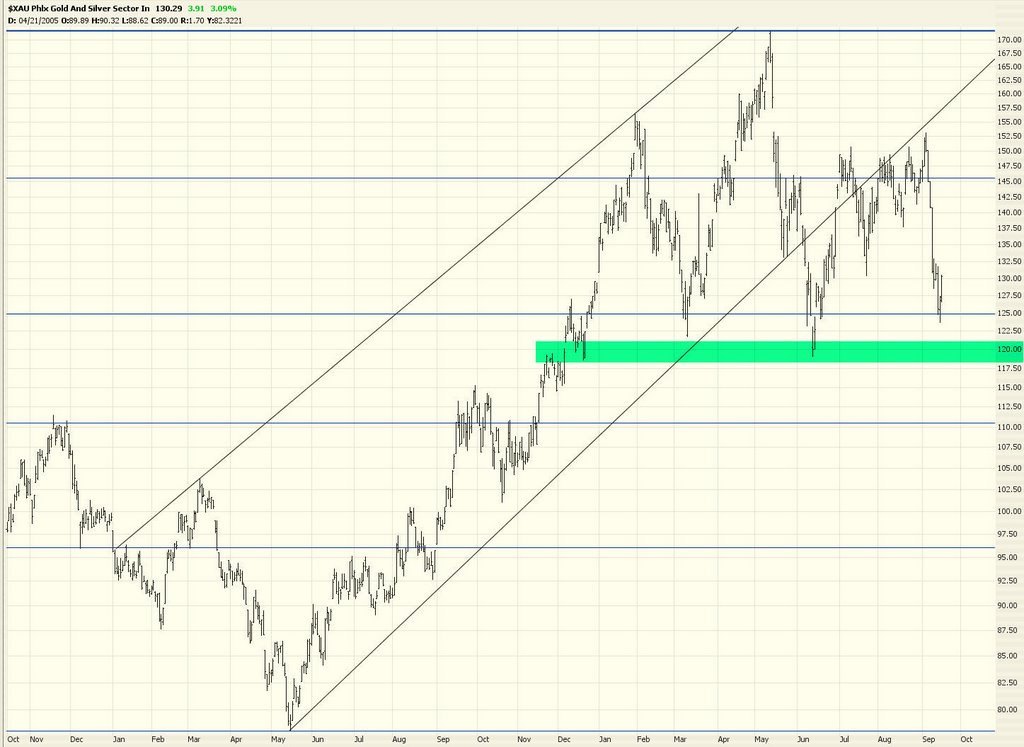
Gold ($XAU) is murkier. It was forming a head and shoulders pattern, but it didn't get back down to its neckline. In addition, the price has pushed its way to a major Fibonacci retracement level, which implied the selling was over for now. So I'm steering clear at this point.


At the moment, the stock indexes are showing a skosh of weakness in spite of earlier strength. Let's hope it continues until the close!