A Good Start
I have been in Lake Tahoe this week, just like last year, and it's been snowing like mad. Here's a picture I took of - what else? - a bear yesterday, covered with snow (OK, it's a statue, but still). His eyes are totally covered, and he's got sort of a "where the hell am I?" look to him. I can relate.
I enjoy checking out The Kirk Report regularly, and a recent entry showed the fascinating fact that twenty out of twenty sentiment indicators are bearish now. Even I find this amazing. And, believe me, Charles Kirk is no permabear - so you bulls might have a bit of respect for what's been said.
The graph below is one I find troubling. It shows the median value of real estate prices in my part of the country (the initials represent local counties - Santa Clara, Santa Cruz, San Mateo, and Monterey). Now, as you know, I normally love to see a graph that is primed for a fall......this graph, although crude, is pretty obviously a head and shoulders. But I own not one, but two, houses in this area. And it's no secret that housing is in a slump - maybe even a prolonged one. Not good!
Another macro trend (which had everyone in a panic early last summer) is the descent in crude oil prices. When crude was at about $80 per barrel, people were freaking out, and $100 per barrel seemed a foregone conclusion. My view of this market is very bearish. The break below the trendlines you see here is significant.
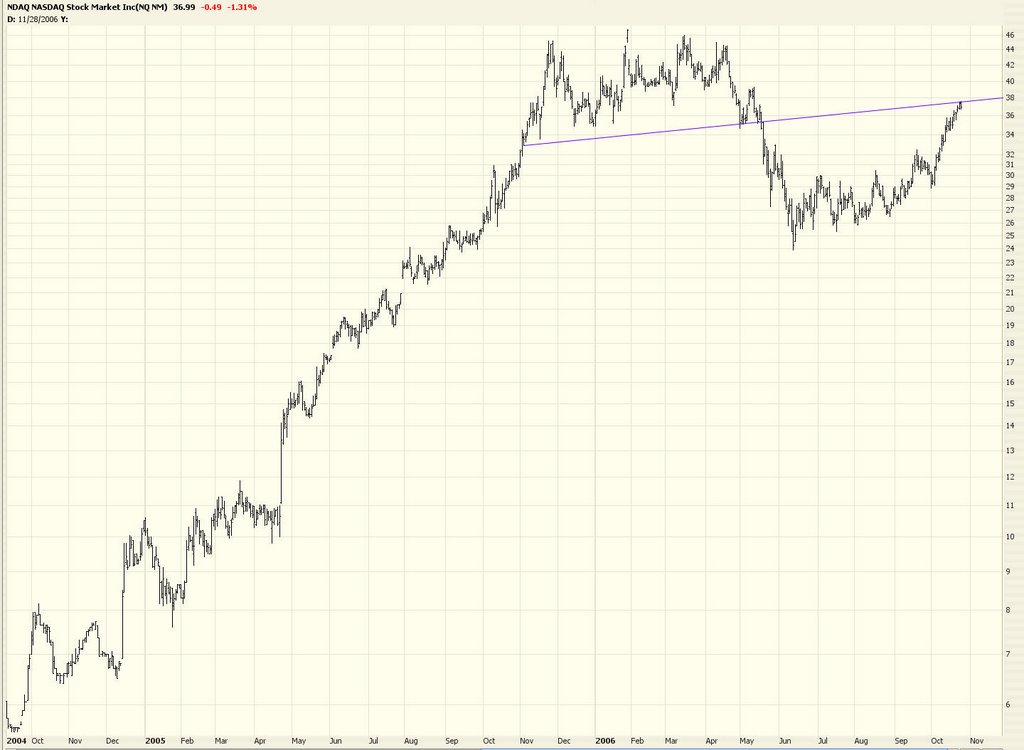
The NASDAQ exhibits something about trendlines that I've mentioned before, and which I always find fascinating. That is, the act of the trendline changing from support to resistance. Look how the market took its first fall last summer and spent most of 2006's second half climbing back up to kiss the underbelly of the trendline. Now the descent begins anew.
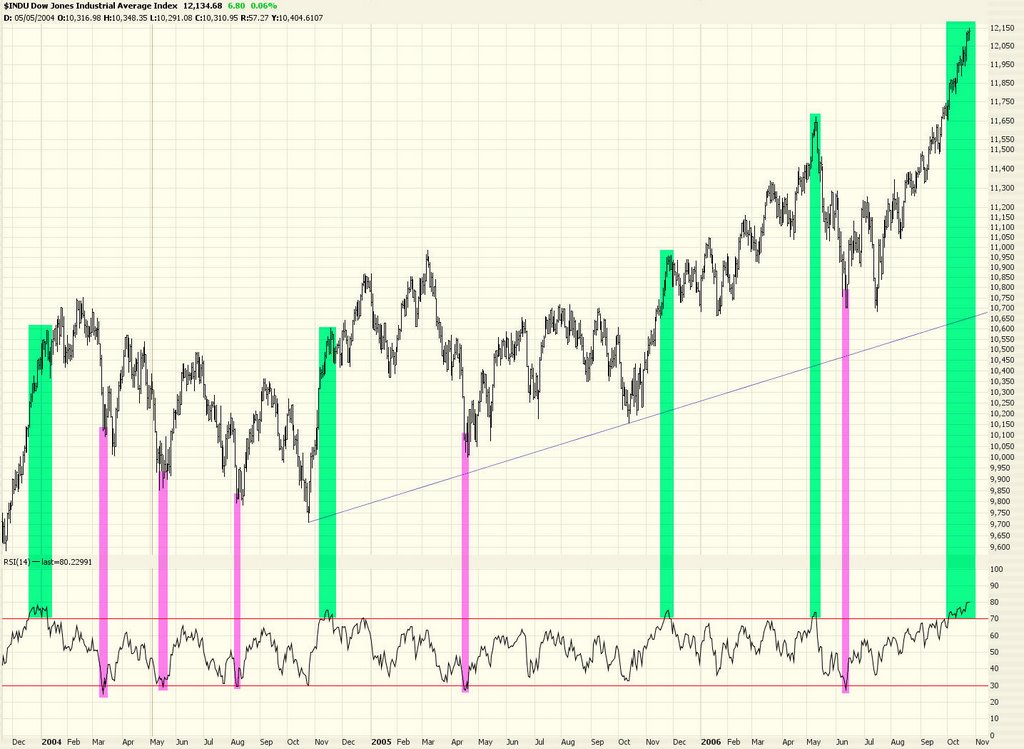
And look how the RSI in the Dow 30 keeps slipping away. The first trading week of 2007 seems off to a great start.
And the Transports have a good chance of cracking the enormously important trendline you see below the current price level.
Lastly, the Dow Utilities got clobbered today.
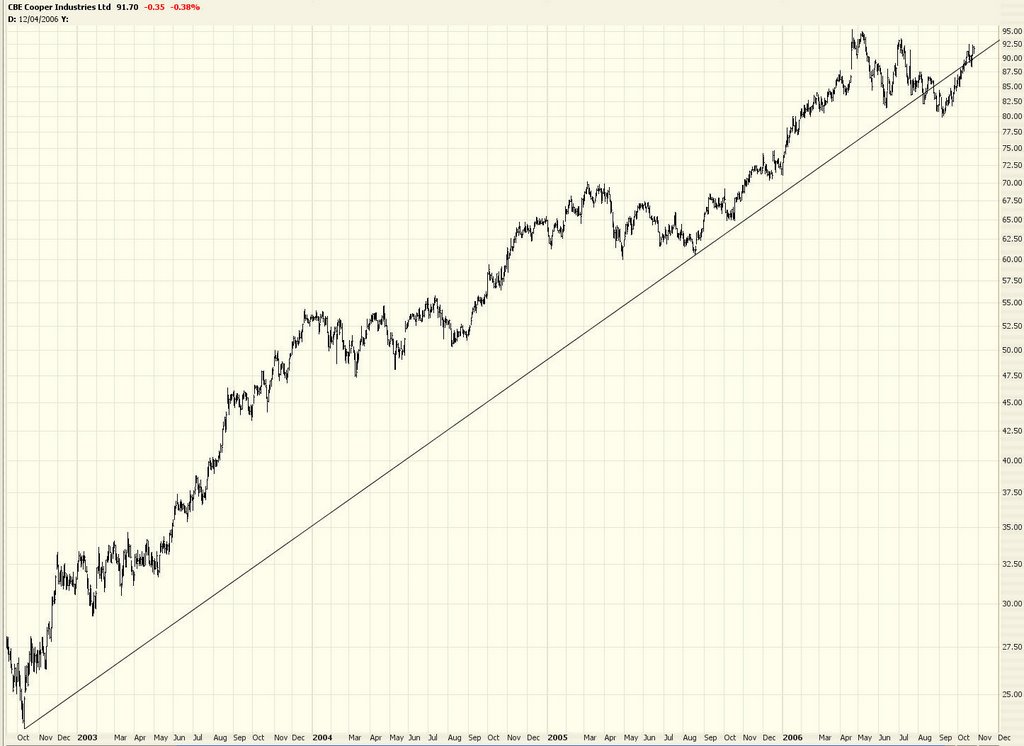
Now let's look at some short ideas. CBE:
CNX:
COF (mentioned often before):
CPT, a good real estate play:
ETR seems to have peaked out and slipped nicely today:
GS:
OIH may have bottomed out for now, in spite of my bearish view of crude oil. This may see an upward bounce next week.
RIMM worries me, as does Google. This is amazingly strong. Just look at the accompanying volume as well. If it busts above its lifetime high, marked here, I'm going to hang it up for now on this one.
If you've gotten this far, here's your reward......a mash-up of two of my favorite movies: Rudolph the Red Nosed Reindeer......and Full Metal Jacket. Those easily offended, don't even bother clicking the Play button.