Thursday, June 29, 2006

Opportunities Abound

I'm not worried.

See the serene look on my face? That's the look of a calm bear. I take today's huge gains on the market in stride.

Sure, I got stopped out of a lot of positions. But that's the purposes of stops. It saved me a lot of money. Losing money is OK. Losing a lot of money by not having stops, hoping things will turn around somehow, is not OK.

I'm not going to offer any specific stock suggestions, although, believe me, tons of them abound. Just a quick market overview in the face of a very ugly rise in the market.

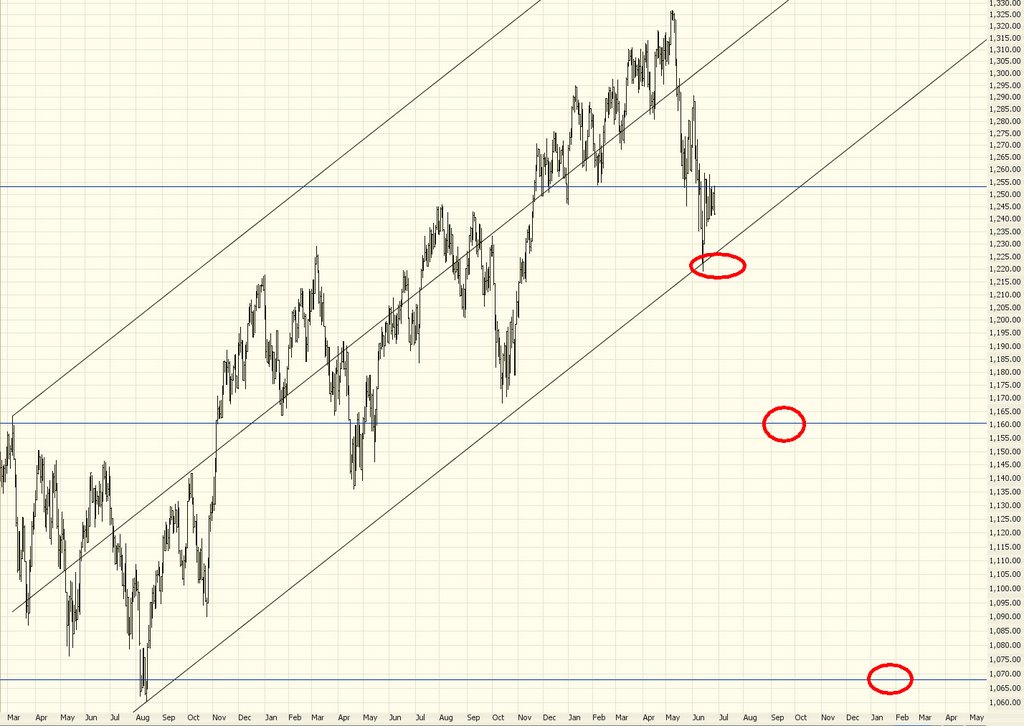
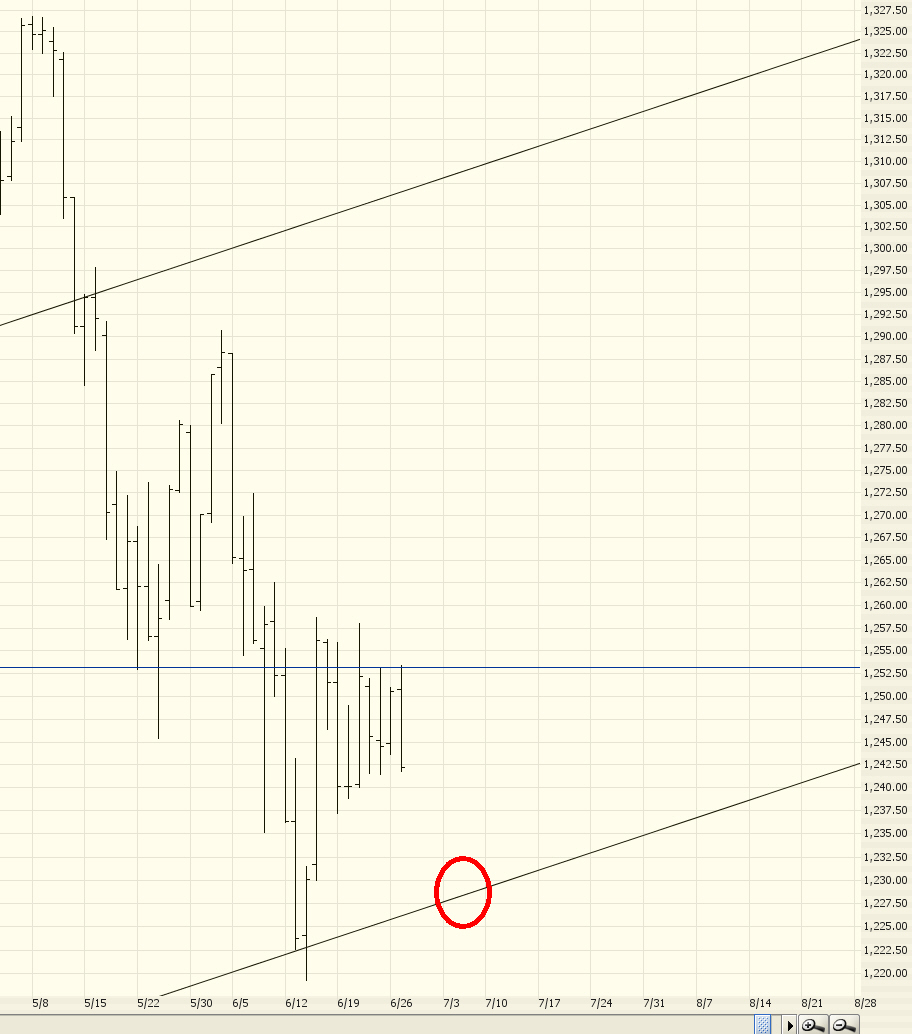
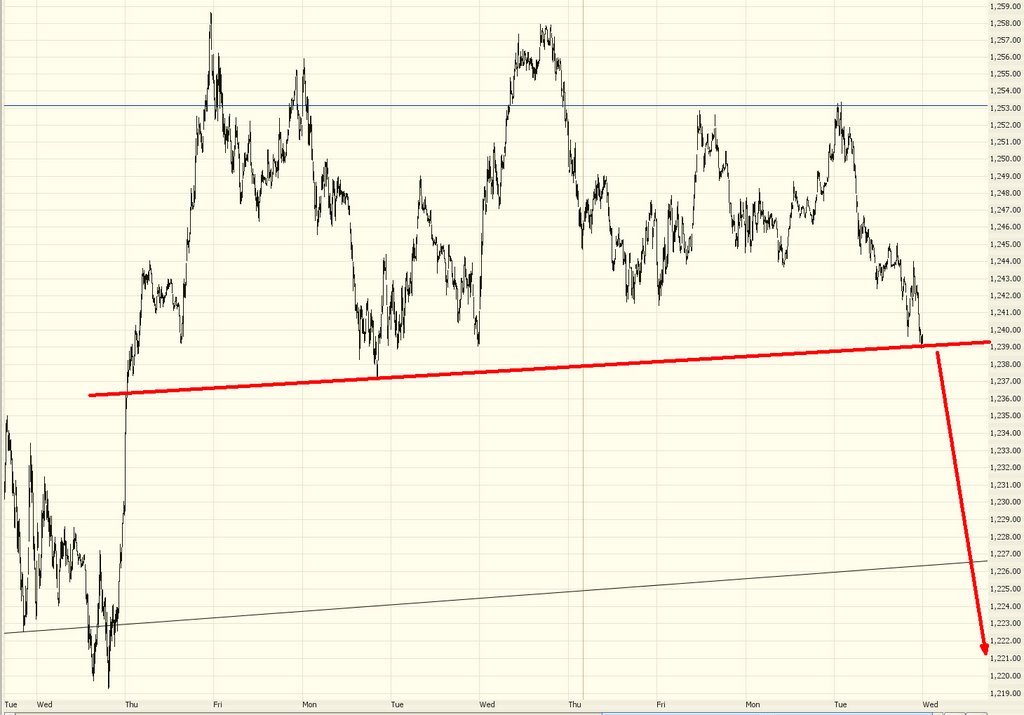
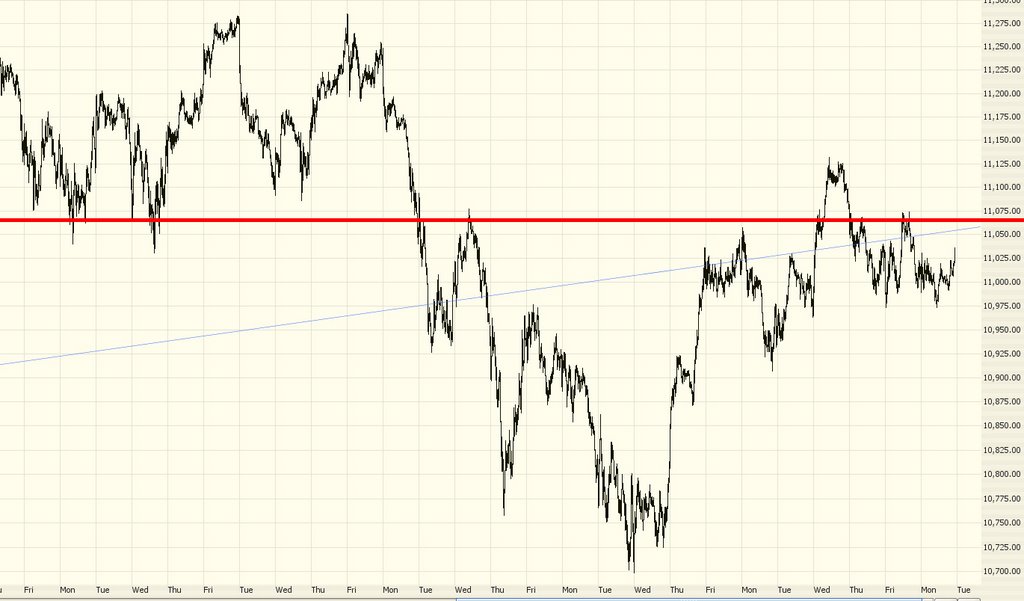
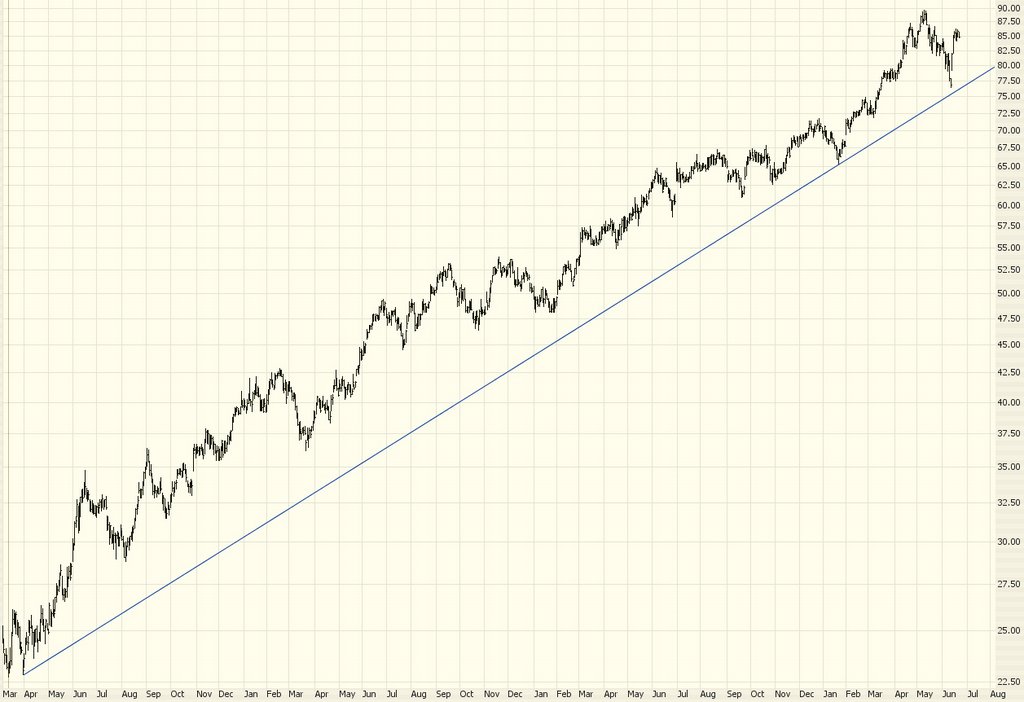
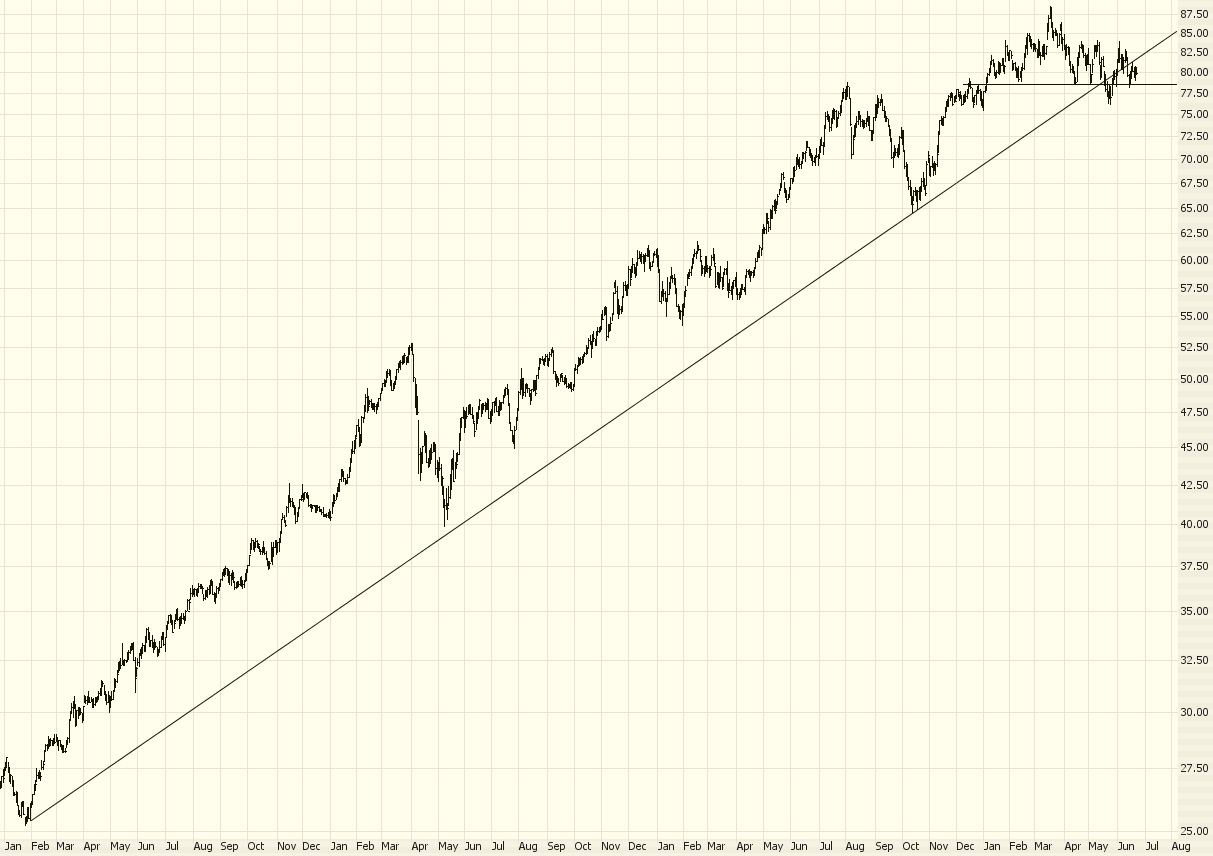
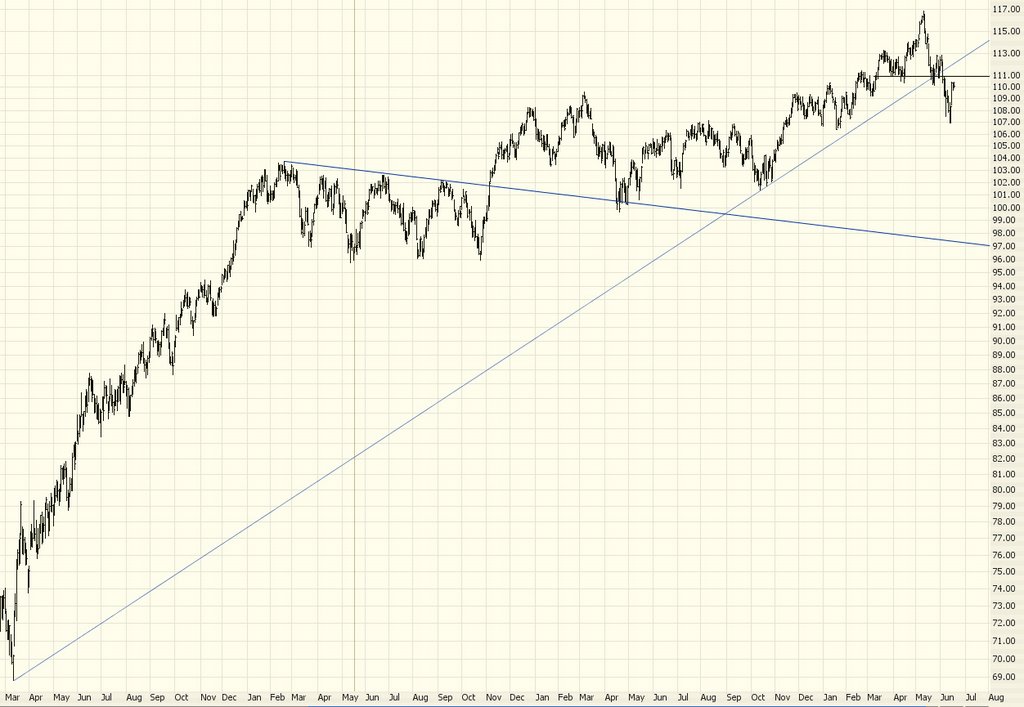
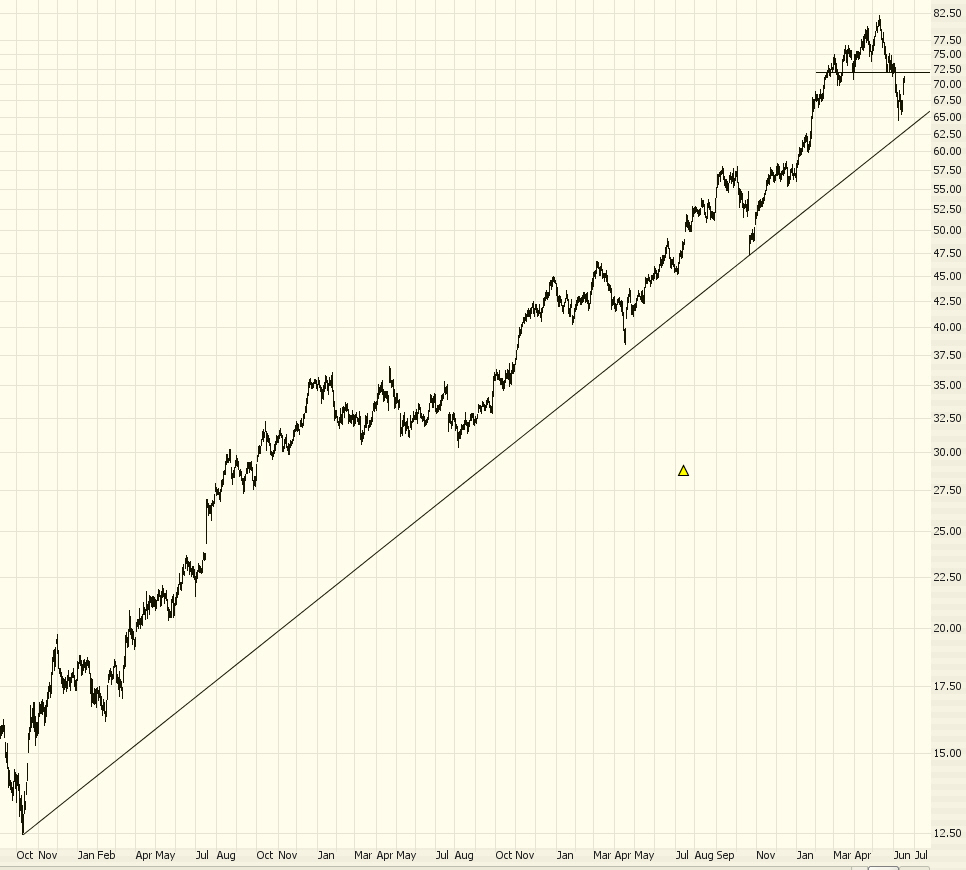
The Dow, up well over 200 points today, made the "topping" pattern (intraday) mentioned a few days ago moot. However, it is still well positioned for a fall. It's pushed up against its former support line. I'm not sure how the weirdness of "day before the July 4 weekend" and "short July 3 trading day" will muck things up, but we have to ignore such circumstances and consider them ordinary trading days.

Now, if the Dow pushes based the zone I've put in green, it's a very different story. But we aren't there yet, and we may never be.


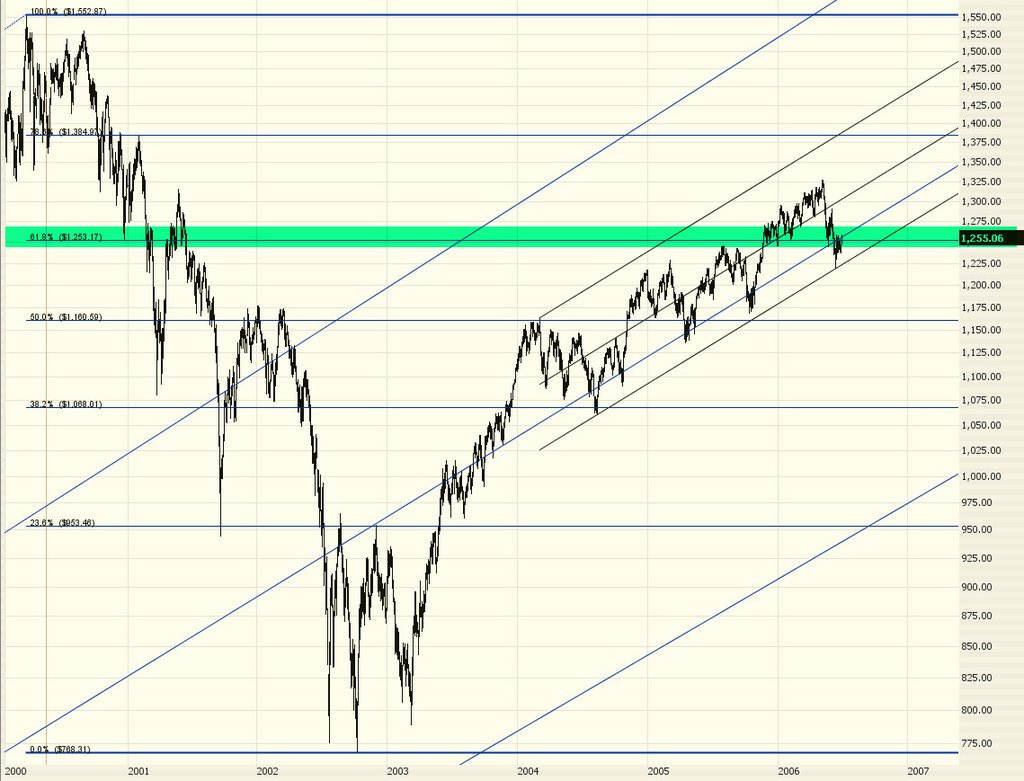
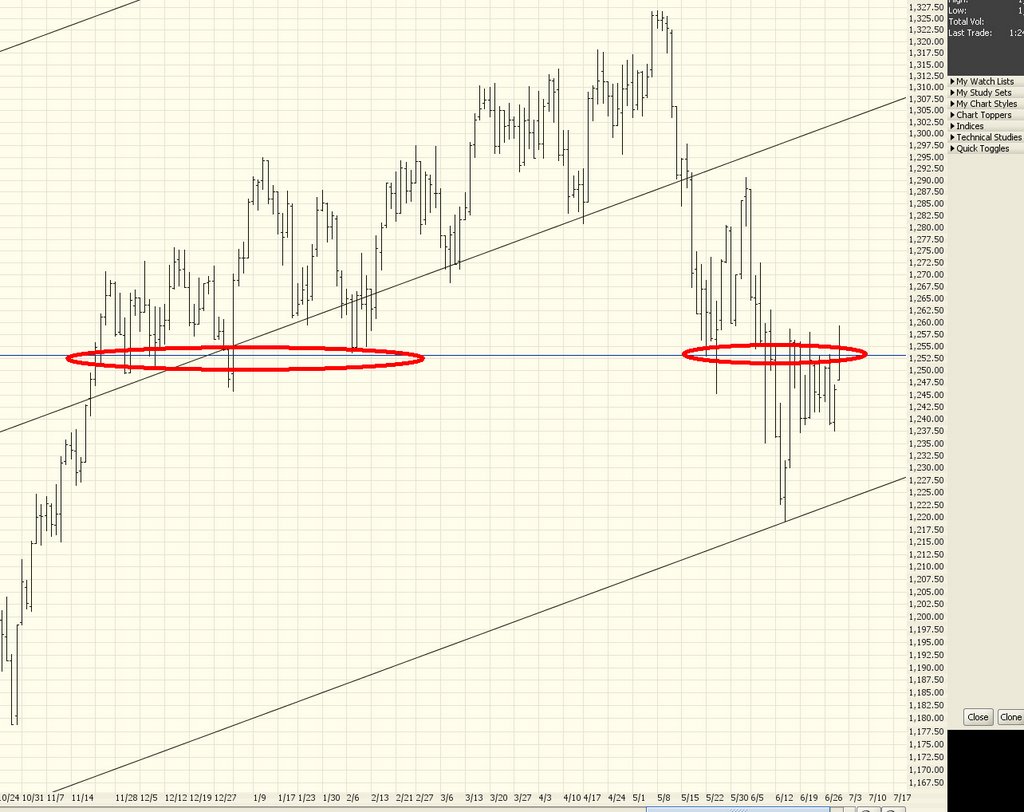
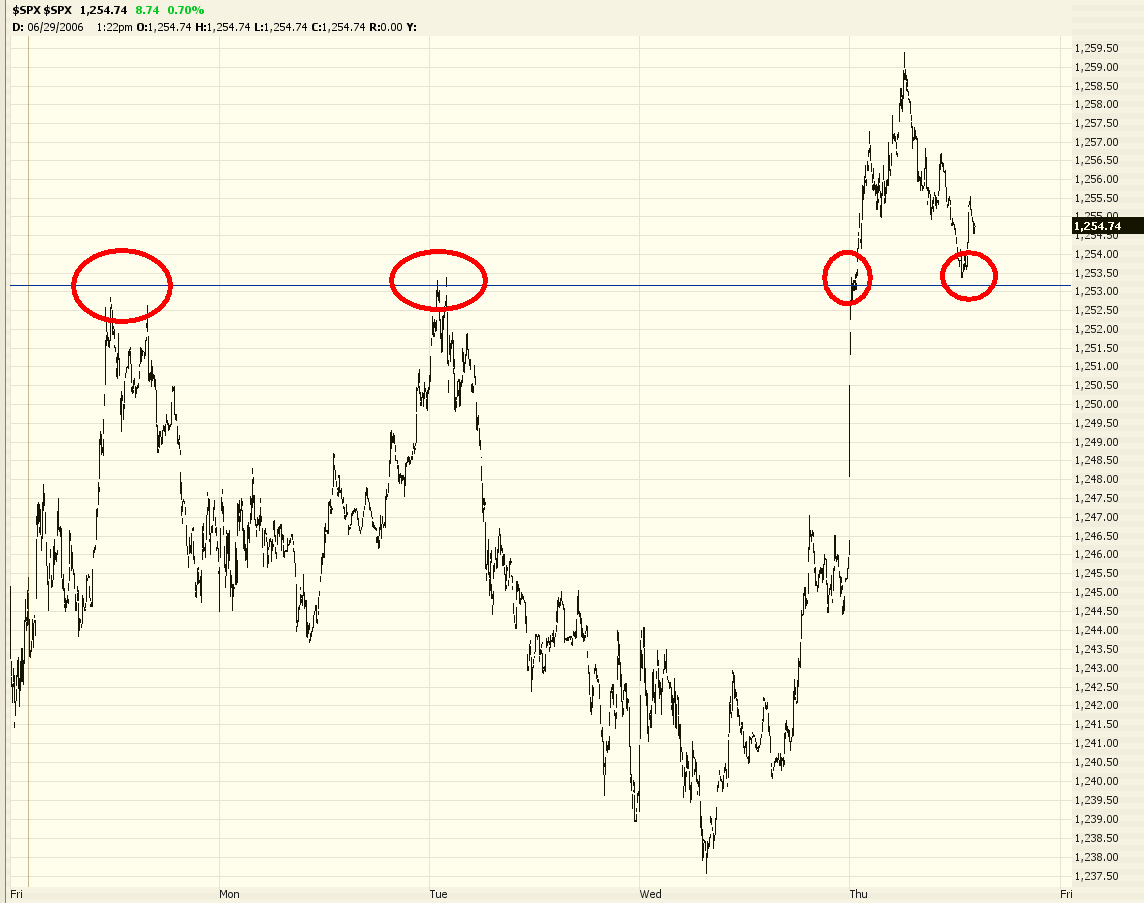
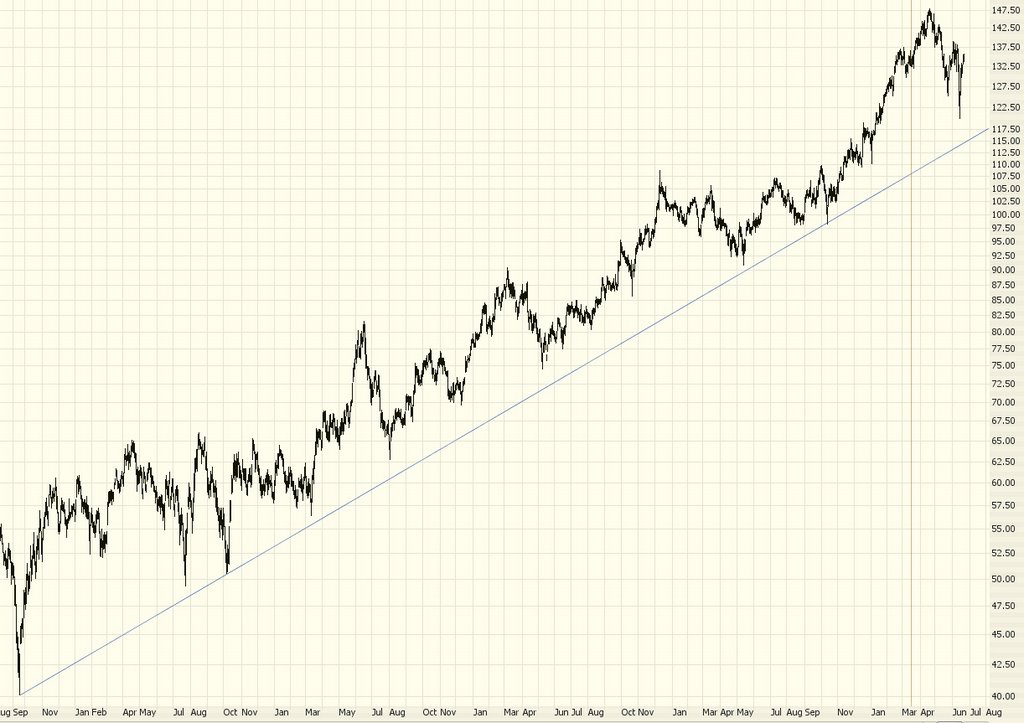
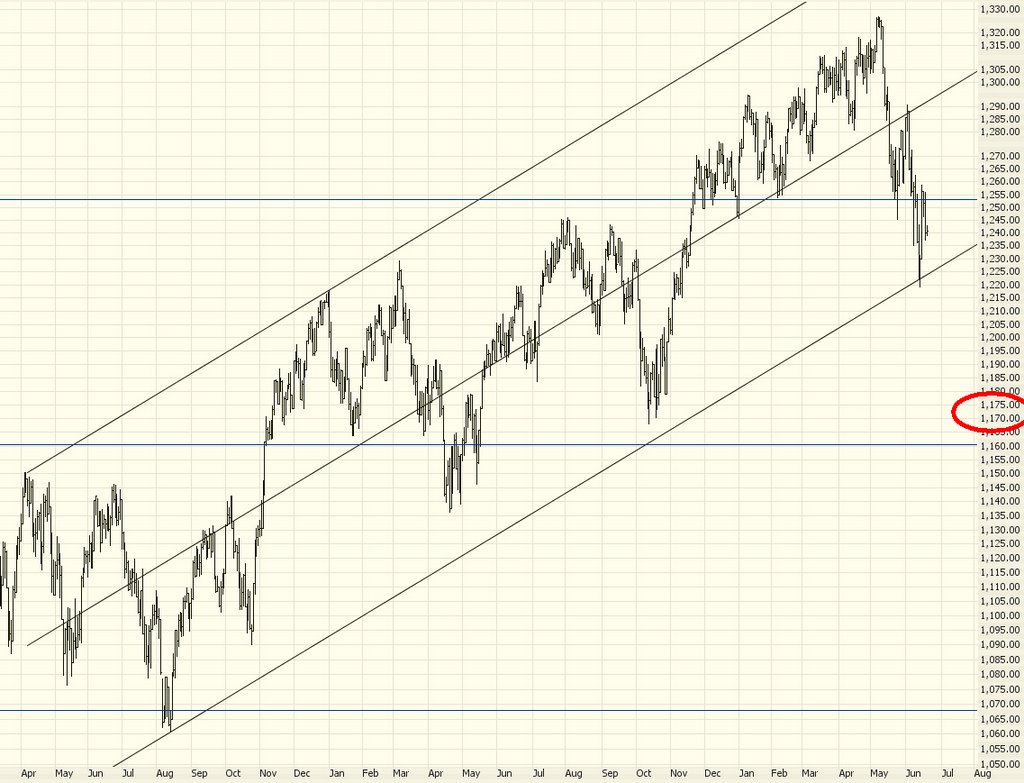
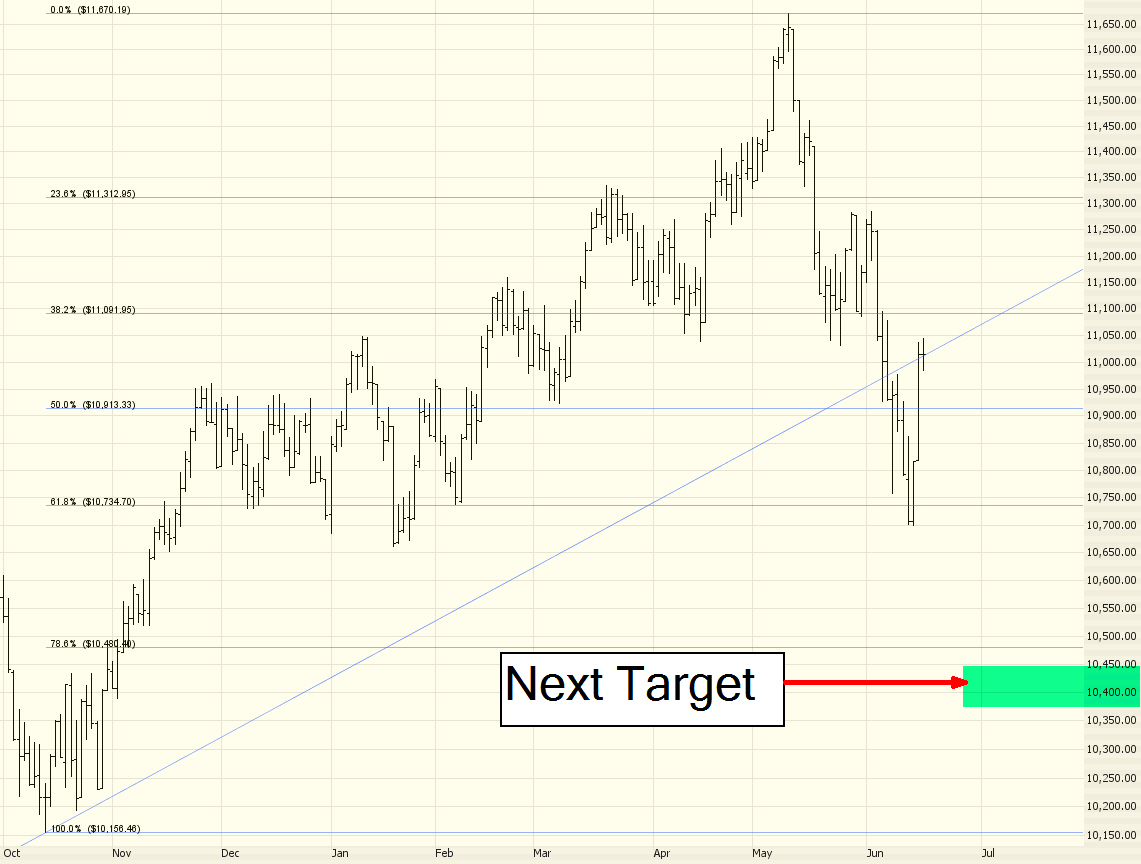
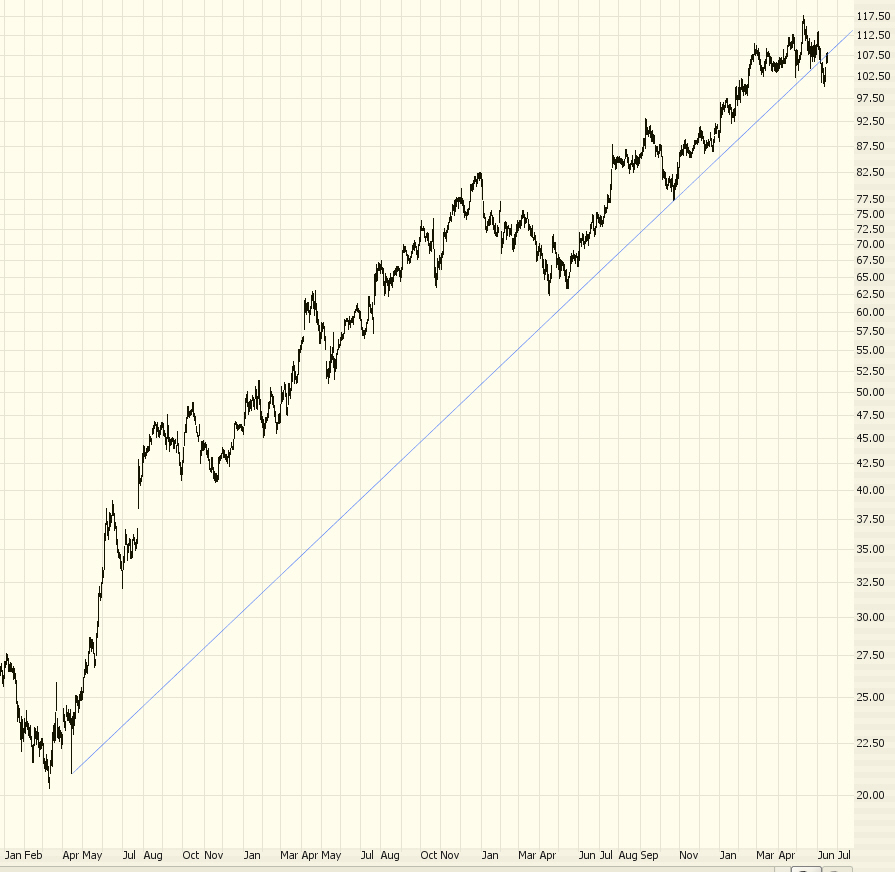
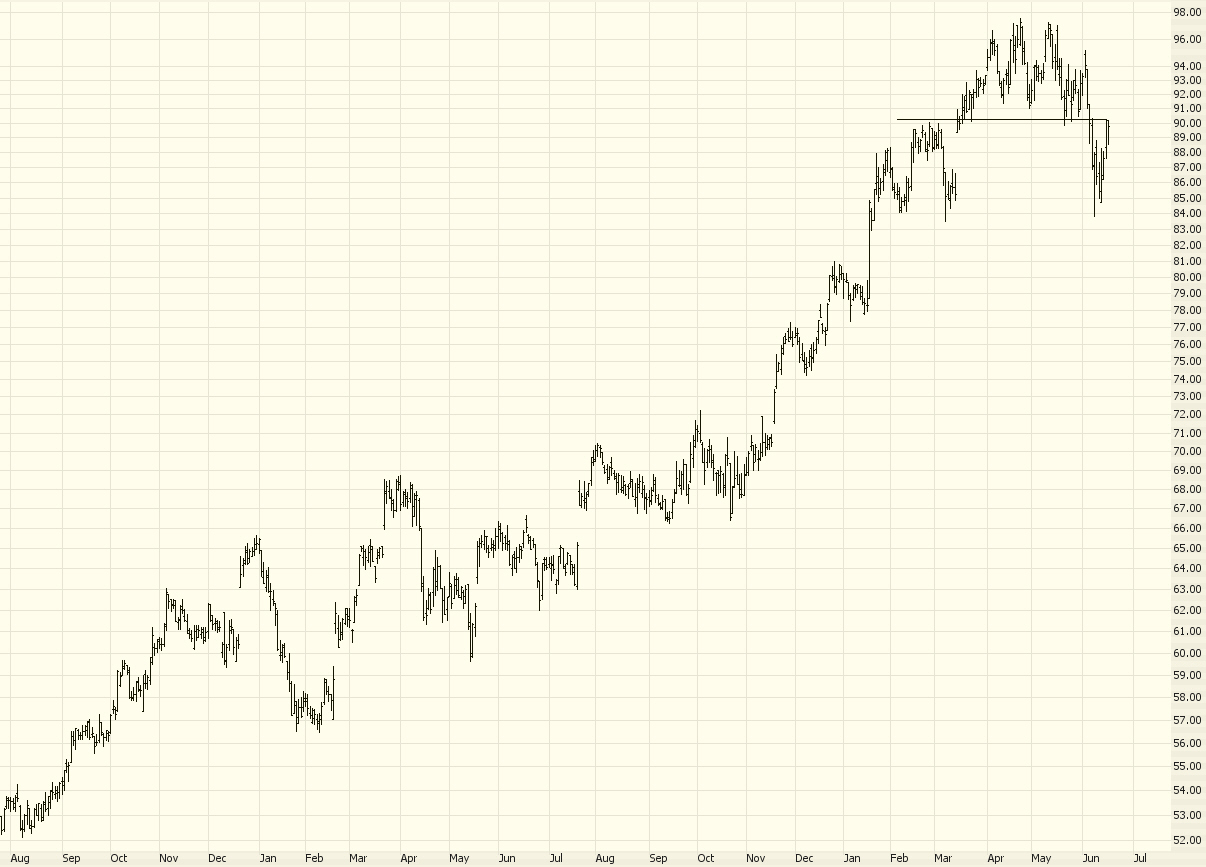
The S&P likewise is still in good shape for the bears. Notice how the succession of lower highs and lower lows is still very much intact, even with today's explosive rise.


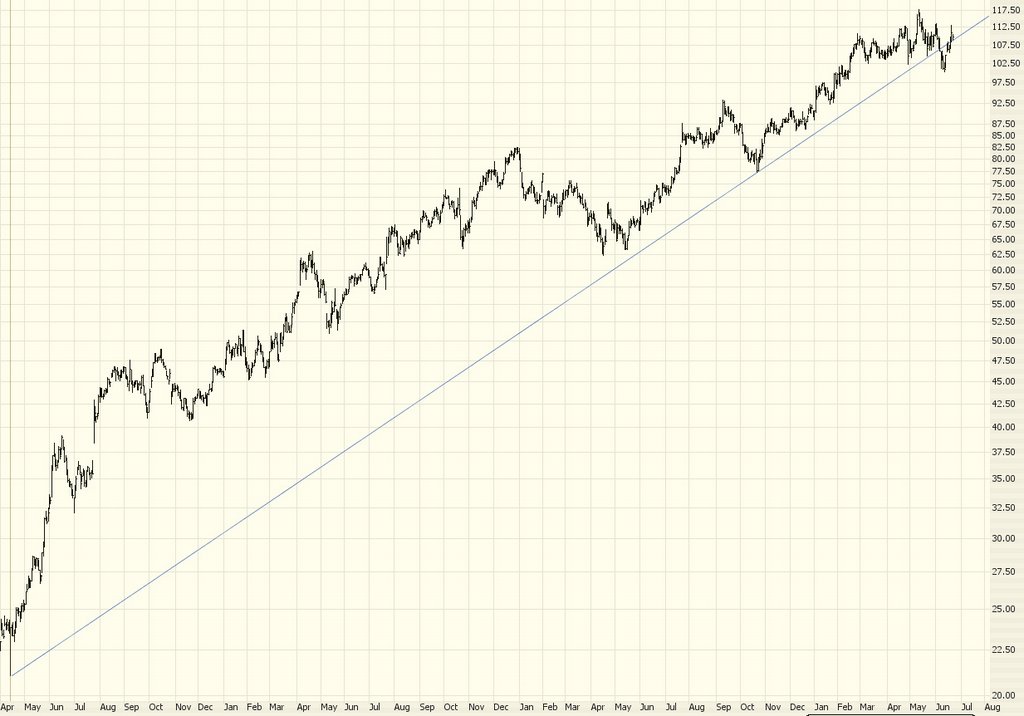
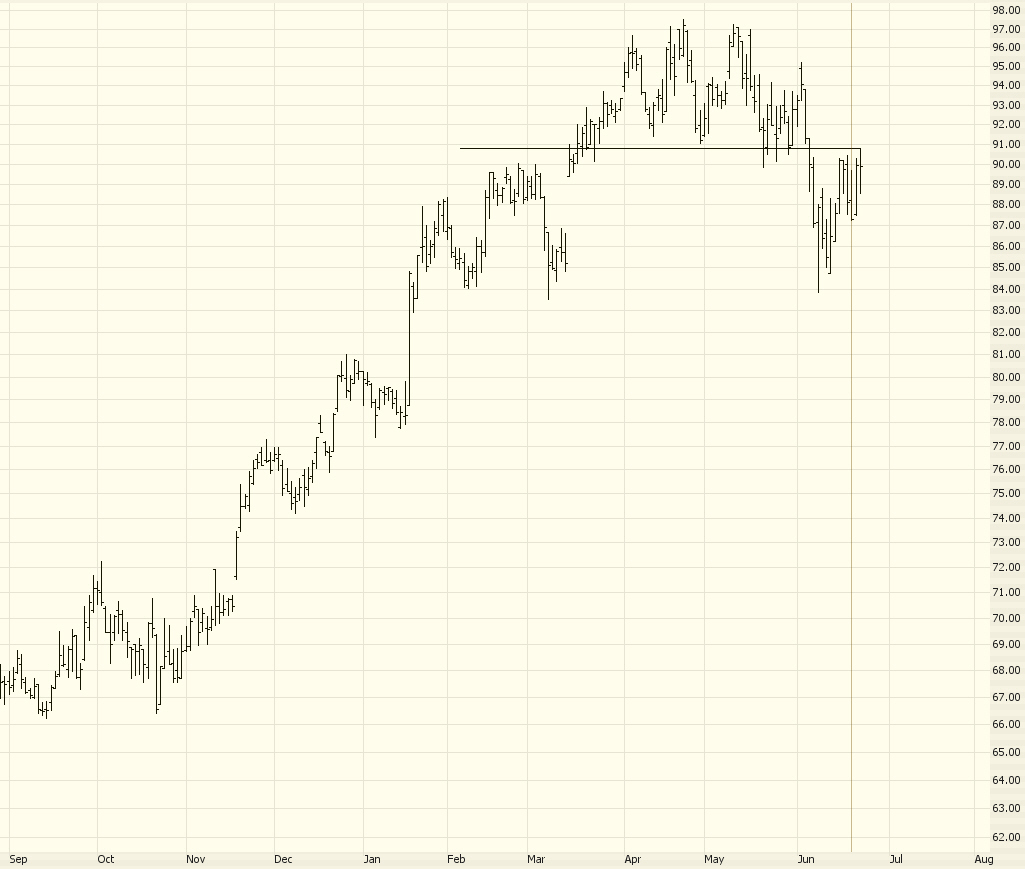
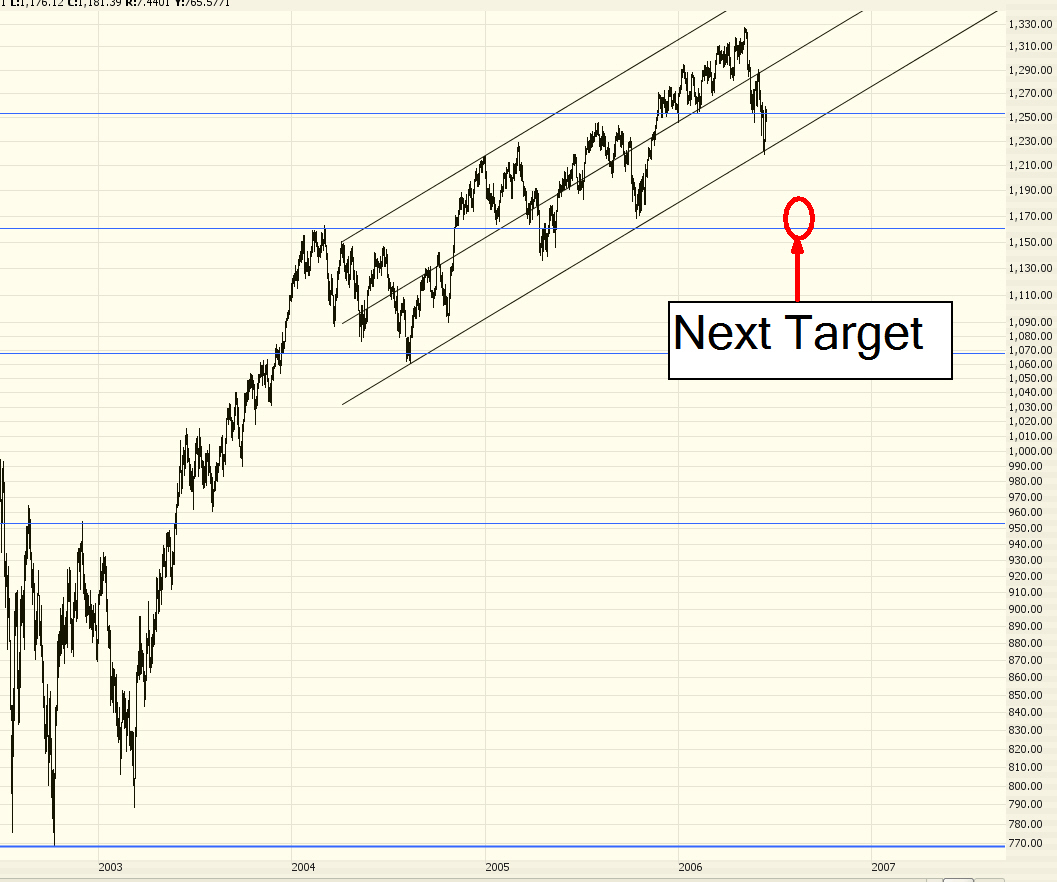
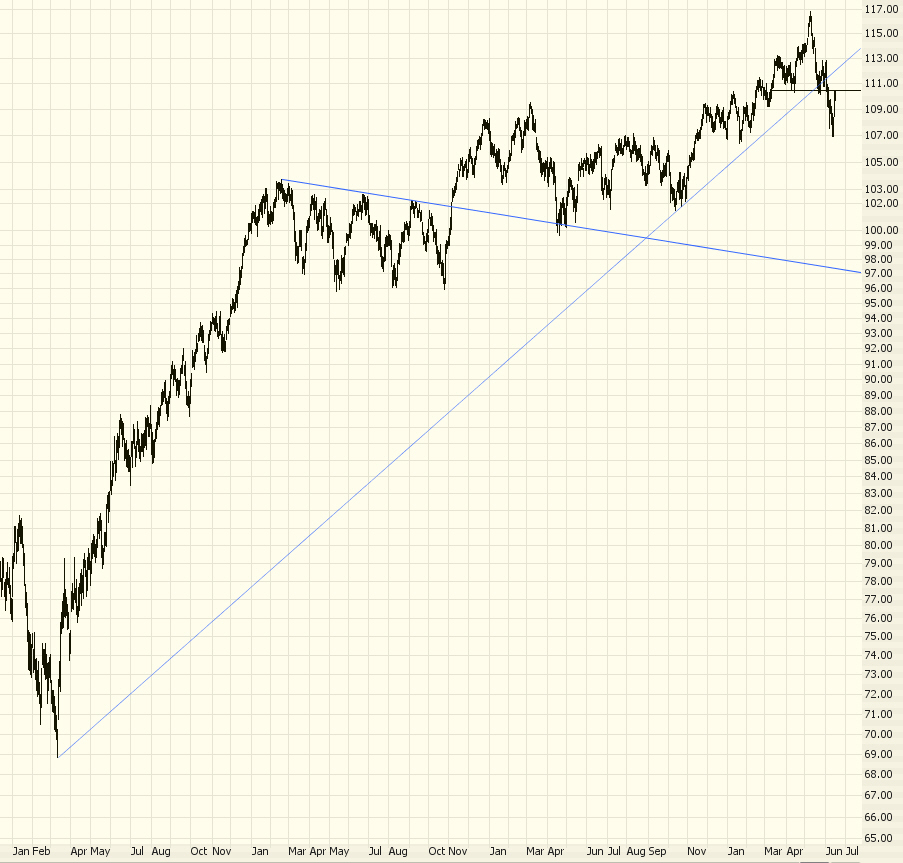
Same deal with the S&P 100 (the $OEX). It broke below its trendline. It is clawing its way back. But it's still in a bearish situation.


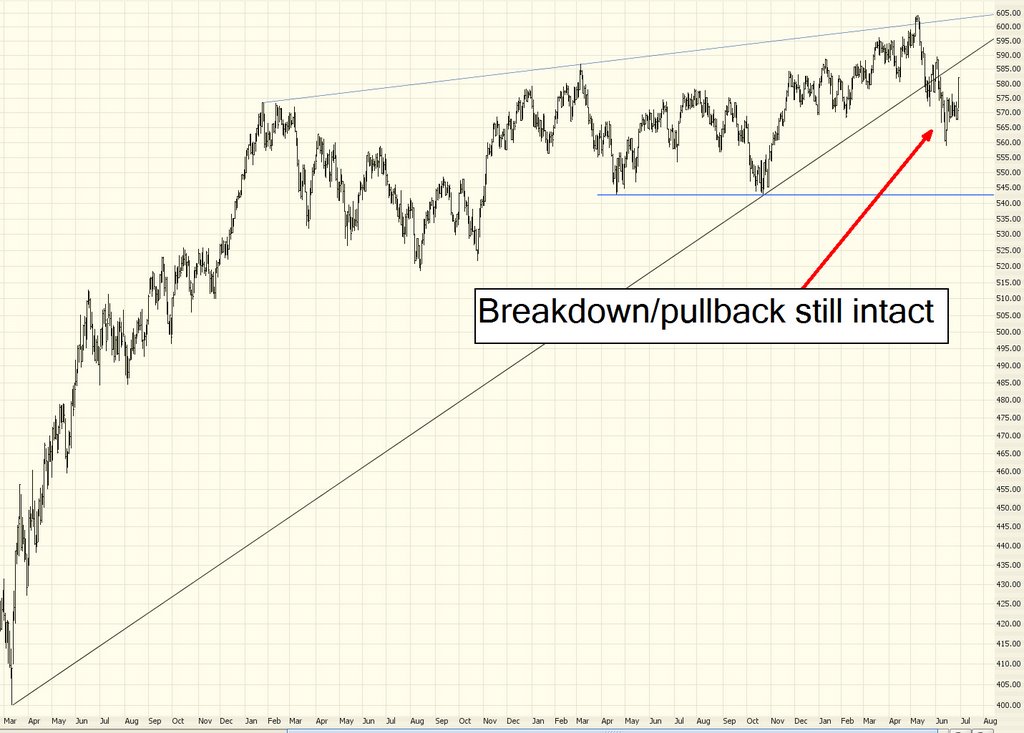
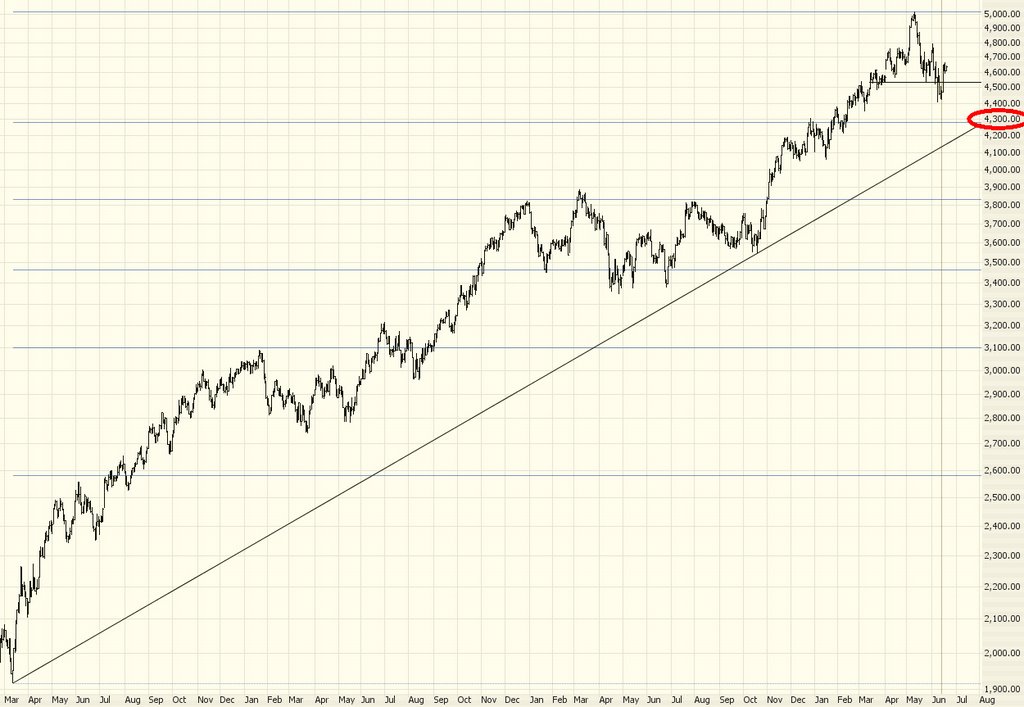
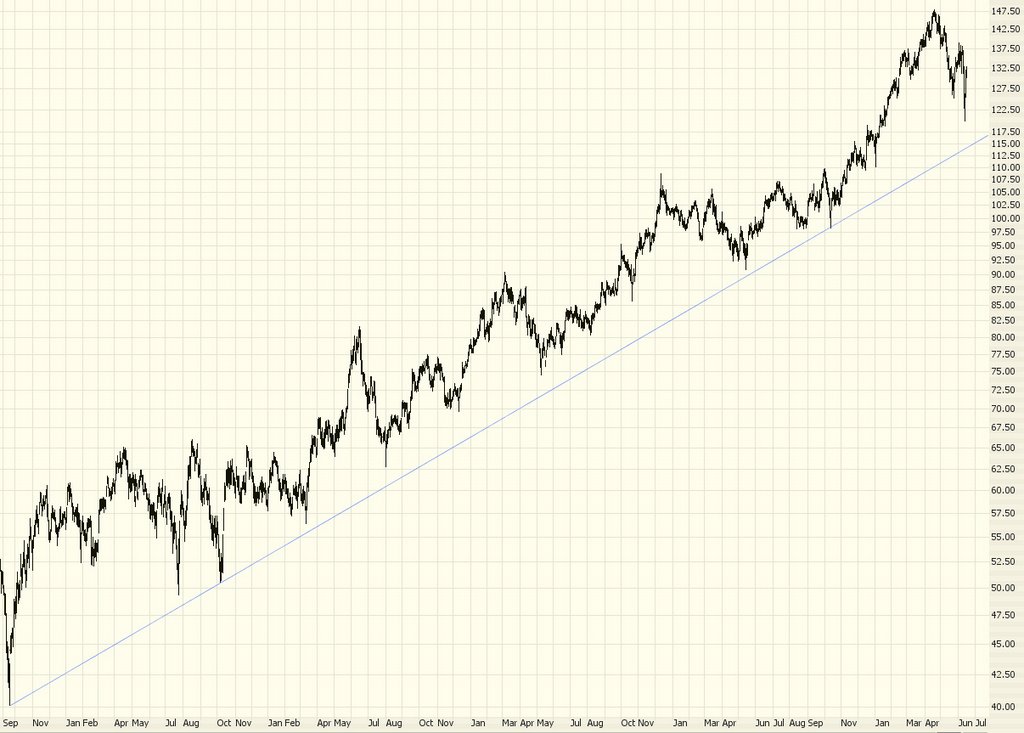
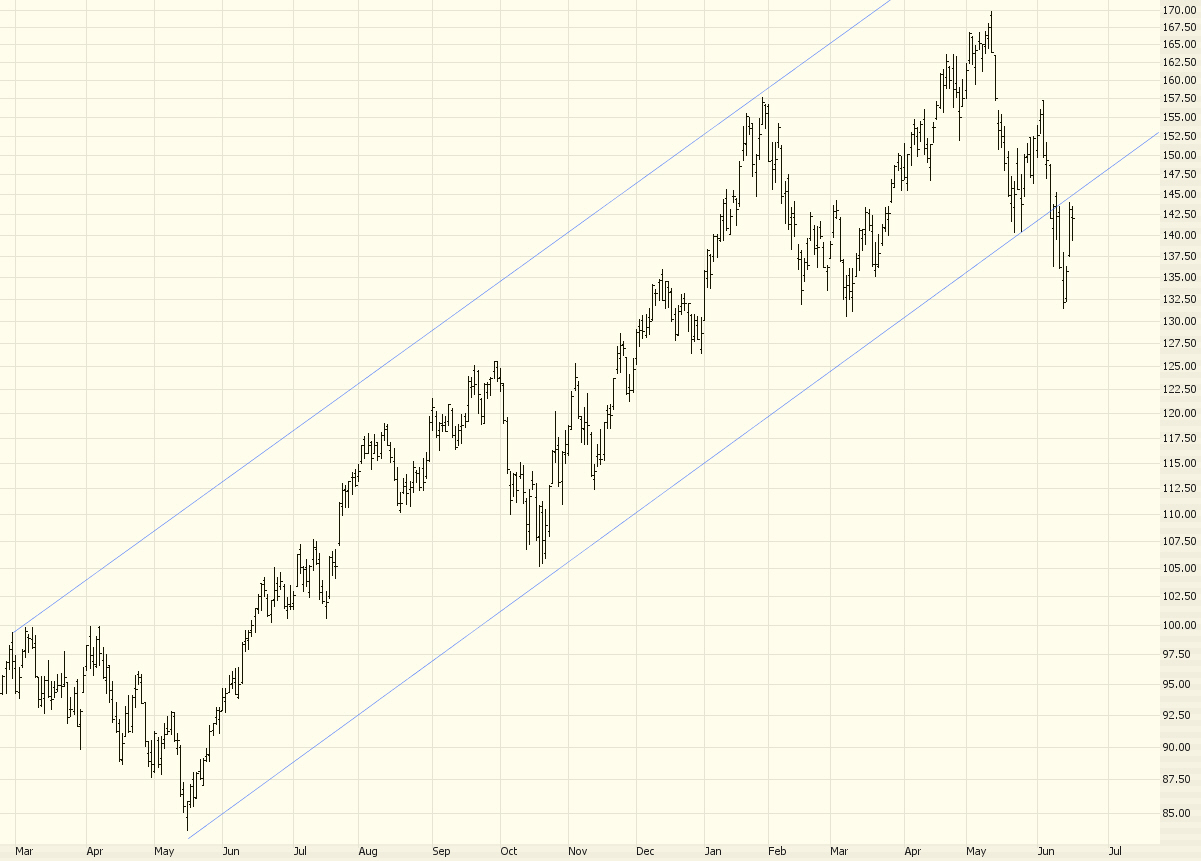
The Dow Transportation Index is a bit of a surprise. It had a breakdown earlier, but it's managed to shake it off. I'd say this is the least bearish of the major market indexes.


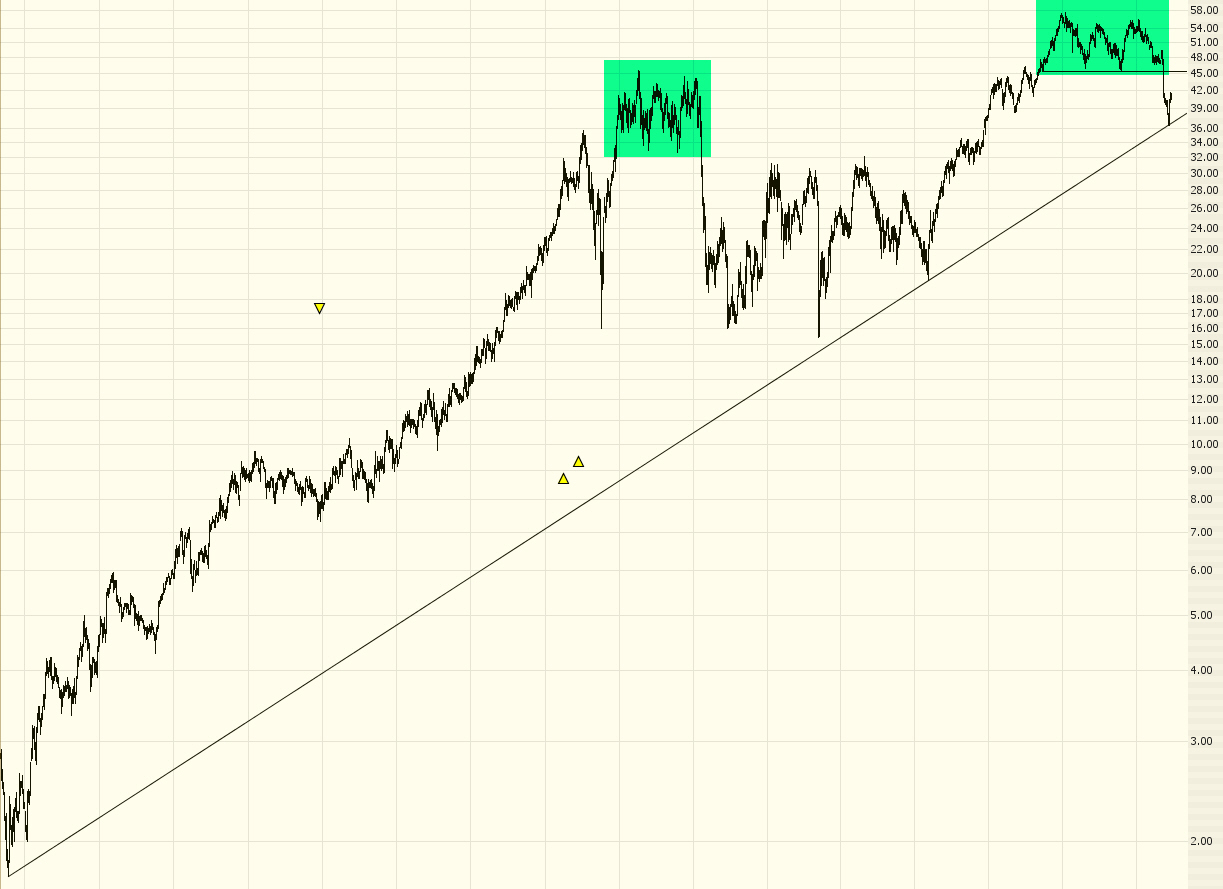
One nice thing about today's action is that it creamed the $VIX, which means that puts on the S&P just got a lot cheaper (in both intrinsic and premium terms). Notice how the $VIX has reverted to the median of its linear regression channel.


You might want to look in oil services for good short opportunities - or the OIH itself. To me it seems like this has shaped up as a beautiful bearish play.


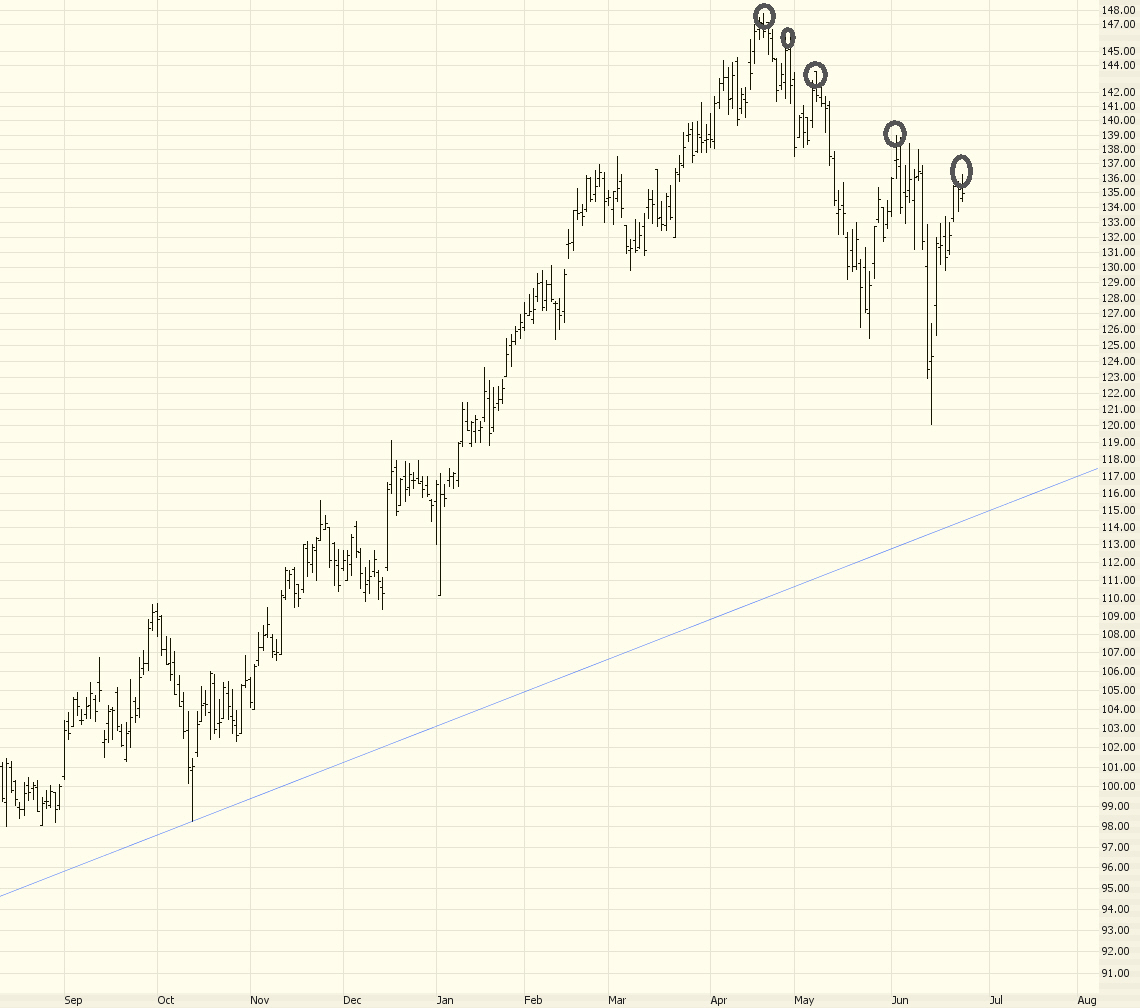
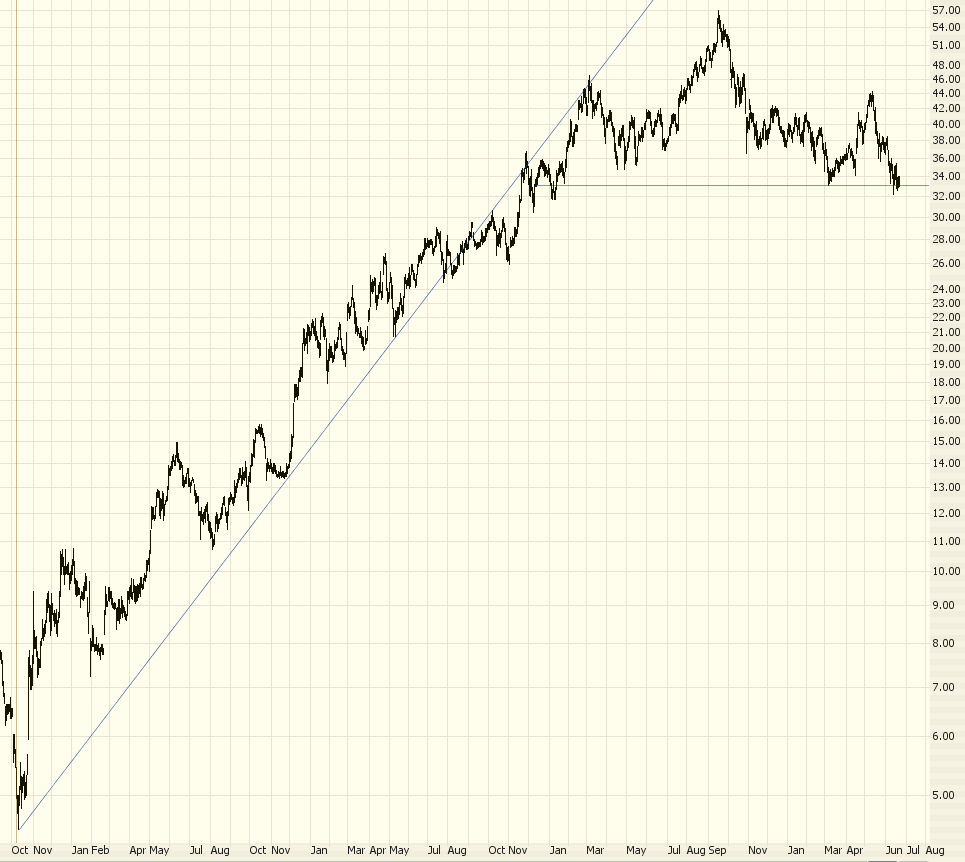
The same analysis applies to the Gold and Silver ($XAU) index. A rapid retracement to a broken support line. Looks great to me for some puts.


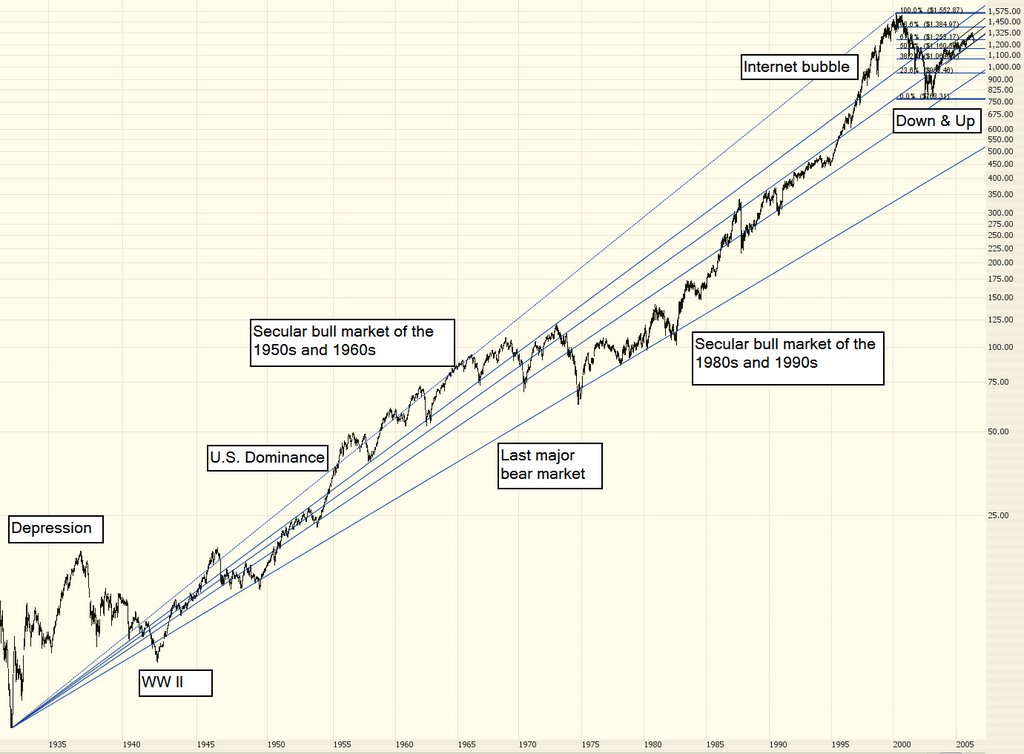
Take heart, bears. In the summer of 2000, even though in retrospect we can see the market was already going into bear mode, lots of stocks were reaching new lifetime highs. The bear market started in March 2000, but people didn't really cave in to it until later that year. Our best hope at this point for some serious damage will come from disappointing Q2 earnings, which start reporting next month.

In the meantime, don't let the fact that the 17th interest rate hike is probably the last for a while substitute as a great reason to rush into the U.S. equity market. It's idiotic.

Short this Sucker

If you are feeling brave, this might be a great time to pick up some DIA puts. This huge rally has pushed the Dow up against a trendline, and let's face it, it's hard to resist selling into a 200+ point rally.

Fib Wars

As the Fed's 2:15 decision looms, the market is doing something pretty fascinating. Looking at the S&P 500 index vis a vis the long-term Fibonacci line, it seems that the 61.86% retracement constitutes the current line in the sand (see green shaded area going back over half a decade).


You can see how significant this line is by looking at the recent daily history of the S&P. I've circled those areas where the market is flopping between considering the line either support or resistance (it is currently support, given today's strong upward movement).


To me, the intraday is the most fascinating of all. It never ceases to amaze me the power these Fibs have. This line goes back to early 2000! And yet is still holds power over the market.

What Would Constitute a Reversal

This morning's triple-point rally on the Dow puts the short-term bearish case at risk. If the Dow crosses above 11,131 (which is possibly in the post-Fed gymnastics) it will create a small series of higher highs and higher lows, as well as pushing the index well past a Fib retracement, that will seriously damage the short-term bearish stance. I've drawn an arrow to illustrate the possible new trend, should that level be crossed.

Tuesday, June 27, 2006

Powers of Ten

When I was a young boy, I fondly remember being transfixed by the short feature Powers of Ten shown at the National Air & Space Museum in Washington (the link shows you the same film). It's a completely mesmerizing piece to watch, even though it's about thirty years old and not exactly high tech (the cheesy post-60s spooky-synth music is a bit much).

This is the inspiration behind my posting today - to get a look at the big picture. In this case, the S&P 500 (which is a good enough proxy for the U.S. stock market in general). I'm delighted the Dow lost 120, of course, but I wanted to not make a daily report and instead remind us all what the theme behind my investing philosophy is: to take full advantage of what is likely going to be an extremely bearish market for years to come.

Let us first look at the past 75 years of the index, going back to the depths of the Great Depression. I've embellished this chart with a number of drawn objects as well as major historical themes. As always, click on any image to see a much bigger version.

In this instance, as you can see, there is plenty of room to fall. The bull market from 1982 through 2000 didn't create much in the way of a support zone anywhere, and in spite of what people might regard as a brutal bear market from 2001 to 2003, we are still at some extremely rich levels.


Now let's zoom in (hence the Powers of Ten theme) to the past decade or so. Here you can more plainly see the detail of the Fibonacci Fan as it relates to recent history, as well as the Fibonacci retracement levels. I've drawn an area to illustrate the likely path and speed of the market's fall for the next year or so.


Zooming closer, we see the support levels dictated by the Fibonacci lines. I've circled some likely zones to where the market will successively fall if weakness continues.


To me, the graph below is currently the most interesting, since it plainly illustrates how the index has not been able to conquer its current resistance level, and indeed, it has started to weaken. It would not takea lot of damage to the market for it to cut through that supporting trendline you see.


Finally, the minute-by-minute intraday graph gives us a view into the rounded top that has been forming. I've drawn a red line to illustrate the level which constitutes the top. If prices fall cleanly below this level, the odds of a continued fall are much stronger.


Everyone's fixated on Bernanke and Thursday's announcement. How tedious. Look, at some point, interest rate increases will stop. It won't save the market. Any more than 0% interest in Japan saved the Nikkei all through the 1990s. Expect the same, stupid spasm on Thursday after they announce that rates are up, or rates or down, or rates or unchanged, or Bernanke is going to shave off that stupid beard. It won't really matter in the end. It's just noise.

Monday, June 26, 2006

Stalemate

Boooooooooooring......

Earlier this month, I mentioned how things seemed almost "too easy" for bears. Well, I would like to have that problem again.

We seem to be, over the past several weeks, sort of stuck around 11,000 on the Dow. The red line I've drawn divides bullish control (upper) and bearish control (lower). It's just a struggle between the upper and lower halves.


I imagine until there's some clearer direction, my posts will be less verbose and less frequent. Because I don't want to talk about the market just for the sake of talking about it. As long as we're stuck in neutral, there's not a heck of a lot to say.

Carnival

From time to time I find an option that seems to be just about free.

One I've come across this time is Carnival (symbol CCL). Here's the chart; no broken trendline yet, but there seems to be a topping pattern completed (highlighted in green) which also seems similar to an earlier top that preceded a fall (other, earlier green).


At the moment, the January 2007 $50 put on this has an ask price of $9.40 (its symbol is .CCLMJ), and the stock is at $41. That means you are paying 40 cents for the time premium between now and seven months from now. To me that's ridiculous, and a great bargain. I bought some of these thing morning with a contingent stop price of $49.30

Q&A Forum

For those of you who subscribe to Barron's, check out this article on the bear market.

Here are some recent questions (and my answers) to recent posts. Thanks for your patience!

Mike: "Based in part on your targets and some things I've read from other experts I trust I entered into some short positions toward the end of the day...not a ton but some. My question is ... is there something specific you'd look for during the day tomorrow that would change your tune? For instance if Dow jumps way above this line? Like to know if there is a point at which you would exit your shorts and change your stance to one of an intermediate term rally as a few other sites expect (3 to 6 weeks)."

At this point, I'd step aside (and be very confused) if:

+ The Dow crossed over 11,132
+ The S&P 500 crossed over 1,259
+ The NASDAQ 100 crossed over 1,586

Rob: "Hi Tim, would you please tell us what positions (other than GOOG) you are currently in and what are some on your watch list?"

My positions are listed below. As for my watch lists, you can subscribe to them for free if you use Prophet.net by going to the Shared Watch List page. My screen name is "Blue Knight"


Brian: "Has BSC invalidated it's Head/Shoulders pattern by breaking up over the neckline after breaking down below it?"


I don't really consider this a head and shoulders pattern. I would say the downtrend of this stock remains intact, in spite of last week's strong performance. The price crossing above $139 would change that view.


Andrew: "1. Do you have a timeline for the release of ProphetCharts?

2. looking at the Shld chart it looks lie a cup and handle. Now after what I thought was a handle it made a breakout attempt that failed. It also now may be on the verge of an island reversal(not yet confirmed). OK now the question. Can the cup an handle be considered a failure at this point because it made that higher high and then broke below or would we it still be in the handle stage?"


ProphetCharts is going to be part of the new Investor Toolbox. We're going to start slowly releasing that into general production late in the summer.

As for SHLD, yes, it's a cup and handle - - but I think it's failing. And a really shapely bullish pattern which fails often makes for an even better bearish trade!

Anonymous: "Question about shorting. When is it that you have to cover your short before you are "forced" to cover by a short squeeze. For instance if I short SHLD at at $150 and it moves to $165 what are the chances I will be squeezed out of my position and be "forced" to buy back my position at a higher price?"

I don't really think of it in terms of being forced. To my way of thinking, it's all about setting a stop order (or a contigent stop) based on the chart. Where this price is depends on the nature of the pattern. For SHLD, my stop price would be anything above 167.95, simply because crossing above that would validate the bullish saucer pattern.

Brian: "Two big questions.

1) Why do you draw trendlines touching just the price extremes? Some say trendlines should be drawn through congestion areas, ignoring the more panicky extremes. I have noticed that when I draw two trendlines on the same chart, one through price extremes, the other through closing prices, they both seem to be valid, but it creates a lot of confusion regarding proper placement of stops, and calculating my chances of better entry points.

2) I am using Prophet Java Charts through my Scottrade account. I can't save trendlines to use the next day. It would be so much easier if I didn't have to keep redrawing trendlines every day (also, would make me less susceptible to fudging trendlines to fit the current situation). Why can't this be done?"


I don't have any scientific basis for my trendline technique, but I confess to being a bit of a purist. I don't want my trendlines to go going through any price bars because, in my opinion, that invalidates the trendline. The whole point is to watch for new price action to cross beneath or above a long-term trendline. Some days have extremes, sure, but that still represents legitimate price action (assuming the data is clean!)

As for Scottrade, I believe they are using a relatively rudimentary version of the product. Some licensees of the product (such as optionsXpress) enjoy the feature that retains all your drawn objects. You could also take the approach of subscribing to Prophet.net. I agree with you - - redrawing trendlines every day would drive me nuts.

Saturday, June 24, 2006

Q & A is Coming

For those who may be obsessively checking this page, I'll be making a post this week of recent questions and answers. I'm focused right now on our son's 5th birthday party, which takes precedent over charts! I'll be back to you later this weekend. Go have some fun...

Thursday, June 22, 2006

A Few Juicy Charts

Between my recent mentions of teenage sex, "juicy charts", and Abby Joseph Cohen, you may all thing I'm sex-obsessed, but it's not true. My true self returns. Here are some lovely short ideas for you.

Boeing (BA)


Bear Stearns (BSC)


Cummins (CMI)


Massey Energy (MEE)


Sears Holding (SHLD)


Simon Property Group (SPG)


Union Pacific (UNP)


As always, click on any image to see a bigger version. Except Abby's, which will cause a recursive deletion of all your files.

Sex & Guilt

It occurred to me this morning that these bear market rallies are a lot like sex when you're a teenager. For the bulls, it's exciting. It's fun. And it's over really, really fast.

So again we find ourselves sinking (not a ton, but some) after a one-day wonder. Good.

Now for the guilt. I'm feeling guilty these days because:

+ I don't have as much time for the blog as I'd like

+ People are asking questions which I don't have the time to answer (what I really need to do is get some kind of forum set up that tracks unanswered questions so at least I don't have to dig for them)

+ I haven't posted any good charts for a couple of days.

Oh, my poor tormented soul. Hang in there, folks. Don't foresake me. Great charts are coming soon. I can't promise you your teenage sexuality back, though. That's gone for good.

Wednesday, June 21, 2006

So Now What?

I picked up a copy of Barron's today, and there's ol' Abby at the Round Table again. I thought we were harsh enough, but I just have to point out the performance of the picks she offered six months ago. Now remember, ladies and gents, this is a very famous, very public, very highly paid analyst who is the Chief Investment Strategist at one of the world's largest banks. She's got unlimited access to resources and information.

So how did this person do? Was she up 10%? 20%? More? You might expect it. No, her picks provided a negative .39% return. Ummm, Abby, what is it exactly you are paid for? It sort of reminds me of Warren Buffet - he is heralded as a genius (and, make no mistake, he's an incredible business man), but his stock has changed 0% from February 2004 to present, a period of well over two years.

In case you're wondering what Abby's picks were, they included Microsoft and Cisco. You heard me right. I can't think of any more boring stocks to choose. Of the 10,000+ equities you could choose, do you think you would pick those dogs? I wouldn't. Nice goin', Abs.

As for today, it was rough. The Dow was up over 150 points at one time. It eased back a bit and closed up "only" 104 points. Hey, on a day this painful, I'll take what I can get!

So what does this mean? Does it mean a bold new bull market has started? Hell, no. Does it mean we've reached the bottom of the ascending channel and are ready to move up again? (See chart below, with the red circles showing a series of higher lows). I sure hope not because that looks like a seven month process before we would start heading down again! Does it mean we simply retraced to a resistance level and can resume the fall down in earnest? Maybe, but it's not guaranteed. Or it could break down and get serious about being bearish.

Ouchie!

Well, the baton has been passed (for the moment) to the bulls. If you think this is a one-day wonder, you might consider the DIA puts with a stop at 112.85 (I've put in green the retraced H&S pattern below). But, make no mistake, this day belongs to the bulls, and it could be the start of a multi-week lift. We'll drill down into it deeper tonight.

Right & Wrong

You could say the market is at a crossroads. But every day is a crossroad with the market. Because each day tells a story.

What's key now to those of you who may just happen to be bears is that the market is relatively beaten down based on the trading history of the past year. The easy, obvious thing for the market to do would be to shake off its worries and move higher.

It would take some serious selling to push the market lower at these levels. But it absolutely could happen. Here's what I suggest are the prices that, if crossed, indicate bearish or bullish short-term movements for a few key indices.

Dow: Bearish crossing below 10,907 (REALLY bearish crossing below 10,698)
Dow: Bullish crossing above 11,058 (and I'll be really cringing if it goes above 11,286)

Transports: Bearish crossing below 4,410
Transports: Bullish crossing above 4,790

S&P 500: Bearish crossing below 1,219
S&P 500: Bullish crossing below 1,259 (and we're in real trouble if it goes above 1,291)

Looking at the chart of the Dow 30, the fact that we've got a nice clean head and shoulders (albeit a smallish one) and have absolutely broken below a three-year old ascending trendline both speak well to the bearish cause.

Tuesday, June 20, 2006

Dear Abby

Here I am once again at SFO waiting to hop on board a plane. I thought I'd dash off one last little post before the day ended.

So what's the appeal of this person?


Yes, that's right: Abby Joseph Cohen. Omnipresent panelist on Barron's Roundtable. Persistent guru of all things equity. Head strategist for Goldman Sachs.

So how does this person merit her seven-figure salary every year? Is it her rugged masculinity? It's certainly not her track record. Any analyst that was as consistently bearish as Abby has been bullish would be labeled a crackpot. Such is the bullish bias of our fading republic.

Crossroads Again

Greetings from bucolic Palo Alto, California.

It seems the Dow is clinging to its former support (now resistance) line once again like a magnet. To 99% of the population, the market is having a great day. To those armed with good charts, it's clear to see we're simply at a crossroads again, where it's unclear whether bulls or bears are going to own the short term future.


In the recent past, the Dow's attempt to break out (followed by a failure) has been a critical component to the downdrafts we've been enjoying. The Dow moving above 11,057 would change my tune for the short-term.


If this micro-rally fails and we bust through last week's lows, I'd say the next target for the Dow is about 10,450.


A reasonable downside target for the S&P would be about 1,170.


And the Transports at about 4,300.


I am quite confident we are going to end the year below 10,000 on the Dow. As for the longer term (say, 2007 through 2009) my crystal ball is really fuzzy. A down market, yes, but how far down is unclear. So let's take it a day at a time, shall we?

Monday, June 19, 2006

A Clear & Present Danger

OK, this isn't the slam dunk I was hoping. The market was weak today (down about 100 points) but has recovered some. Worse, there is a plausible argument to be made for a short term bottom at this point. Notice this bottoming formation. The market has to be firmly and decisively weak tomorrow. Otherwise the bulls might be slowly pulling that baton away.

Attack

Here's what I'd suggest. Buy as many July DIA puts as you can possibly afford. Set a contigent stop at any price over 110.94. Simple as that.

Die, bulls, die!

Friday, June 16, 2006

Good Enough.....

The market's rebound fizzled out today. This is how rallies are in bear markets - quick, fast, explosive, and short-lived. The Dow ended up basically unchanged today (down .62 points) - here's the intraday graph, where it just bobbled up and down through the day.


What's fascinating is that the resistance it's bumped up against is the very long term trendline going back several years; the blue line you see in the intraday graph corresponds to the long blue line on this daily multi-year graph.


I've put green highlight at the next target for the Dow - about 10,450 or so. It's based on both Fib and classic H&S measurements. Plus it feels right.


I've likewise laid out a target for the S&P.


Stock analysts are paid a fortune each year for completely worthless advice. I'm going to give you some valuable suggestions for $0. Shorts. Or Puts. Enjoy the ride. Here we go:

Bear Stearns (BSC)


Caterpillar (CAT)


Cummings (CMI)


Diamond Trust (DIA)


Hewlett Packard (HPQ)


Monsanto (MON)


Oil Services Sector (OIH)


Union Pacific (UNP)


Wellpoint (WLP)


Let's maul 'em next week, guys 'n' gals. Have a good one...