Thursday, November 30, 2006

Isn't It Epic?

What a day! The bulls and bears are in an epic battle. First the market went up. Then it lost its footing and fell. Then it was down nearly 60 points. Then it erased all those gains and pushed up nearly 50 points. Then it fell yet again for the Dow to have a loss for the day! It's just getting shoved all over the place!

The market definitely "feels" different. I think this Monday's tumble has freaked the bulls out a bit. Our bullish friends aren't quite as cocksure as they were before. It's a nauseating battle for control.

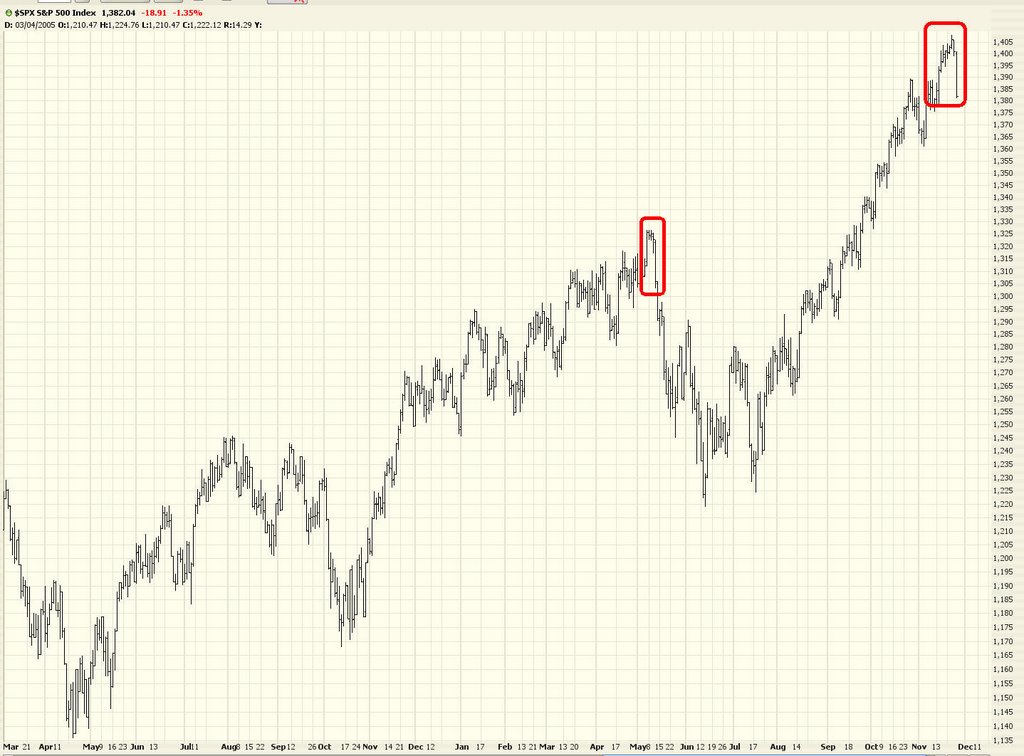
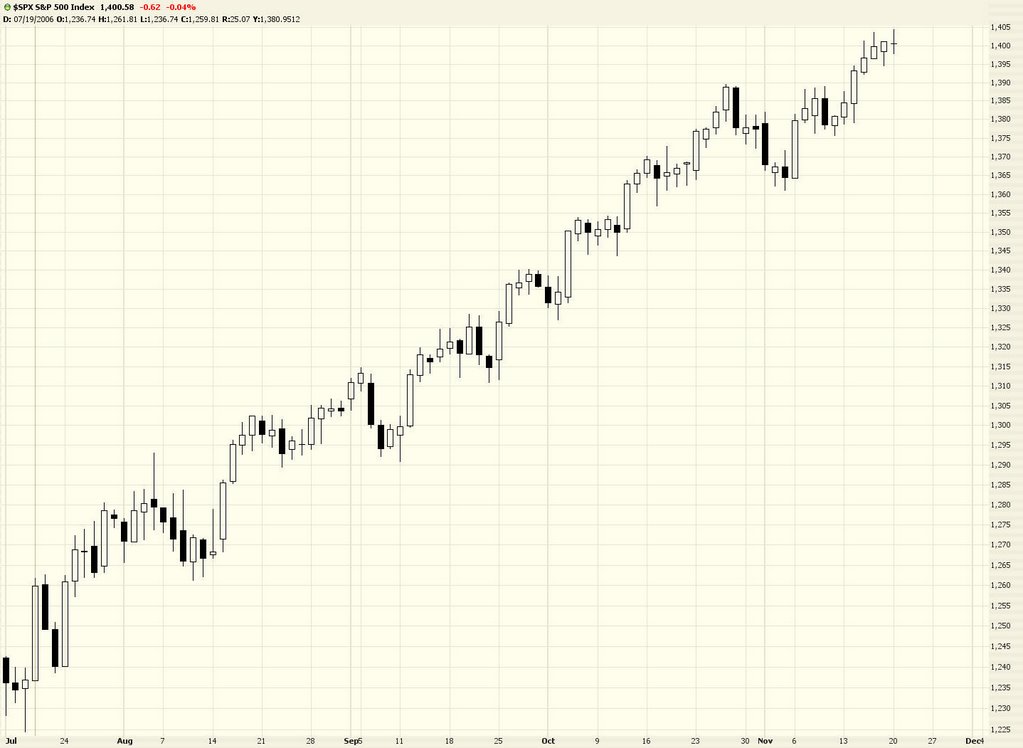
The candlestick graph of the S&P 500 shows a big honkin' spinning top for the day, which is the very essence of the uncertainty going on. Neither side is in control. Know this: if we take out the lows from Monday, the bears are going to have the upper paw.


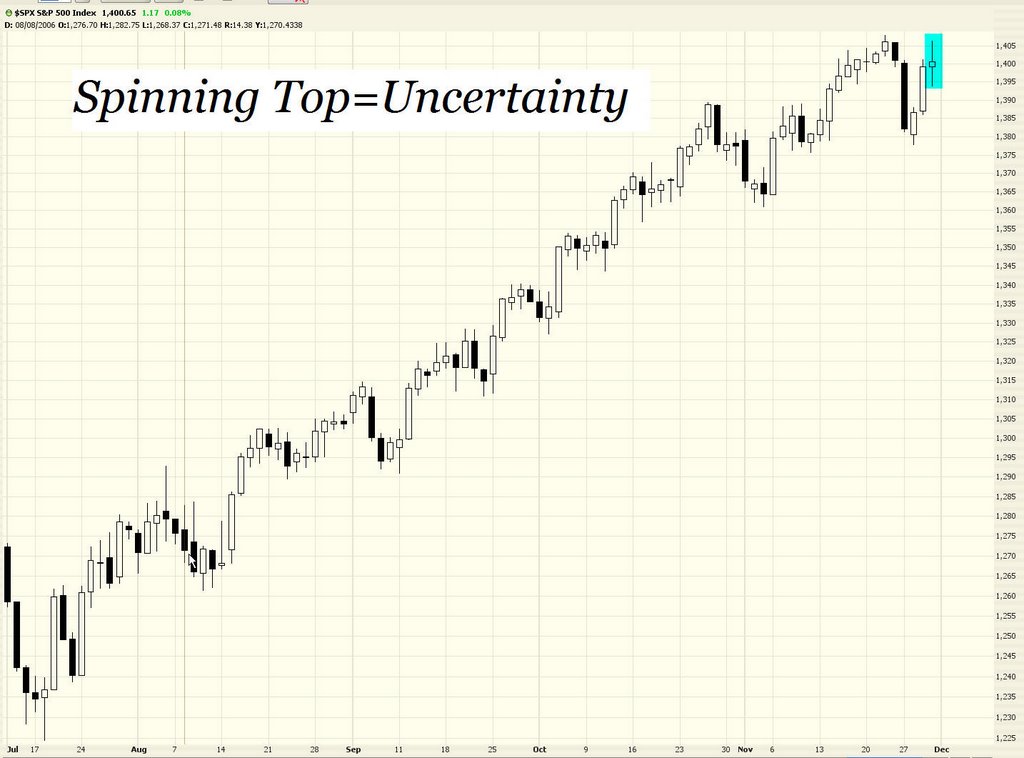
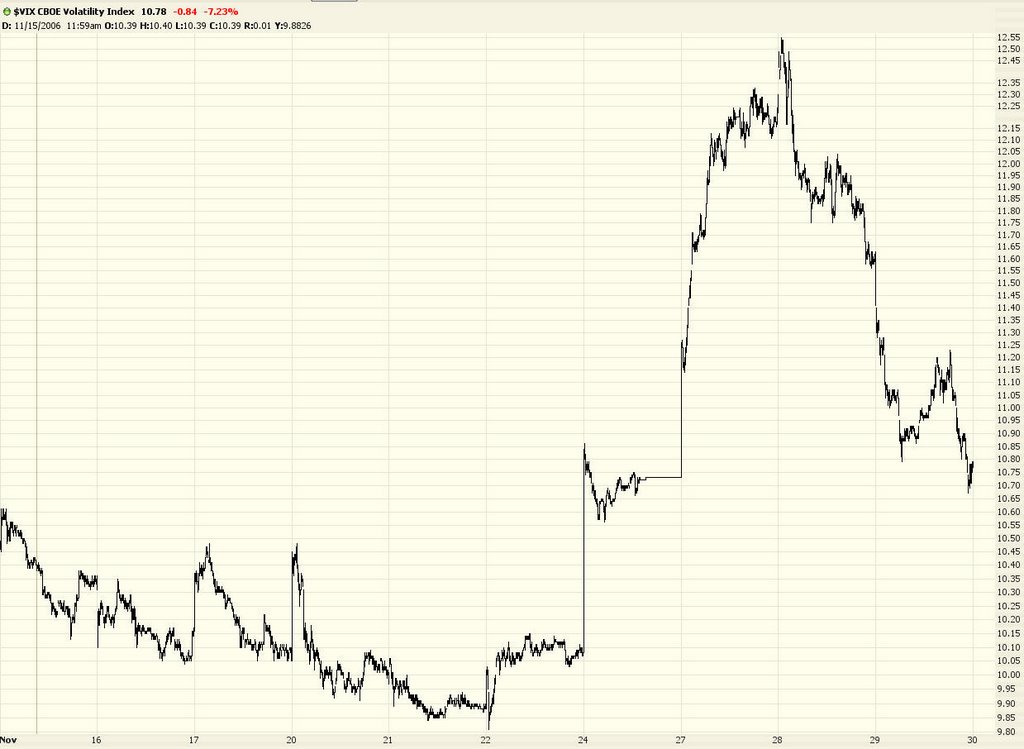
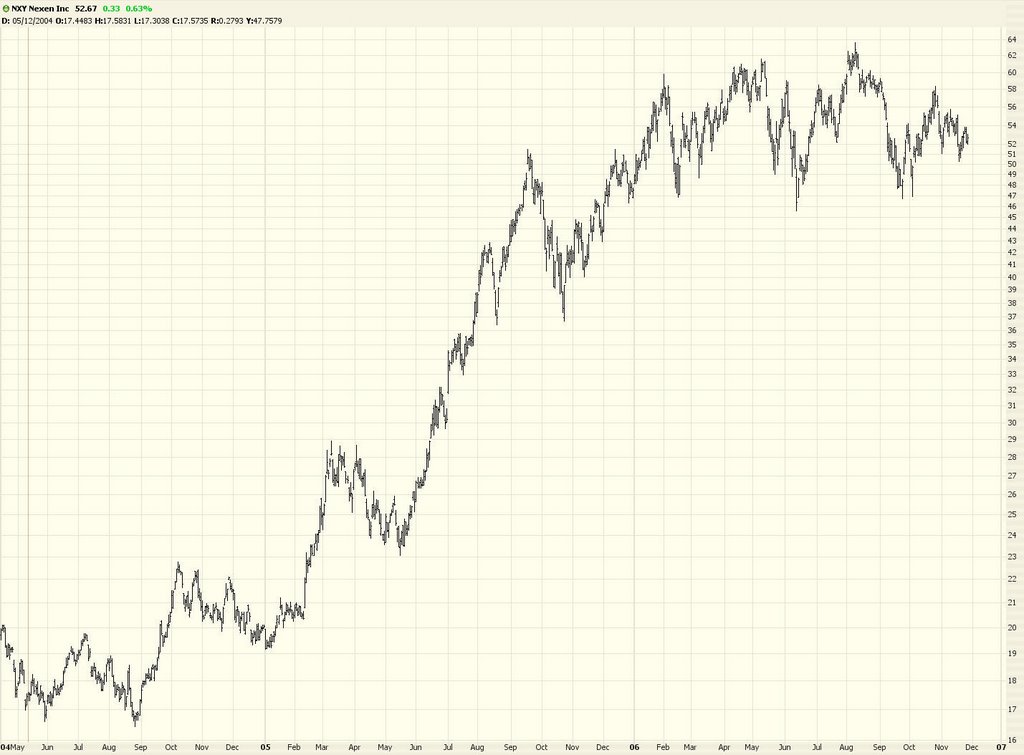
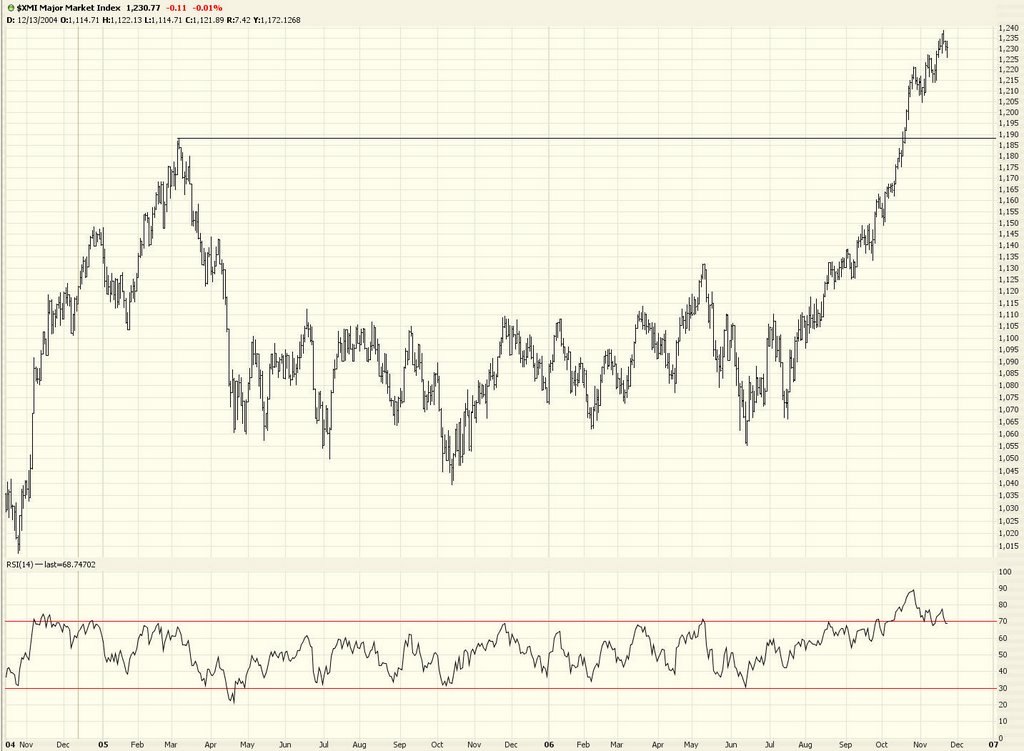
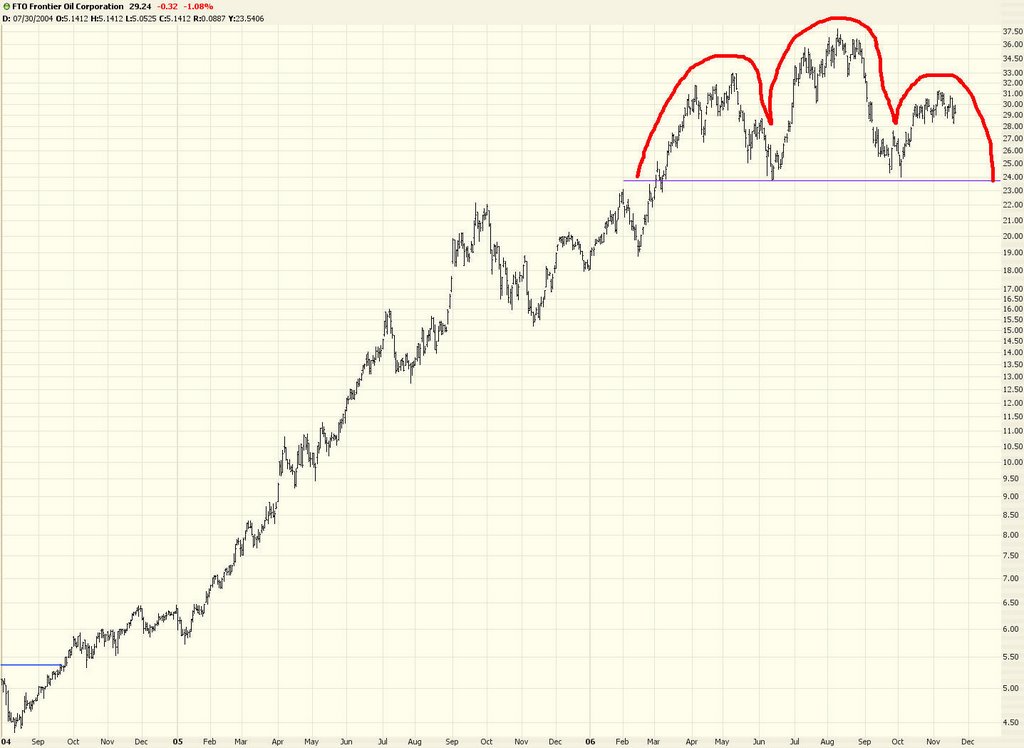
The purported reason for any recent weakness has been the U.S. dollar, which has tumbled again lately (take a look at the highlighted area below). I've drawn a horizontal line indicating the support level which, if taken out, will really start to freak people out.


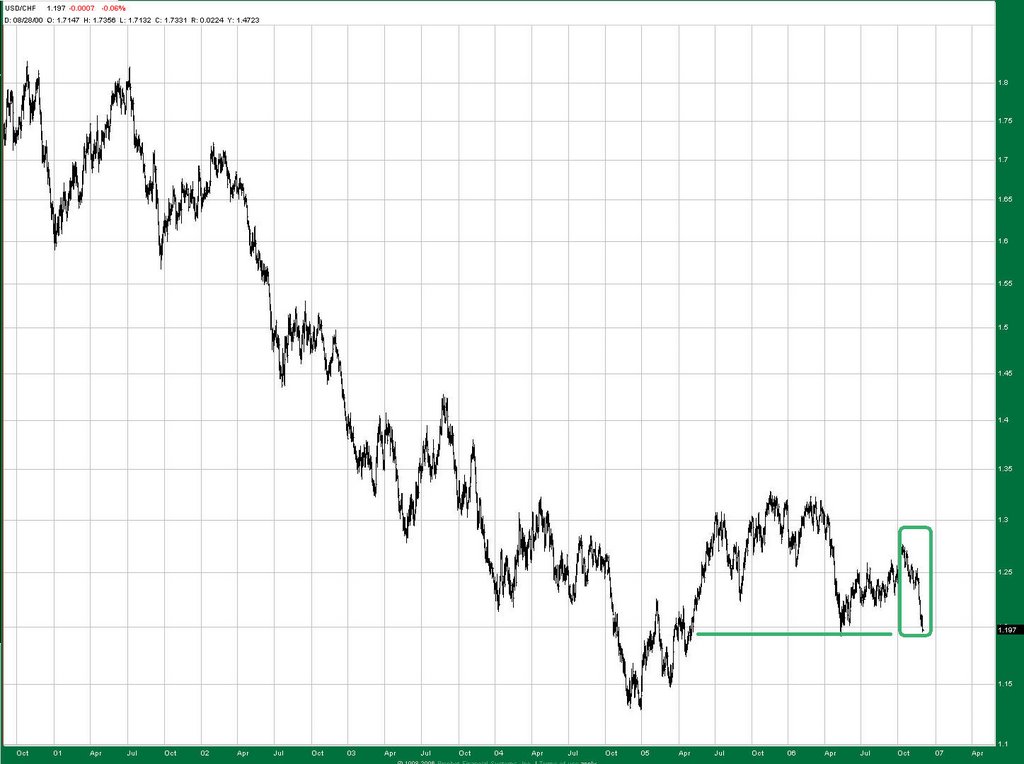
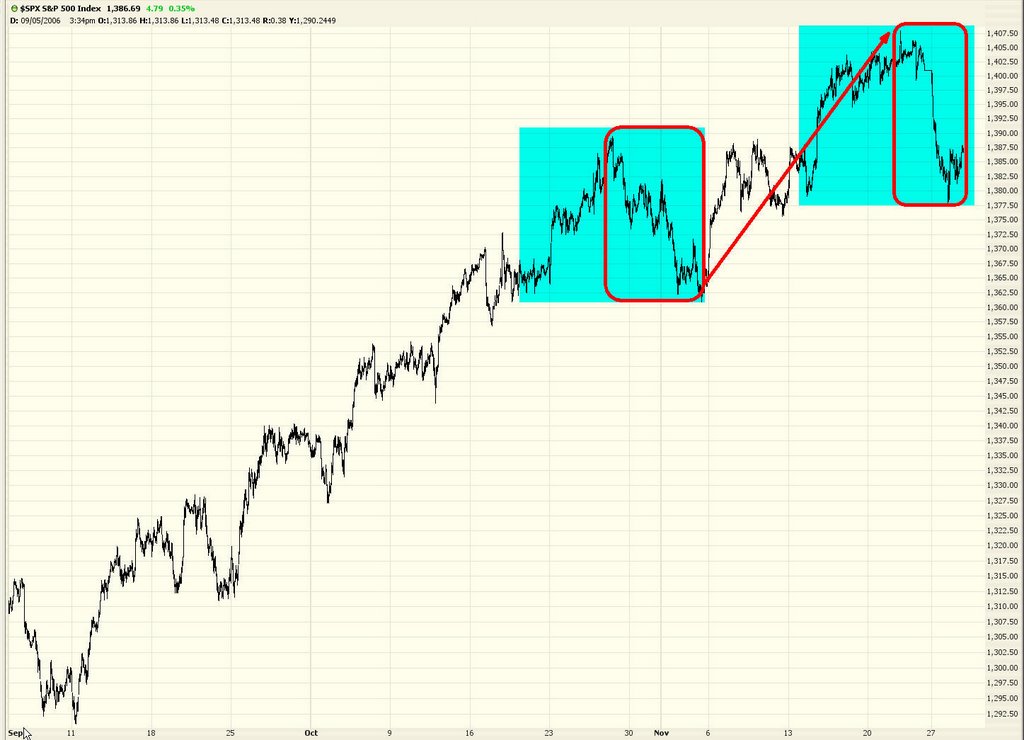
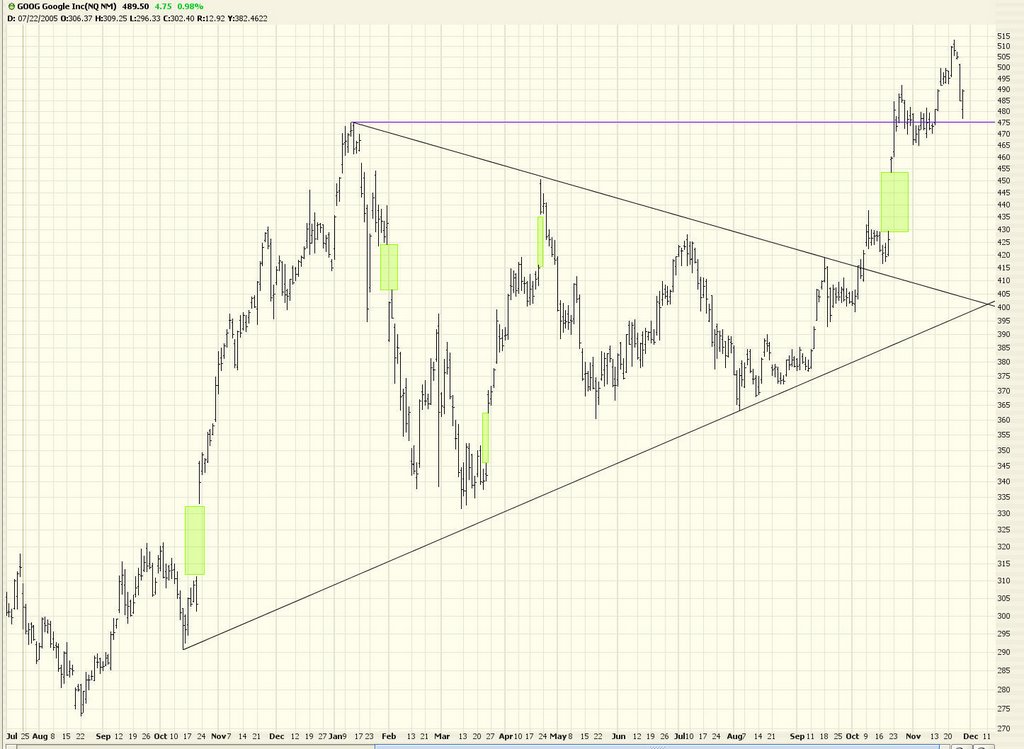
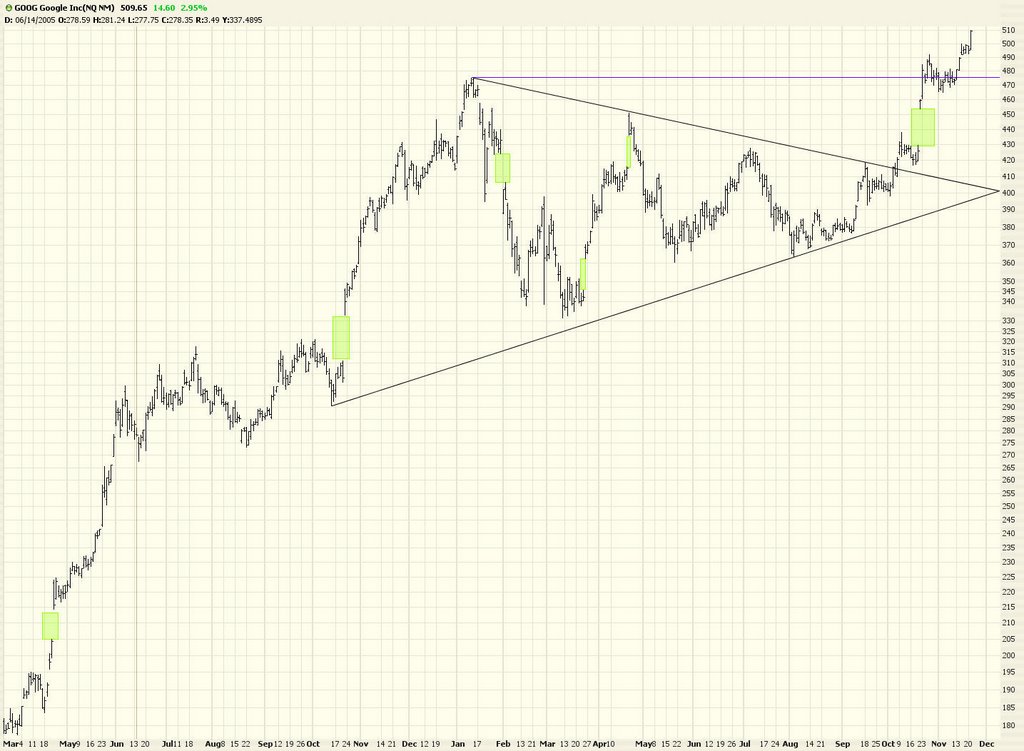
Just to drive the point home, the S&P 500 has played the "I'm falling! No, I'm moving to new highs!" game before. Take a look at the areas I've highlighted below which shows quick tumbles recently. We saw what happened last night. Let us pray to the ursine gods above to have mercy on us sinners.


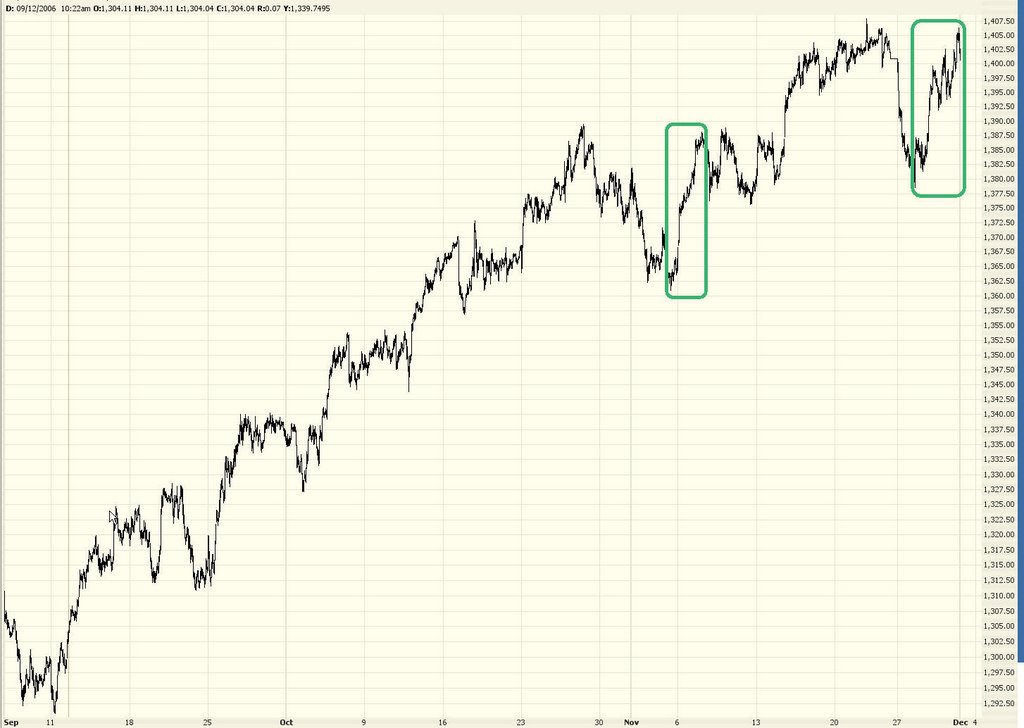
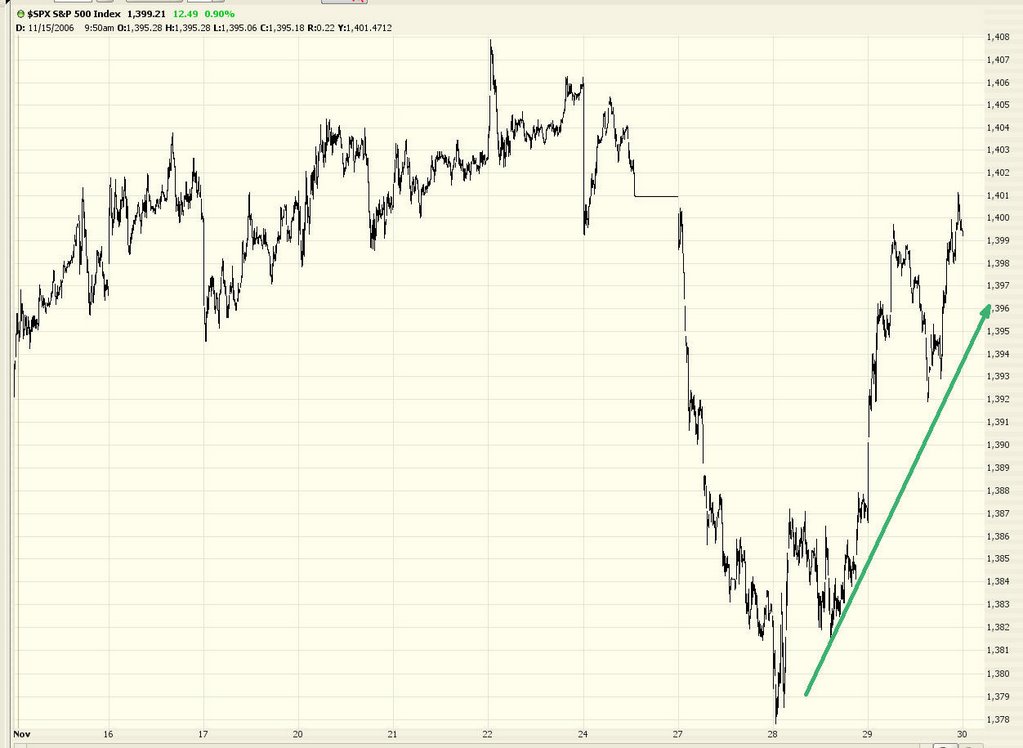
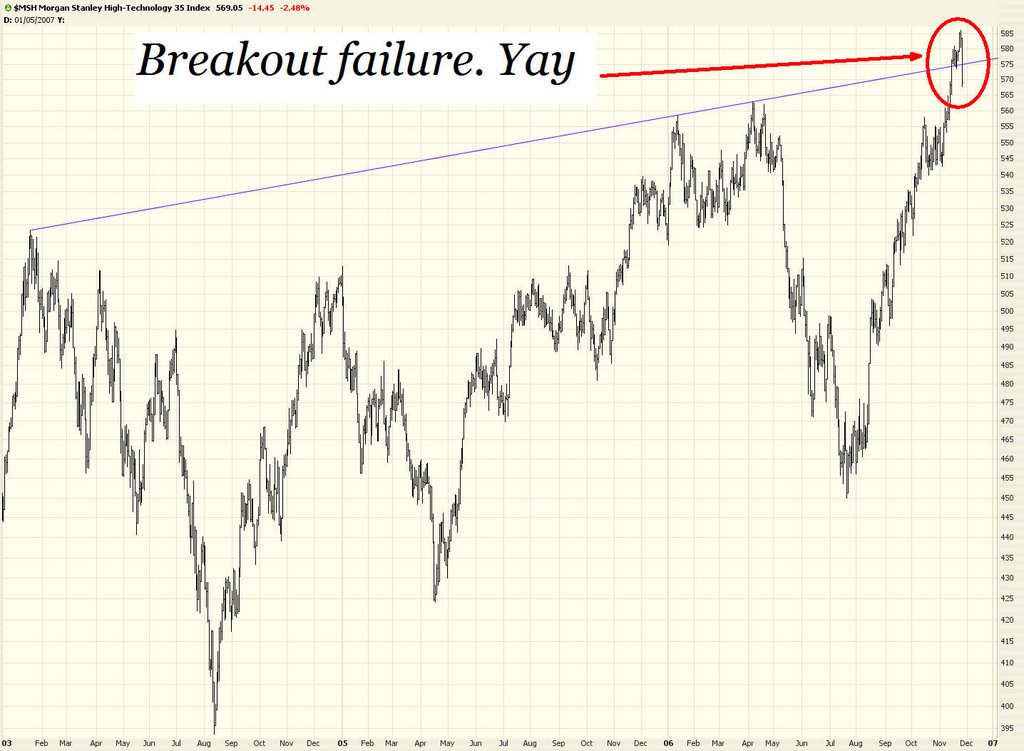
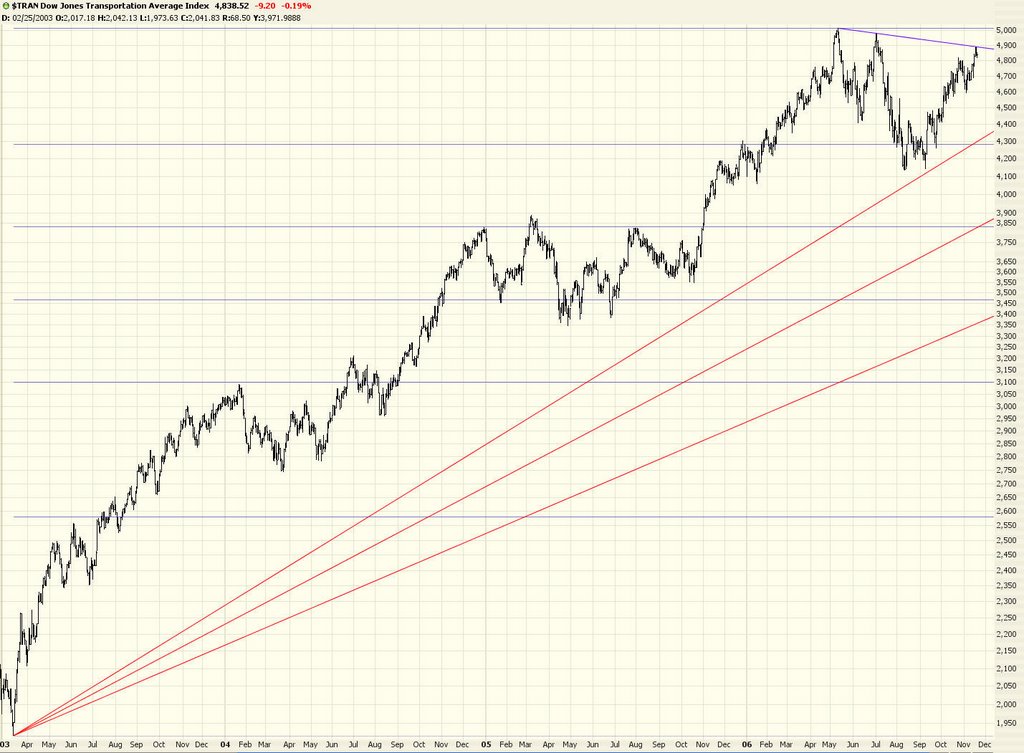
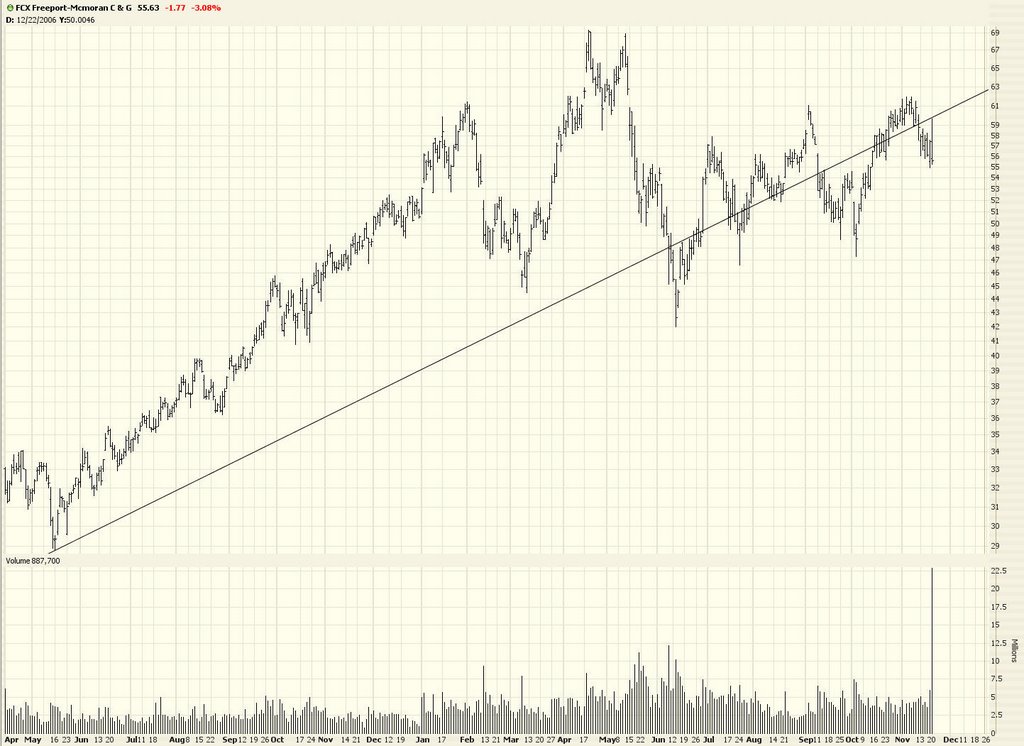
Like I said above, the market feels different. I think the chart below shows why. The unrelenting, horrible uptrend we've been burdened with was snapped Monday. As the lines indicate, this could be the day where the uptrend ended and the downtrend began.


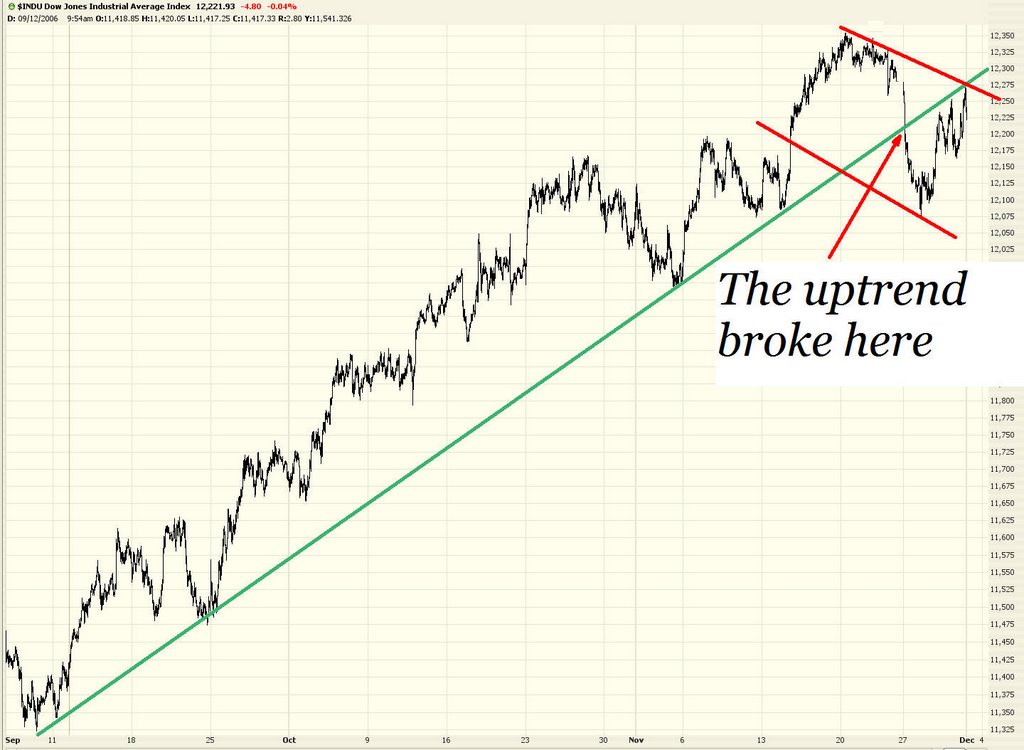
A closer look just shows how fierce the battle is being waged. These is a minute bar graph. Just look how wild these swings are!


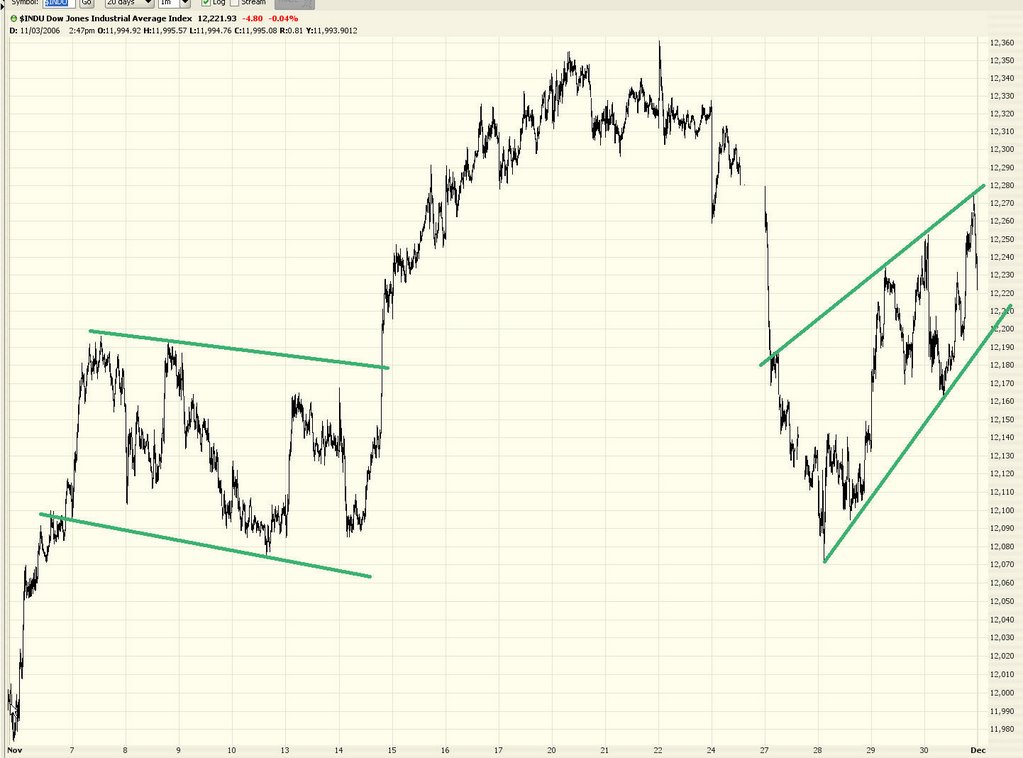
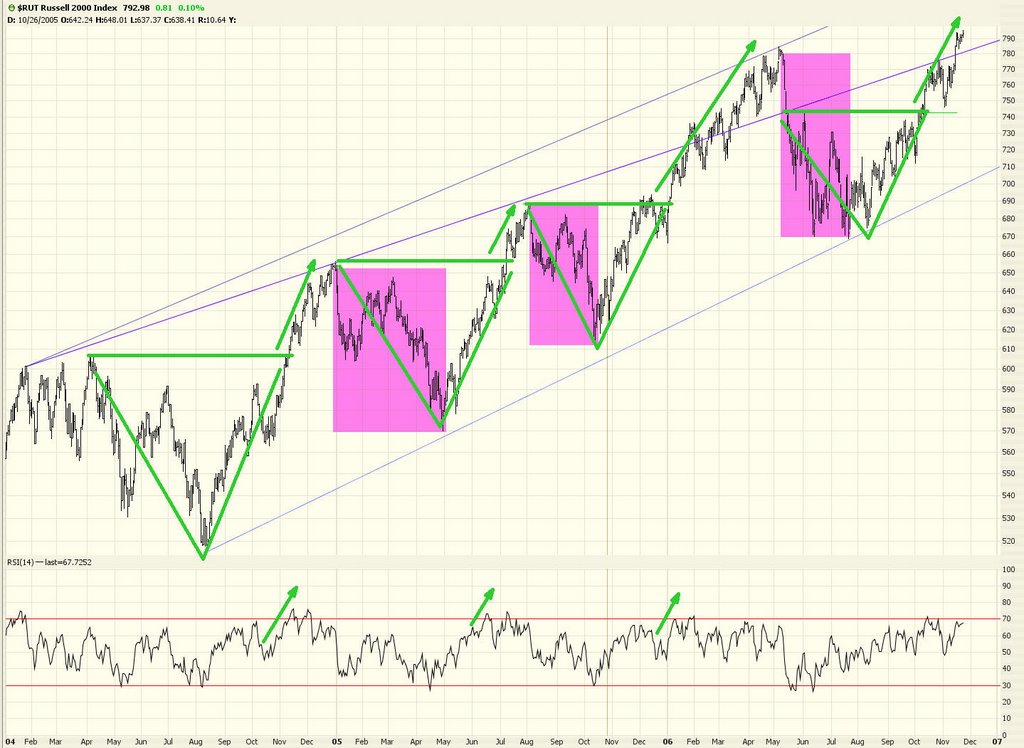
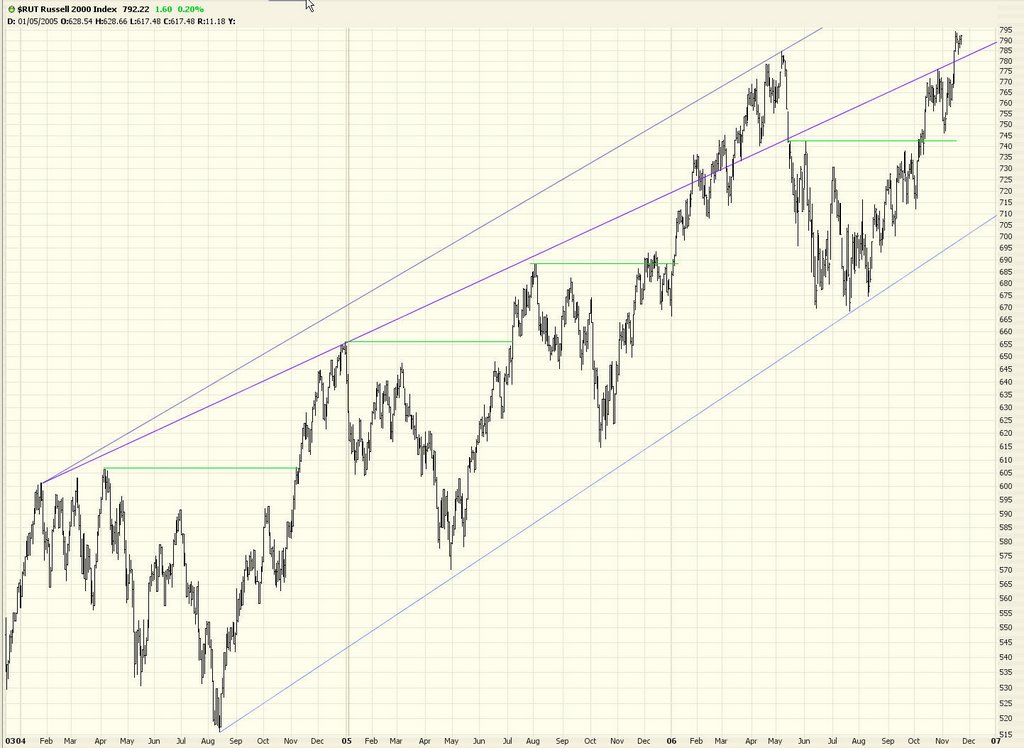
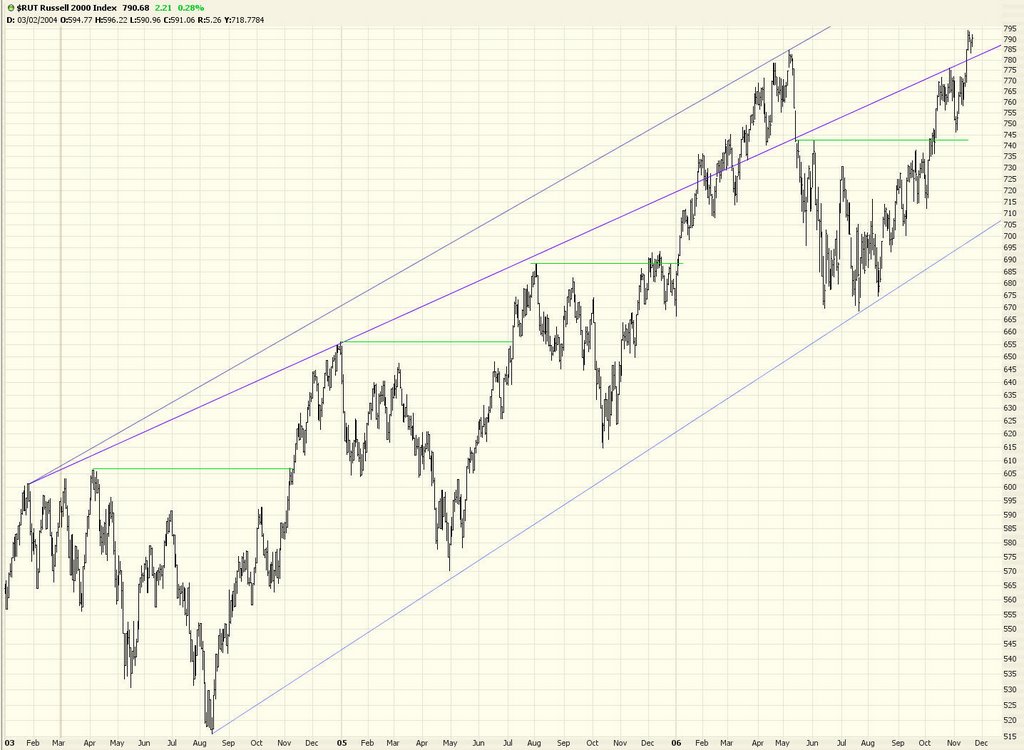
A daily graph of the Russell 2000 ($RUT) makes me think it would take a supercharged rally to elevate the market into new high territory again. The psychological damage done by Monday was pretty bad on the bulls.


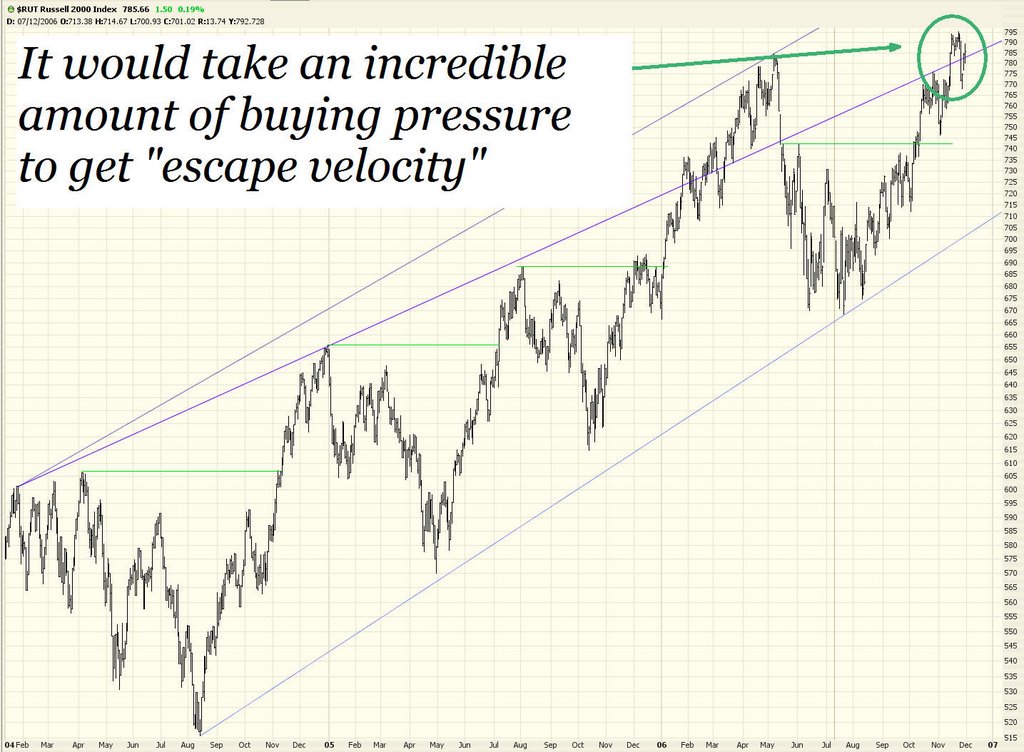
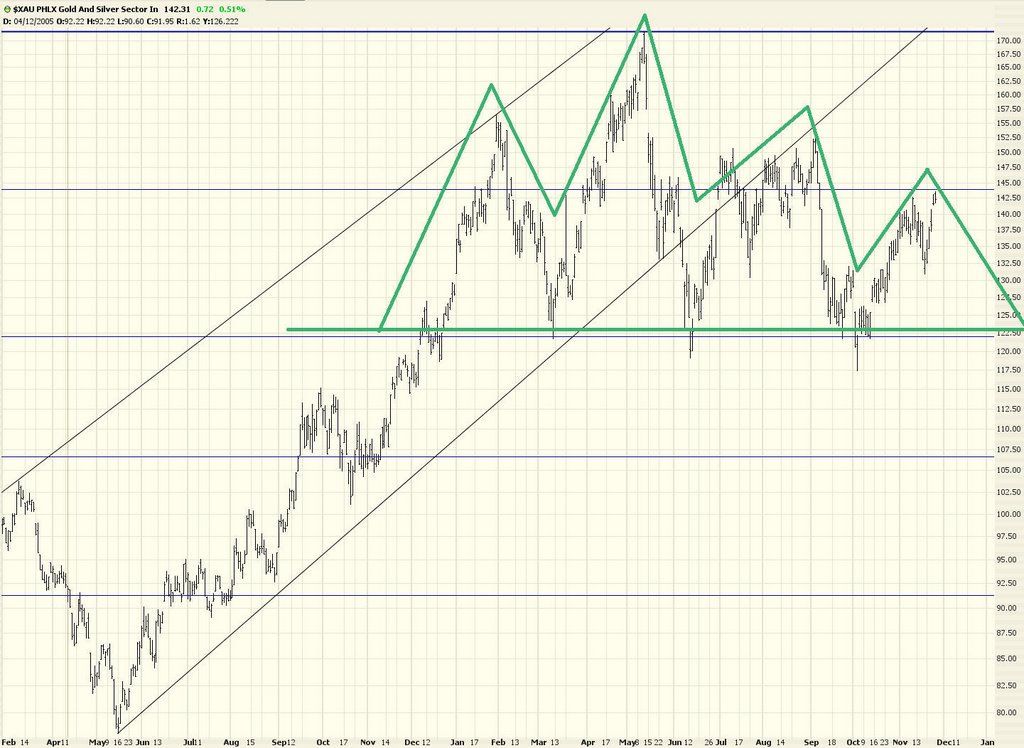
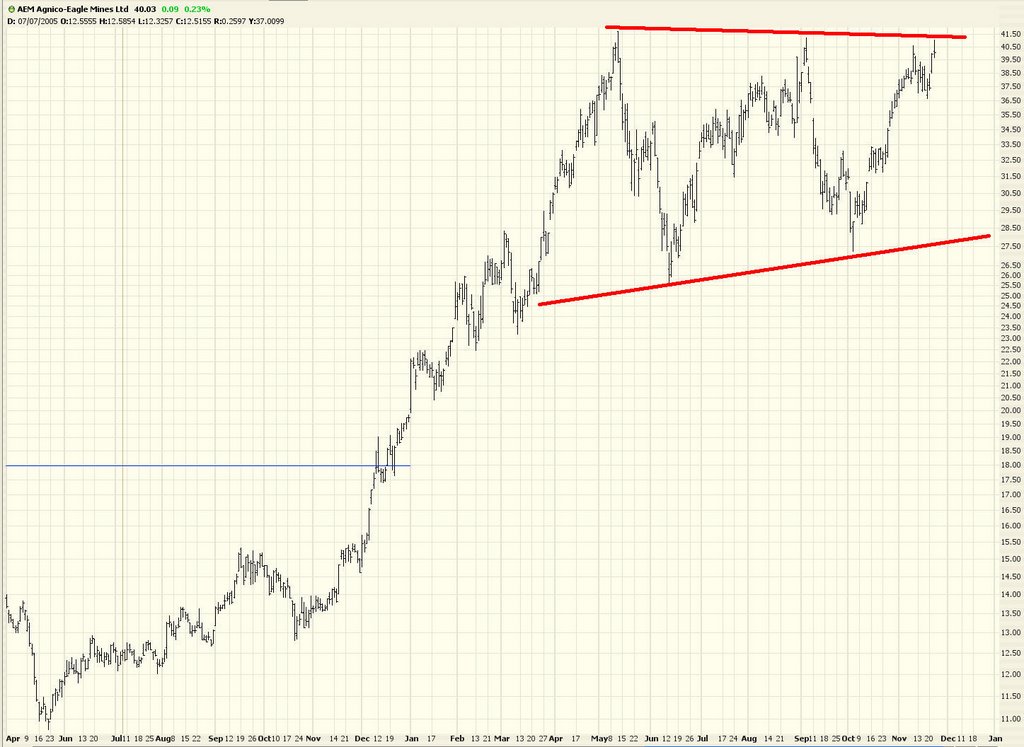
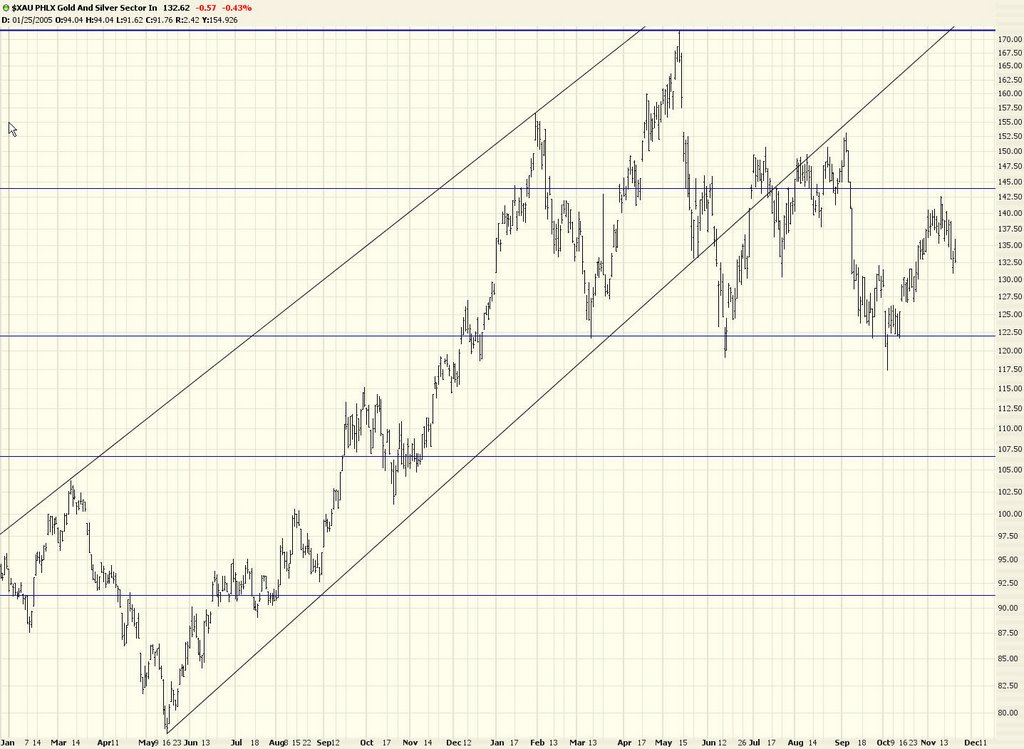
One short that's been getting bludgeoned has been gold. In my defense, I never said this was a slam-dunk pattern. It was on the fence. But recent strength has been staggering. This position is close to getting shuttered.


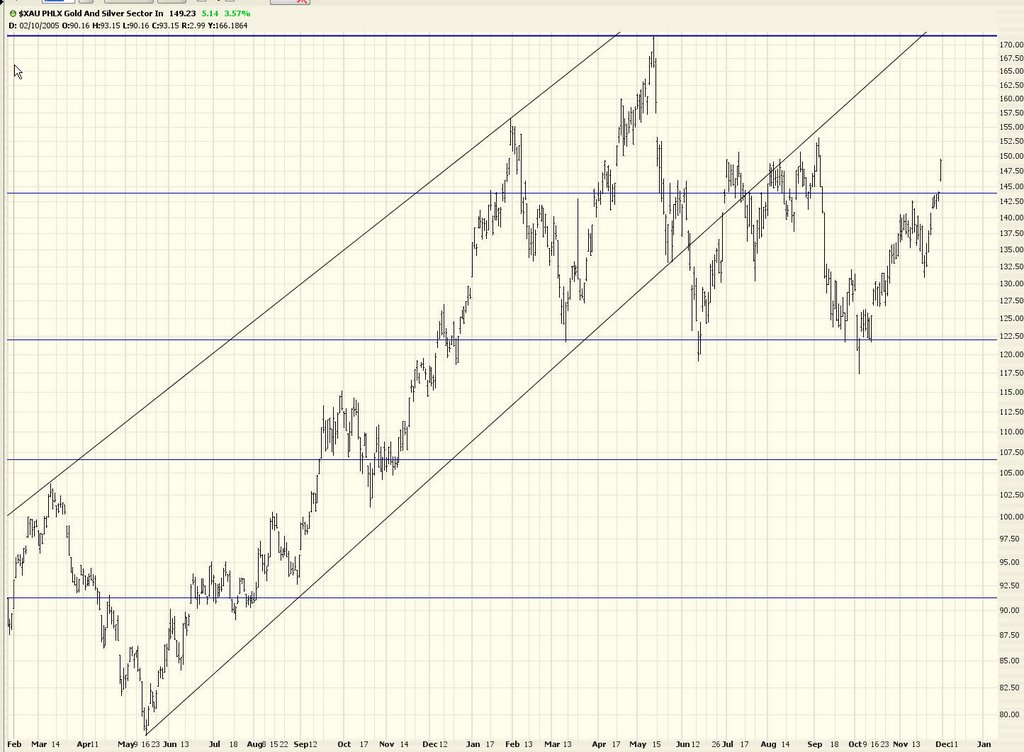
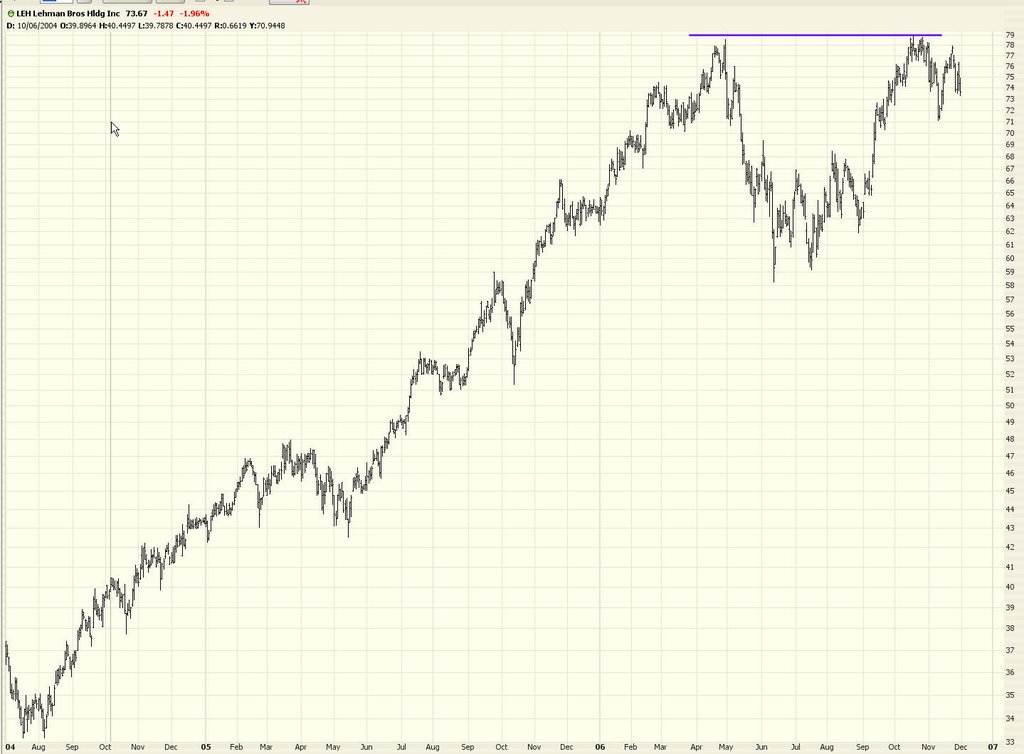
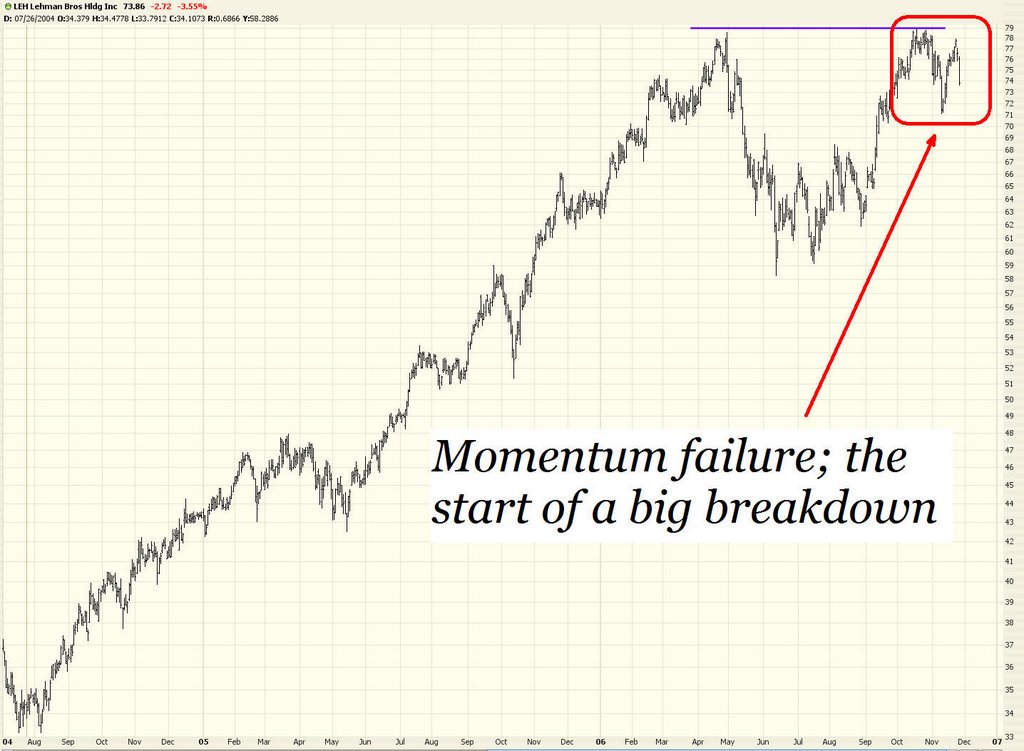
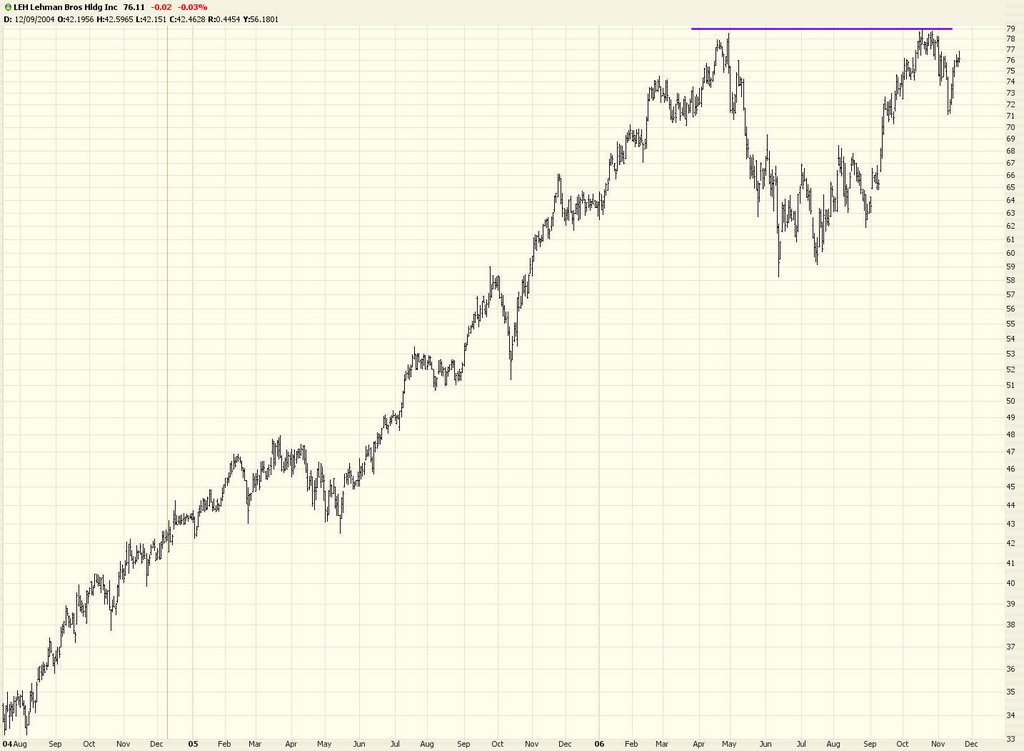
Just one stock today - one I've shown before - Lehman Brothers (LEH). This continues to be weak. Nothing sensational. No collapse. Just a nice, steady weakening.

Wednesday, November 29, 2006

Recovery Holding Firm

Today's entry is going to be on the short side, since I've spent most of the day sitting in either airports or on airplanes.

As you well know, the market made an earnest move higher today. Around the middle of the day, it looked like the recovery was softening (the Dow went from up over 90 to up about 45 or so). But then the bulls got their feet back underneath them and pushed it to close near the high of the day. Disappointing. A failed recovery is exactly what we bears need right now, and we didn't get it.

Here's a daily graph of the Russell 2000. The market could easily push into new highs (yet again) in the next day or two. That would make memories of Monday's fall completely vanish.


Here's a closer view of the NASDAQ 100, and you can see here how helpful Fibonacci retracements can be, even on an intraday basis. I've drawn the Fib from the recent high to the low on Monday. You can see today we pushed up to a 50% retracement, fell back down to the 23.6% level (pretty much right on the nose) and then back up to 50%.


The graph of the S&P shows a similar behavior. This graph shows more time - the past ten days instead of the past two - and you can see here how we're at a crossroads. Either we break recent highs and go into full-blown bull party again, or we snap below Monday's lows, in which case - - finally - - we poor, beleaguered bears will get a bit more control over this market.


As you might imagine, the rise up in the market today and (to a lesser degree) yesterday took the air out of the $VIX in a big, big hurry.


I am doing today's entry in a mad rush to get on another plane, but I didn't want to leave everyone high and dry! More charts and analysis tomorrow - - promise.

Tuesday, November 28, 2006

For Your Consideration

Well, after yesterday's 158 point drop, the market went up 14 points today, and CBS Marketwatch proudly trumpeted, "Buyers Come Back to Market!" Yeah, it's a veritable stampede.

The question over the coming days is whether yesterday's drop was a one-hit wonder or the start of something bigger. With the exception of mid-May to mid-July, the year 2006 has been largely a Big, Fat Disappointment to the brainy (and broke) bears, as the air-headed (and much richer) bulls have trampled all over us. Dogs do wonder when their day will come.

Take a look at this intraday chart of the S&P 500, for instance. The prior blue area was the last decent downturn. But as you can see, it only preceded yet another runup to new highs. There's every possibility this miniature rout could yield the same result.


The Dow Transports has been more consistently bearish than the Industrials. There was no rally today - it fell some more. This chart is probably one of the strongest reasons we bears have in our pocket for overall weakness in the future.


As mentioned a few days ago, the $VIX had gone (briefly) into single-digit territory (shown highlighted here). That didn't last. The $VIX exploded higher yesterday, and it seems to have broke its multi-month long downtrend.


I've augmented this graph of the Dow 30 with the Wilder RSI (shown beneath the price pane), and you can see the RSI has really tumbled hard lately. The Dow has plenty of room left to fall, even if the rising trendline stays intact.


The NASDAQ Composite has a similar story. There's plenty of open space (shown in highlighted blue here) between the current price and the supporting trendline. So even respecting the possibility that the bull market might be intact for many months to come, there's still an opportunity to make cash on the descent back down to the supporting line.


GOOG is a curious chart right now. One could take a very bullish view on this stock from a technical perspective, and it has had a very clean retracement back to its breakout point after having ascended well above the fabled $500 level. You be the judge.


Virtually everything about GOOG (except the bit about $500) can be said of SHLD as well, although it looks a touch more vulnerable to my eyes.


Now a couple of short ideas for you. NXY:


And U.S. Steel (X):


It was a pretty slow day on the market today, so that's it for now. I'll be traveling on business tomorrow, so my blog will probably be posted later than normal. I'll see you on the other side.

Monday, November 27, 2006

The Jerk Report

Did anybody notice, over marmalade and eggs
In between the princess' legs
What with wars and floods and beggars
Not to mention stocks and shares
If you have a moment to spare
Can you write and reassure me that I have seen
They're constructing a time machine
There will be no need for the obituary pages
We can have any hero from the bygone ages
'til the truth emerges, the argument rages
The major and the minor
Turn from tallow into tar
Should we leave them in their place?
Down in damnation's cellar


Ahhhhh. It was a nice, nice day. Best day in four months. The Dow down almost 160 points. The Russell, the S&P, the NASDAQ - all smashed.

But we must be careful here. The tyrannical bulls have fooled us many times already. Downdrafts have been short-lived. So as much as I'd like to see every bull on the planet get wiped out, let's wait a couple thousand points before putting any party hats on. It's just nice to get a good, solid, down over 1% (finally!) day under our belts.

Here's a chart you probably didn't expect. The traffic for f*ckedcompany.com (for your folks that bristle at anything more severe than "poppycock", I've politely included an asterisk). The schadenfreude that drove this site's popularity has clearly diminished with the market's health. Let's hope Phil Kaplan has plenty of reason to celebrate in the coming years as companies get nuked again.


The pattern we have seen recently certainly apes the one we saw in May before the delicious descent in June/July. One day does not a trend make. But it's a start.


The $MSH technology index had its breakout pattern shattered. Good. Poor old GOOG is beneath the nosebleed-high $500 mark.


The S&P 500 is probably the best index for options, given the relatively high volume and the volatility of the index. The bid/ask spreads still tend to be fairly gigantic, but on days like this, you can make some serious green.


Part of the profits stem from the fact that the volatility exploded higher. So the value of the options pushes up both intrinsically and from a time-risk perspective. Just look at this jump in the past few days.


I can't shake the $XAU as a short pick. It has come full circle back up to the retracement level shown here.


One last index to look at - the $XMI. It has tumbled quite a bit the past week. Breaking the line shown here would put a nail in the bullish coffin for this sucker.


My LEH puts are doing fine. Looks like some serious failure happening here.


Last week I pointed to HLT as a choice short pick. So far, I nailed the top.


AKAM isn't anything to write home about, but it's not bad for a short. I see some serious weakening happening here.


NVR is thinly traded, but it's a fun short on days like this. It can lose 20 or 30 points in one session.


This week is going to be full of economic data. Today's weak retail report was the first gift we needed. Santa, bring us more!

Friday, November 24, 2006

No Rest for the Wicked

Most bloggers are taking today off. Not me! Although today's entry will be on the short side.

The US dollar, as you probably know, got punched in the nose, and that had pre-opening GLOBEX good and red. The market opened lower, spent most of the time climbing up to trim those losses, and then finally stumbled again in the end (incredibly). The intraday minute bar chart of the $INDU suggests we might have a small top on our hands. But we've certainly been faked out before. Many, many times.


The Dow Transports seems to be cooperating with a bearish outlook. The descending trendline you see is still being respected. Unlike the $INDU graph, this is on a daily basis.


I had puts on the $XAU that got promptly closed at the opening bell due to a surge in gold's value. A look at the $XAU shows that this may still ultimately form a head and shoulders pattern, it certainly isn't as clean a trade as it once was.


Since commodities are such a major part of the investment scene these days, let's take a quick look at a couple of influential ones. First, copper. This is a long term (multi-decade) chart. I think anyone would agree copper is in a weird no-man's-land at this point, having ascended to never-before-seen levels. Unlike stocks, commodities tend to revert to norms over time. Don't you think something looks kind of out of whack here?


Crude Oil, on the other hand, seems like it's positioned to move higher. We've had some relief, moving down from $75 to about $58 per barrel. But oil bulls may find themselves in a good position, in spite of the still relatively high price of fuel.


Hope you enjoyed your Thanksgiving, and I'll see you after the closing bell on Monday!

Wednesday, November 22, 2006

Giving Thanks (for nothin!)

Mr. Market (the cornball term I see used in other blogs about the stock market) hasn't been kind to us bears for the past five months. Today was sort of a do-nothing day, although the Dow managed to eke out another 5 point gain. I imagine this Friday's half-day will be equally as thrilling, if not moreso.

I marked up the Russell is kind of an interesting way. Check out what happens after each breakout. I'll leave it to you to draw your own conclusions. Hopefully my mark-ups will be helpful to you in your own analysis.


The $XMI, whose breakout really presaged a lot of the recent strength, is clearly losing steam here.


I've got a few ideas to throw your way. Here's AEM, which is a nice play on shorting gold.


BZH is actually a long idea (bullish) that I've offered before; here's an updated chart.


GS continued to be very strong today. But check out the volume. Looks like this is being pushed up by less and less strength.


Hilton (HLT) seems to be nearing the underside of its trendline. I've pointed out the various times it has "bounced" off this trendline (for both upward or downward motions).


SHLD remains a gorgeous cup with handle pattern. Amazing how far this company has come from its near-bankruptcy.


A short play on energy is probably better realized via XLE as opposed to OIH, the latter of which is a mess right now.


I appreciate all the nice comments lately. It's encouraging to get such positive feedback. Many thanks, and - - miserable market aside - - I hope everyone enjoys a feast tomorrow with those for whom they care.

Tuesday, November 21, 2006

Grind

These days I tend to be alternating between longish posts (like yesterday's, which caused quite a stir) and short ones (like today's). I just can't speak at great length about a market which nudged up another five points.

The time around Thanksgiving is usually given to upward movements. People get excited about a pleasant family holiday, I suppose. It will take virtually no strength to nudge the markets into new highs again.


The Russell 2000 is much the same picture. Like the Dow, it is positioned to make not just multi-year highs, but lifetime highs. *Sniff*.


There's no denying it, Google (GOOG) is a gorgeous chart. I mentioned this a while back, as I suggested GOOG for a long position. This company seems to be enjoying the "perfect storm." As with all things, it will stumble someday. Maybe next year. Maybe ten years from now. Who knows. But at the moment, it's the company that can seem to Do No Wrong.


Below is GS. I have nothing particular to say about it, either long or short. But I think the chart speaks volumes about this market. A huge, well-known investment bank up over 100% in just over a year. And virtually a straight line up since the middle of this year. Breathtaking.


I'm moving more and more into cash and more and more resigned to hang up my trading for a few months. It doesn't necessarily mean I'll hang up the blog. But this market is a little too bewildering to trade.

Monday, November 20, 2006

Single Digit VIX

The market fell today, which was a welcome change, particularly since it looked early on that we'd have yet another record high on our hands. The market "felt" different today, as there was no late-day rush by the bulls to push it upward. The bears were (just a tiny little bit) in control for a change.

The $VIX, the market's measure of volatility (and, indirectly, complacency) fell to an unheard-of low beneath 10. We are now in single digit territory, which means that puts have a historically very modest time premium. Buying puts today is a relatively inexpensive exercise, although obviously the intrinsic value still plays a big role here! But you can see just how sharply the VIX has plunged.


There is a review of this blog coming out in the December Technical Analysis of Stocks and Commodities magazine. I got an advance copy, and it's a very nice review. One of the things it points out is how this blog is really meat & potatoes, not straying into rhetoric but focusing on charts.

Well, let me defy that a bit by delving into a bit of a speech. Something that has been on my mind lately has been the growing skewed nature of the distribution of wealth in the U.S. It will come as a surprise to no one that the super-rich as hoarding more and more of the pie.

Now this may sound like an introduction from some left-wing socialist. I assure you I'm not. My capitalist roots run deep, and my political philosophy is a libertarian one. However.......I am sensing an extreme in a cycle here which, over a period of decades, is bound to have major social consequences.

I grew up during the 70s and 80s. In the 70s, my economic understanding of the world was that, yes, there were rich people. Even a few billionaires. The vast majority of people worked hard for their middle-class wage. There were some highly paid executives that were in the six-figure range. The playing field was more or less level, but grotesque differences between the middle and upper classes were not altogether apparent. Or at least they weren't flouted.

Things have changed. The sea change wasn't the "greed decade" of the 1980s. The real difference back in the early 90s, when tax rules regarding stock options and executive compensation changed. The most highly paid weren't six-figure salaries anymore, or even multi-million dollar salaries. It pushed into the eight figures. And the nine figures. In a few rare cases (hedge fund managers), even annual salaries in excess of a billion dollars were reported.

I found a graph showing the distribution of wealth in the U.S. in the various strata. This is a somewhat outdated graph, but it's pretty close. As you can see, the top 1% has about a third of the wealth.


What's really interesting to me is what happens when you dig into that upper 1%. When you look at the top tenth percent. And the top one-hundredth percent. There's a fascinating article in this week's Economist about this very subject (http://www.economist.com/finance/displaystory.cfm?story_id=8173929)

What does this have to do with the financial markets? We saw in the March 2000-October 2002 bear market how many scapegoats were dragged out. People had a blood lust about seeing companies collapse (hence the one-time popularity of f*ckedcompany.com), executives hauled away to prison (Enron, Adelphia, Worldcom, Healthsouth), and investment bankers fined or barred (Mary Meeker, Henry Blodgett). The bear market was overly relatively quickly. Had it dragged on for another year or two, there would have been more scapegoats, more congressional hearings, and the like.

What's going to happen to our social and government scene if another downturn takes place? The Democrats are in charge now. What if America - - everyone, not just the superrich - - begins to experience a fall from grace? What if employment rises, interest rates move up, the stock market moves down, or any combination of these?

I imagine the envy of the superrich will morph into contempt. And we're going to see the same cycle again, only larger. The seeds are being sown for this kind of populist revolt. America is too centrist and capitalist a nation for it to go anywhere extreme. But the soil is pretty fertile for the masses to want some kind of reversal of national fortunes, be it in the form of confiscatory taxes or some other animal.

End of speech. Just wanted to share those musings. Now back to the meat and potatoes.

The Russell 2000 remains my favorite index candidate for shorting. I bought a block of puts today (January expiration) on this, with a stop at any price above 795. It's a relatively low risk trade.


The S and P 500 ($SPX), shown in candlestick form here, had a perfect doji pattern today. This is a statement of uncertainty. The market finally took a pause, in spite of a lot of bullish news about massive mergers, both real and contemplated.


The Dow Transports continues to be in a rather bearish pattern. You can plainly see the series of lower lows and lower highs illustrated here, along with a nice complement of Fib fans beneath the current price levels.


Gold shot higher early today, but it weakened throughout and actually closed down (when I say 'gold', I am typically speaking of the $XAU index, not the commodity gold itself). I remain long the puts on this index.


FCX, the purchaser of PD (whose puts I got blown out of this morning at the pathetic price of a nickel each!) sank on the day. I continue to like this chart, in spite of the mauling I took with PD!


Here is Frontier Oil, which appears to be forming a head and shoulders pattern. I'll say again that patterns in formation aren't patterns at all - - merely potential ones. Those among you more comfortable with risk may consider this as a short.


Finally, another look at Lehman Brothers (LEH). Same as before - a stop price not too far from the current price, and plenty of room to fall.