The market fell today, which was a welcome change, particularly since it looked early on that we'd have yet another record high on our hands. The market "felt" different today, as there was no late-day rush by the bulls to push it upward. The bears were (just a tiny little bit) in control for a change.
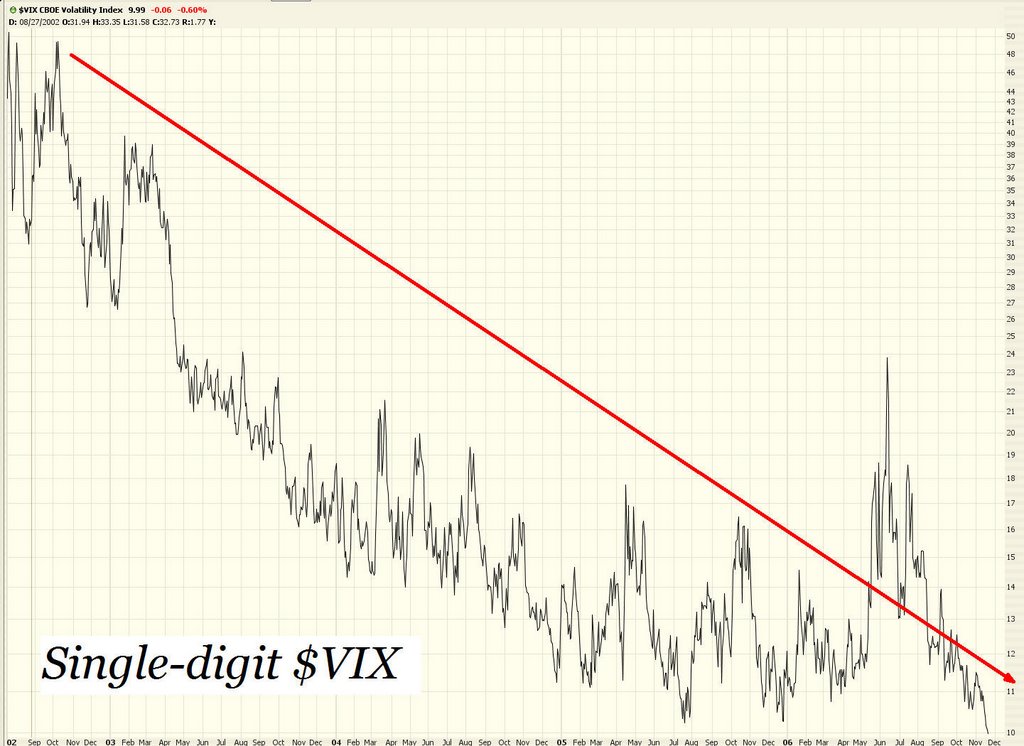
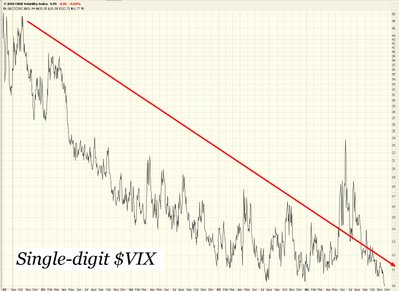
The $VIX, the market's measure of volatility (and, indirectly, complacency) fell to an unheard-of low beneath 10. We are now in single digit territory, which means that puts have a historically very modest time premium. Buying puts today is a relatively inexpensive exercise, although obviously the intrinsic value still plays a big role here! But you can see just how sharply the VIX has plunged.
There is a review of this blog coming out in the December Technical Analysis of Stocks and Commodities magazine. I got an advance copy, and it's a very nice review. One of the things it points out is how this blog is really meat & potatoes, not straying into rhetoric but focusing on charts.
Well, let me defy that a bit by delving into a bit of a speech. Something that has been on my mind lately has been the growing skewed nature of the distribution of wealth in the U.S. It will come as a surprise to no one that the super-rich as hoarding more and more of the pie.
Now this may sound like an introduction from some left-wing socialist. I assure you I'm not. My capitalist roots run deep, and my political philosophy is a libertarian one. However.......I am sensing an extreme in a cycle here which, over a period of decades, is bound to have major social consequences.
I grew up during the 70s and 80s. In the 70s, my economic understanding of the world was that, yes, there were rich people. Even a few billionaires. The vast majority of people worked hard for their middle-class wage. There were some highly paid executives that were in the six-figure range. The playing field was more or less level, but grotesque differences between the middle and upper classes were not altogether apparent. Or at least they weren't flouted.
Things have changed. The sea change wasn't the "greed decade" of the 1980s. The real difference back in the early 90s, when tax rules regarding stock options and executive compensation changed. The most highly paid weren't six-figure salaries anymore, or even multi-million dollar salaries. It pushed into the eight figures. And the nine figures. In a few rare cases (hedge fund managers), even annual salaries in excess of a billion dollars were reported.
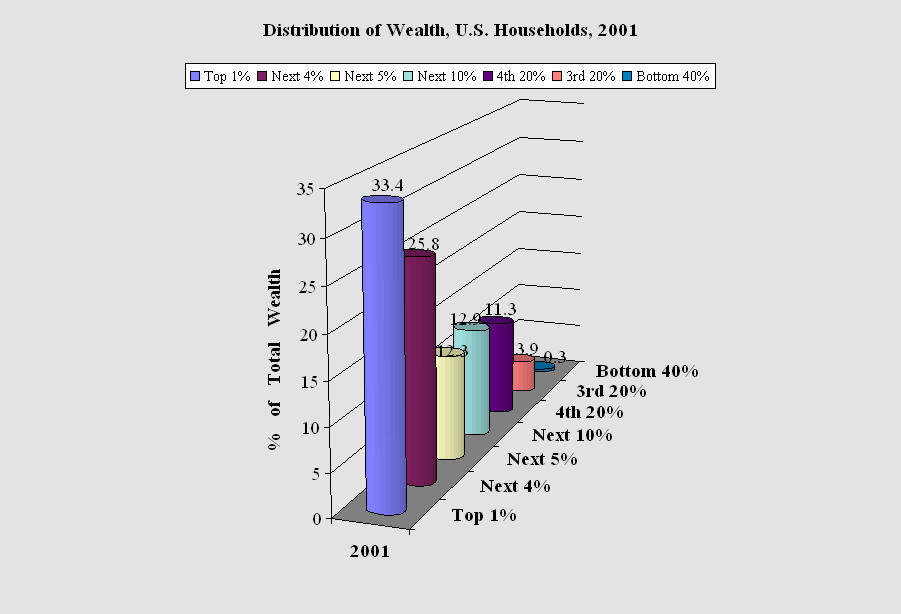
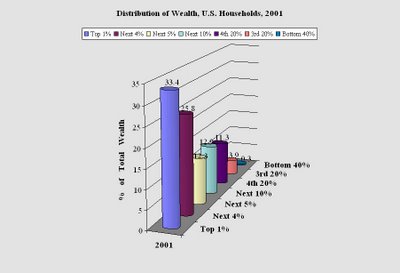
I found a graph showing the distribution of wealth in the U.S. in the various strata. This is a somewhat outdated graph, but it's pretty close. As you can see, the top 1% has about a third of the wealth.
What's really interesting to me is what happens when you dig into that upper 1%. When you look at the top tenth percent. And the top one-hundredth percent. There's a fascinating article in this week's Economist about this very subject (http://www.economist.com/finance/displaystory.cfm?story_id=8173929)
What does this have to do with the financial markets? We saw in the March 2000-October 2002 bear market how many scapegoats were dragged out. People had a blood lust about seeing companies collapse (hence the one-time popularity of f*ckedcompany.com), executives hauled away to prison (Enron, Adelphia, Worldcom, Healthsouth), and investment bankers fined or barred (Mary Meeker, Henry Blodgett). The bear market was overly relatively quickly. Had it dragged on for another year or two, there would have been more scapegoats, more congressional hearings, and the like.
What's going to happen to our social and government scene if another downturn takes place? The Democrats are in charge now. What if America - - everyone, not just the superrich - - begins to experience a fall from grace? What if employment rises, interest rates move up, the stock market moves down, or any combination of these?
I imagine the envy of the superrich will morph into contempt. And we're going to see the same cycle again, only larger. The seeds are being sown for this kind of populist revolt. America is too centrist and capitalist a nation for it to go anywhere extreme. But the soil is pretty fertile for the masses to want some kind of reversal of national fortunes, be it in the form of confiscatory taxes or some other animal.
End of speech. Just wanted to share those musings. Now back to the meat and potatoes.
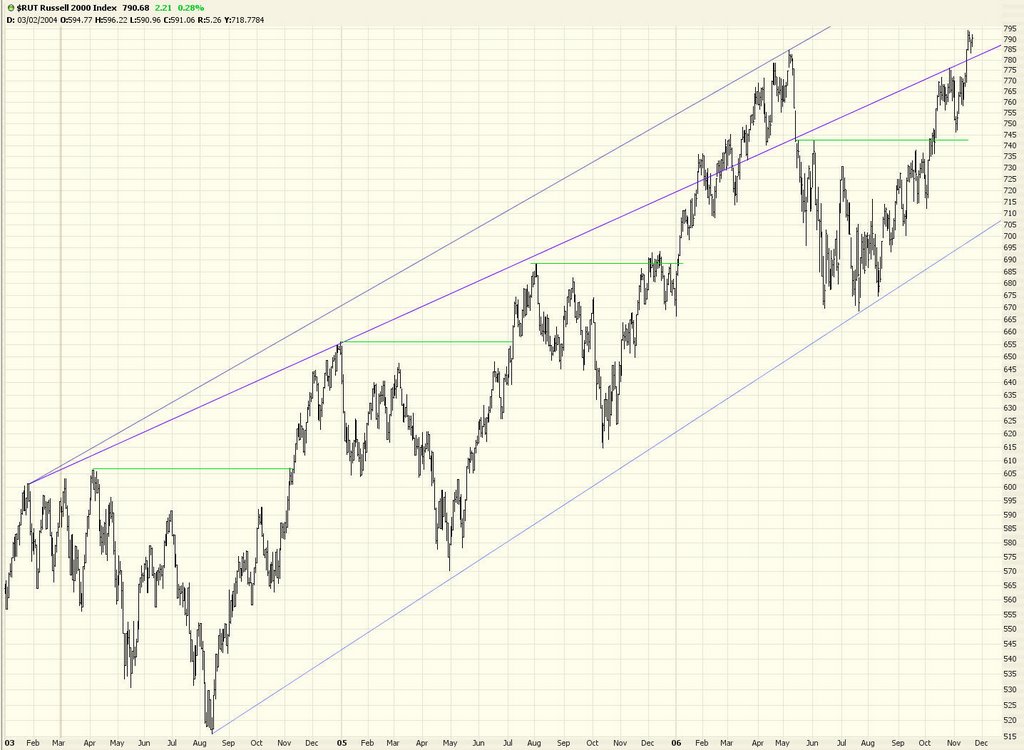
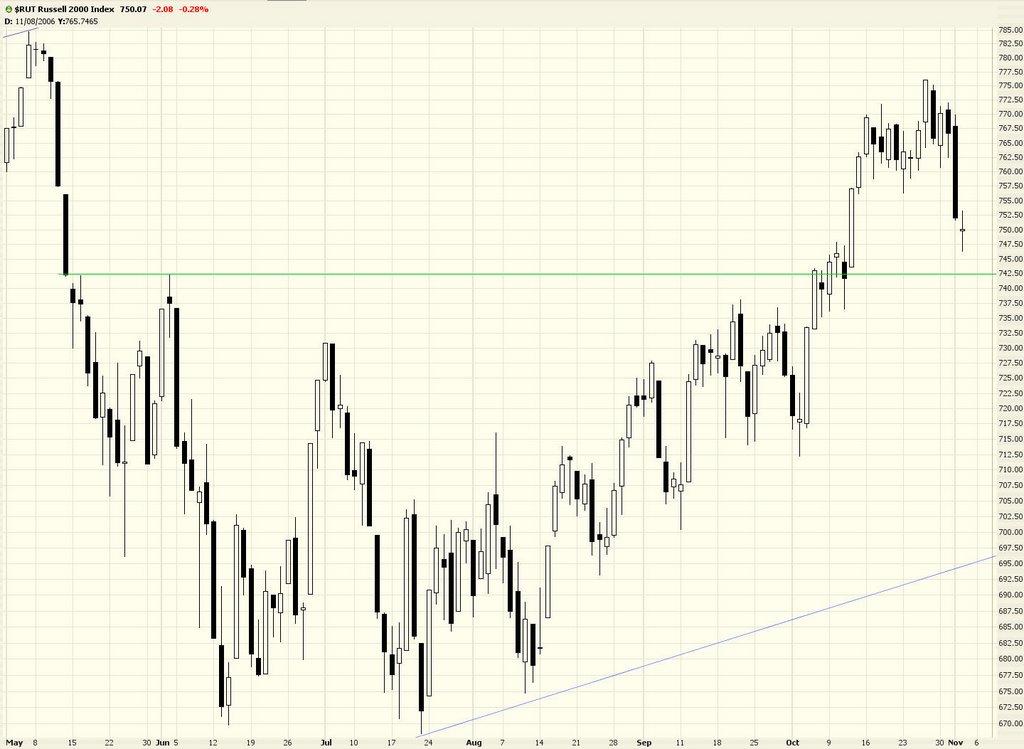
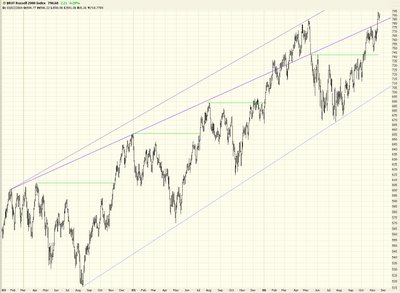
The Russell 2000 remains my favorite index candidate for shorting. I bought a block of puts today (January expiration) on this, with a stop at any price above 795. It's a relatively low risk trade.
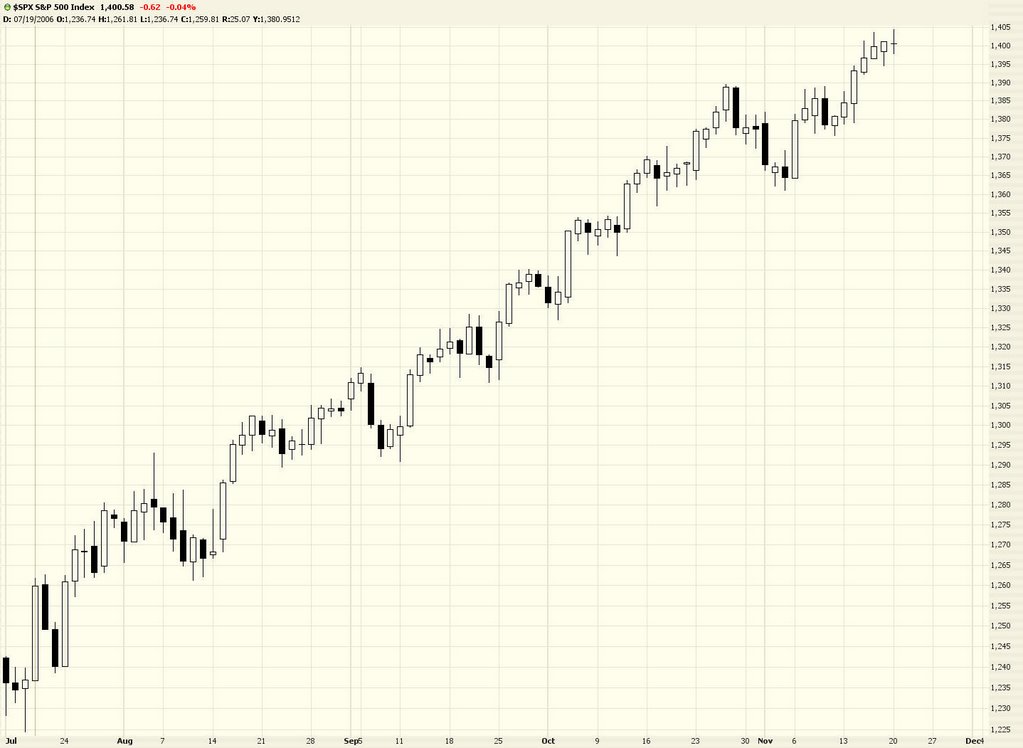
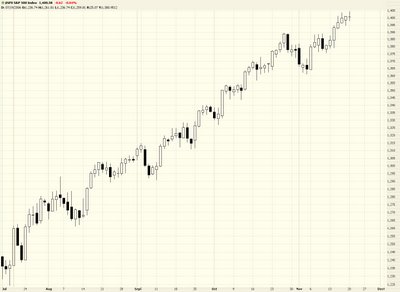
The S and P 500 ($SPX), shown in candlestick form here, had a perfect doji pattern today. This is a statement of uncertainty. The market finally took a pause, in spite of a lot of bullish news about massive mergers, both real and contemplated.
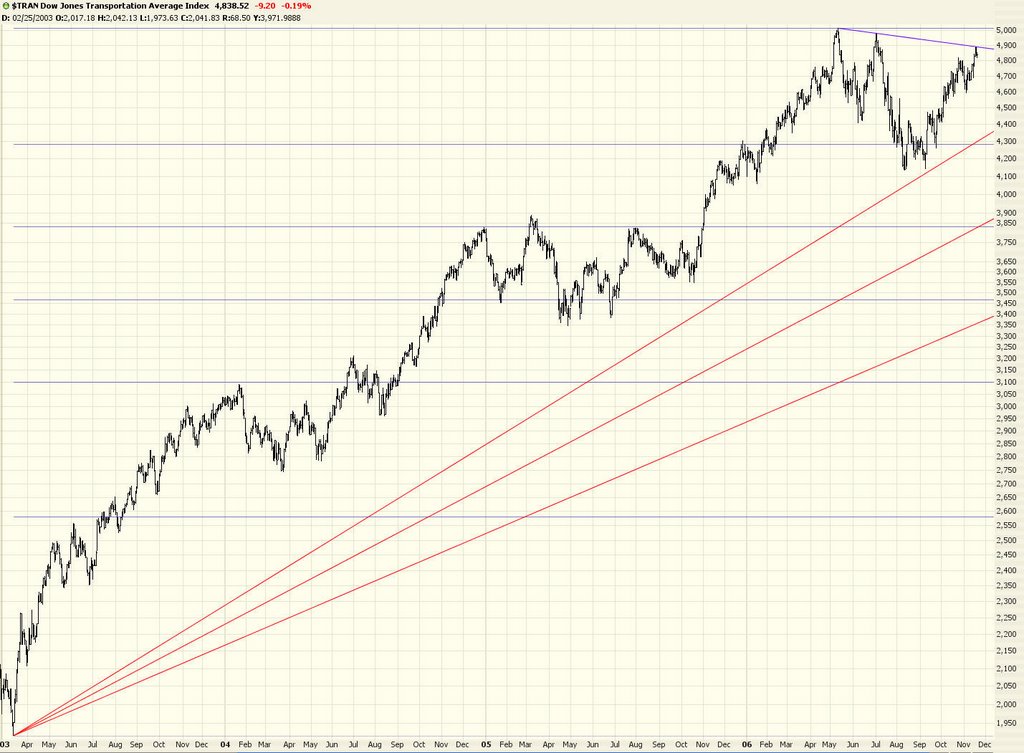
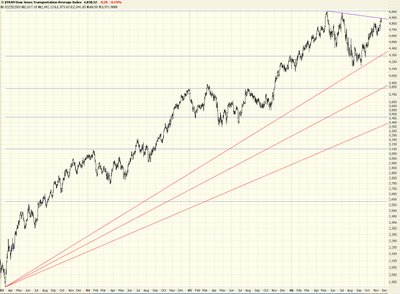
The Dow Transports continues to be in a rather bearish pattern. You can plainly see the series of lower lows and lower highs illustrated here, along with a nice complement of Fib fans beneath the current price levels.
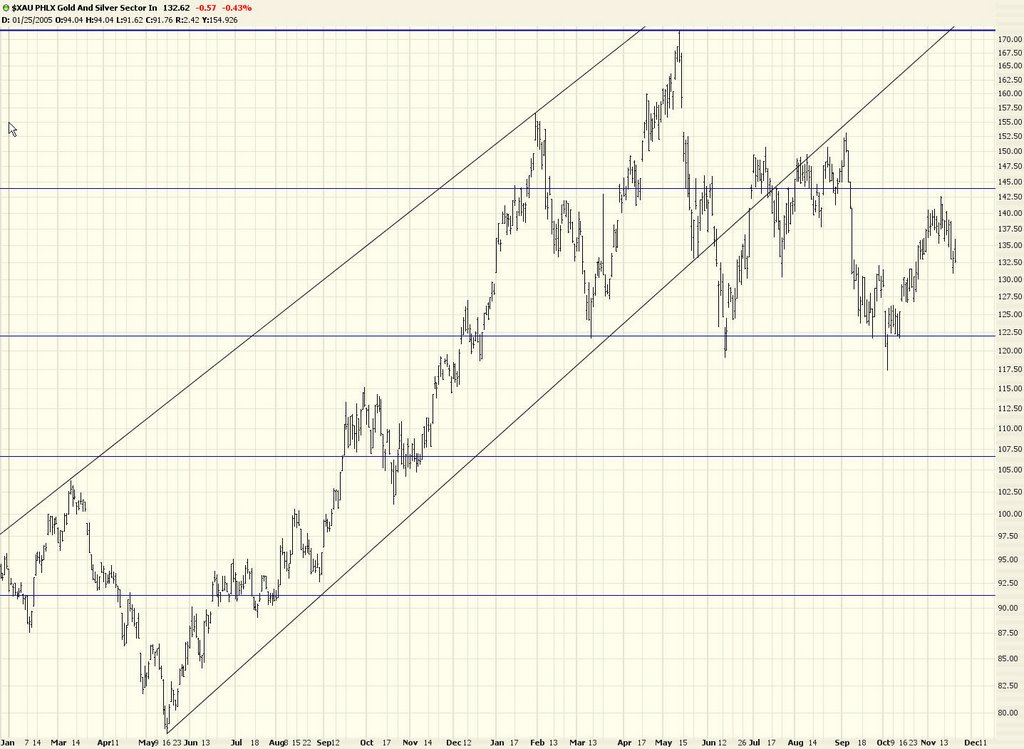
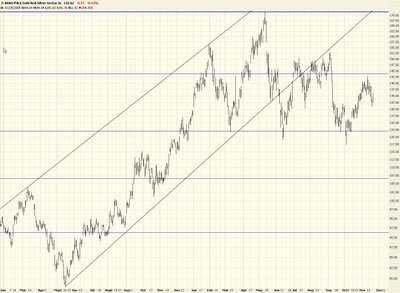
Gold shot higher early today, but it weakened throughout and actually closed down (when I say 'gold', I am typically speaking of the $XAU index, not the commodity gold itself). I remain long the puts on this index.
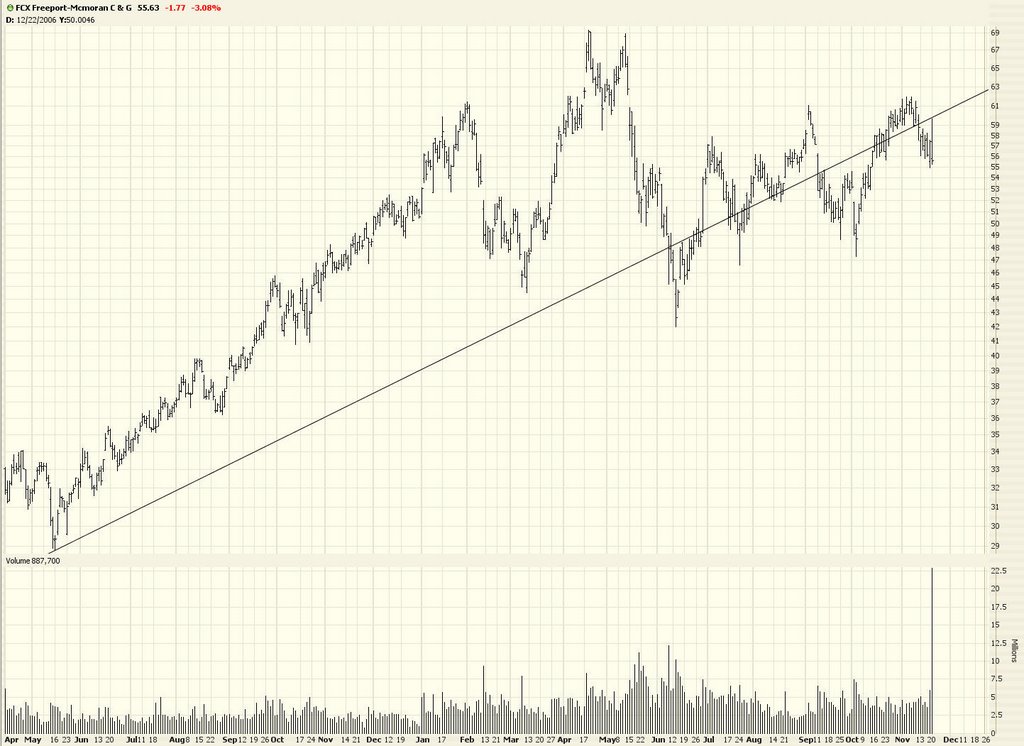
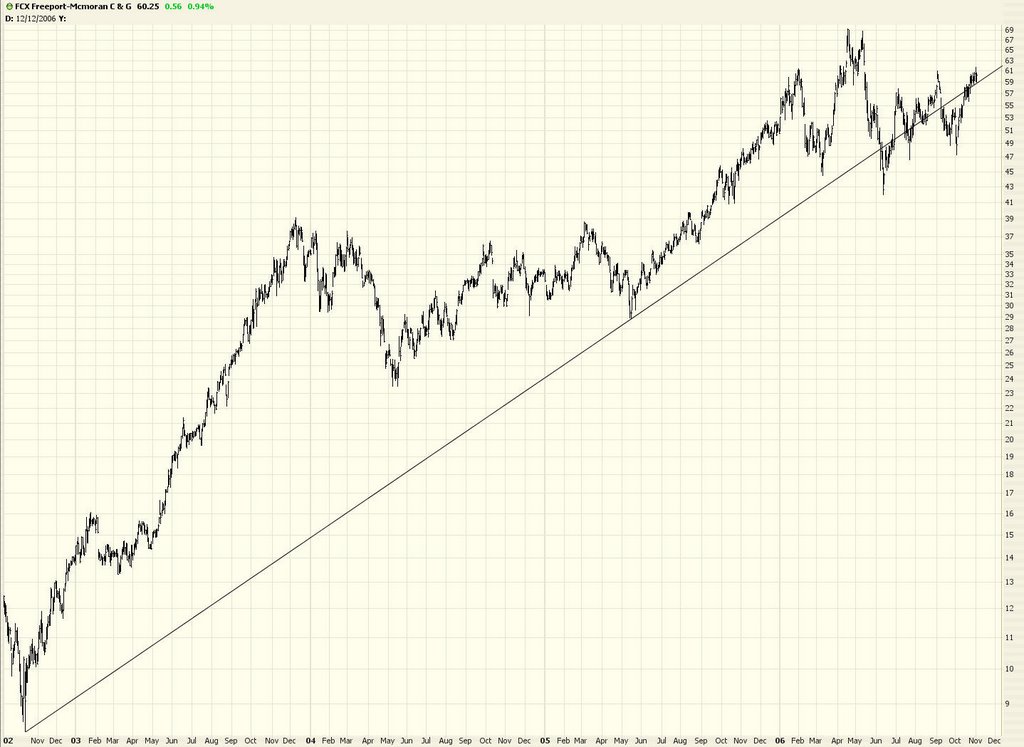
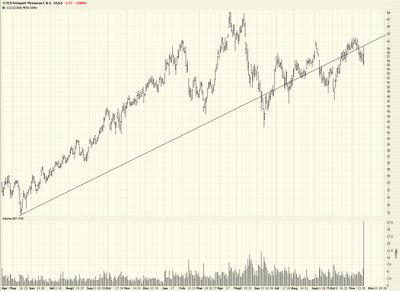
FCX, the purchaser of PD (whose puts I got blown out of this morning at the pathetic price of a nickel each!) sank on the day. I continue to like this chart, in spite of the mauling I took with PD!
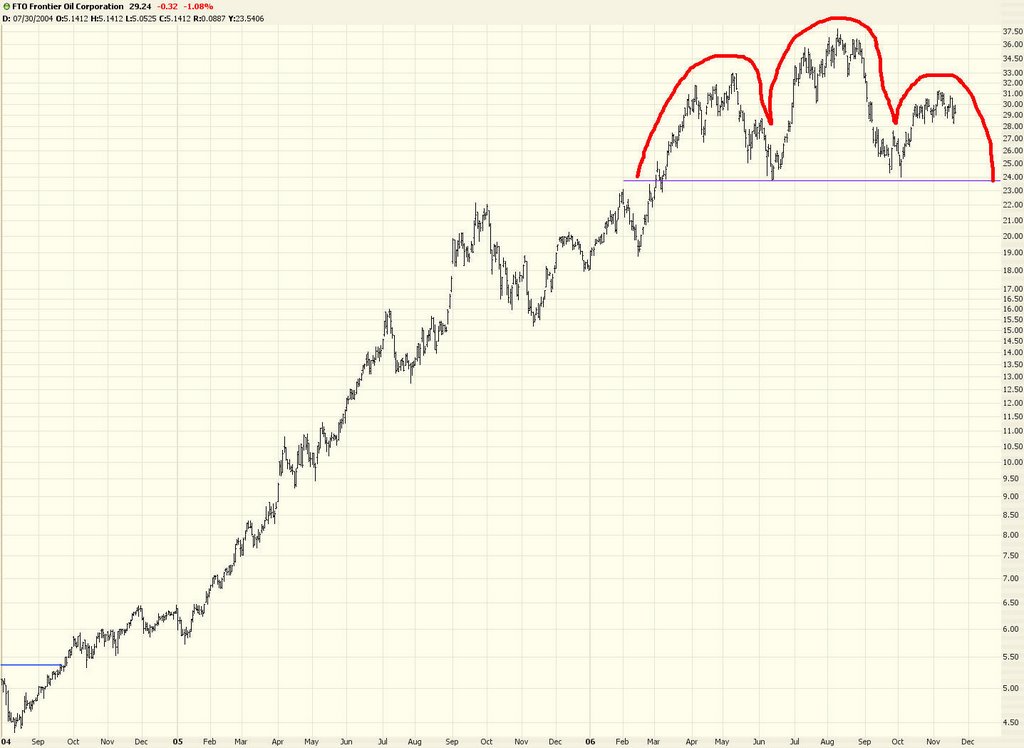
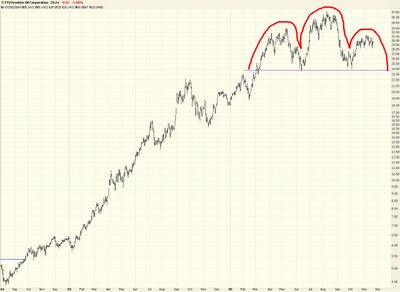
Here is Frontier Oil, which appears to be forming a head and shoulders pattern. I'll say again that patterns in formation aren't patterns at all - - merely potential ones. Those among you more comfortable with risk may consider this as a short.
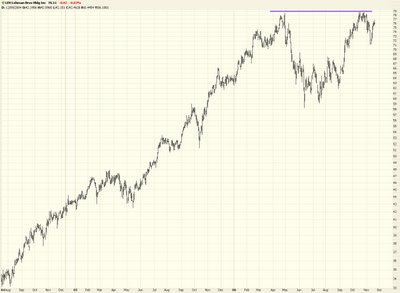
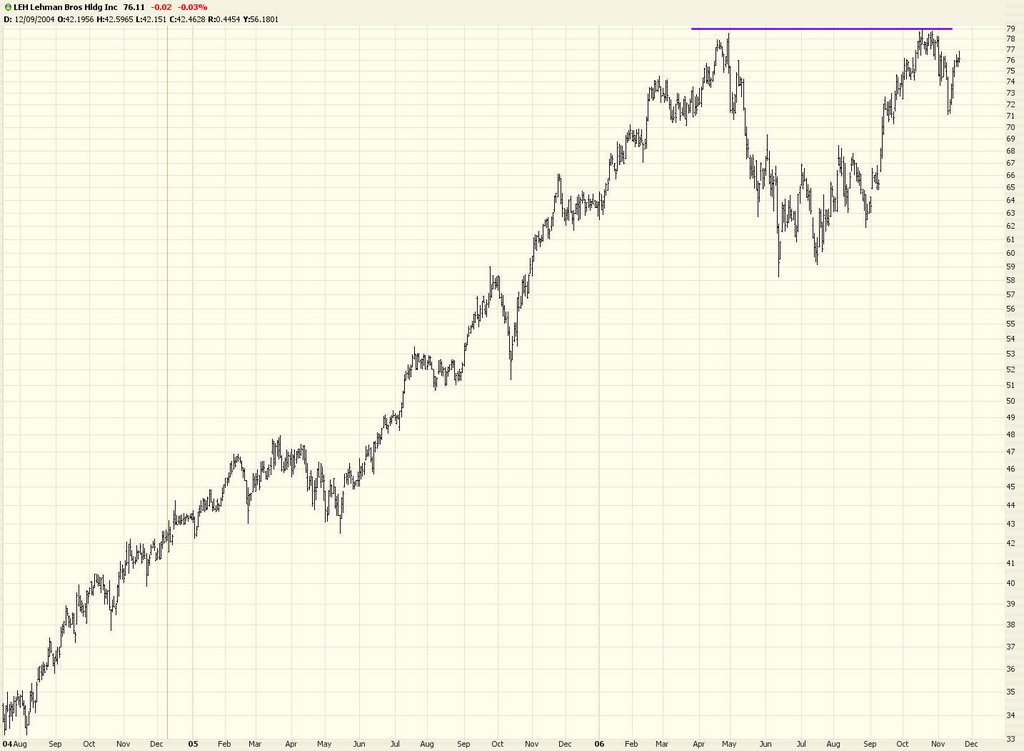
Finally, another look at Lehman Brothers (LEH). Same as before - a stop price not too far from the current price, and plenty of room to fall.