Today panned out exactly as I was hoping. I've got to confess, I get nervous when things get this easy. It sometimes tells me I'm about to be very wrong!
Before I get into the celebratory cheer on today's huge tumble, I want to point out one position where I got blown out: Kinder Morgan. I had puts on this, and they were closed today at 5 cents apiece! I am not mad at myself, though, for two reasons. One, the trade was based on sound technical analysis which could not foresee a surprise $100 management buyout; and two, I have many, many small positions (all bearish) so that one surprise like this is actually pretty inconsequential.
I am flattered that this blog has become somewhat of a meeting/debating place for a number of readers. I'm not sure how many of you look at the comments section, but there are quite a few interesting posts in there. I wanted to address a few of the recent ones with my own commentary. Please note that these posts are in sic form - that is, any misspellings, grammatical errors, etc. are left in as they originally appeared.
Jeff said...
Tim,
I had a question about how you use stops on puts and calls. Do you try to figure out the delta of the option, and then figure out how much the option would move relative to the stock price? Then, decide where to place the stop on your puts?
Or, do you just set it at arbitrary loss points, like sell at 50% or 25% loss?
The bid/ask just seems to be deadly on some options, and I don't get quite how you would set a stop that wouldn't get executed too early or in an undesirable situation...For ex., I bought DNA puts at 2.25, and set a stop at 1.00 - but I'm just freaked out it could get stopped out when the bid/ask is like 1.00/1.30 in some random point in time.
My response:
All good questions, Jeff.
First, I don't use greeks in my options trading. It's not because there's something wrong with them. I just don't have the time or the patience to learn about them! Plus, I use some pretty simple rules when buying options that serve me just fine: (1) buy them just a little out of the money (b) buy 2 expirations into the future (c) only buy when the bid/ask spread, volume, and open interest are reasonable. If I see an option quoted at .50 by 1.75, I'm not interested! I'd like to see a nickel spread, or maybe ten cents. And at least a few hundred contracts traded per day.
Second, I definitely do not recommend stop orders based on option price. Use contingent orders. If your broker doesn't have them, go to optionsXpress or some other broker that supports them.
Hurricane5 said...
The bears are calling for the end of the world and the fed will continue raising rates for the rest of our natural lives. Everybody needs to stop the nonsense and take a deep breath. The fed will not take the federal funds rate past 5.5%. They know it would be suicide if they did so. I doubt Mr. Bernanke wants to send us into a recession. The markets are very nervous about additional rate hikes, and that is the cause for the pullback. Which is all this is, a pullback. I will remain confident that the fed will not overshoot. I would be a heavy buyer of GOOG, and EBAY at current levels. EBAY looks to have found its bottom over the last 3 days. I really do not see much downside potential left. I believe it can trade at $40 this year. GOOG at $370 is a gift. I believe it goes to $600. A stock to just keep on the radar is BIDU. I've kept a close watch since it was trading below $50. This stock could potentially explode to the upside over the next 18 months.
My response:The interest rates isn't the only thing that matters to the stock market. There are market forces beyond the Fed's control. We could have interest rates at 0% and could still have a tumbling market, as Japan did for many years.
As for EBAY, I own puts on it. As for GOOG, it's become too boring to trade right now, but I'd hardly consider $370 a "gift." More on this later.
Hurricane5 said... The ^DJI is over 11,200 and Tim is saying if it fails to go higher then we are in a bear market. Let me talk some sense into everyone. The ^DJI MUST, and I mean MUST fall BELOW 10,000 or we are NOT in a bear market. Yes, you hear me correctly. The ^DJI MUST fall another 1,211 points for the bears to have ANY hope. Until then, continue loading up on GOOG, EBAY, ZOLT, NTRI, and HANS. Have a great day!
My response:The notion that a psychologically significant number like 10,000 is the litmus test of a bear market seems false to me. I think falling below 10,000 will make big news - - it would be the headline of most news shows, and you can already see the 36-point type on CBS MarketWatch decrying the failure of this level. To me a bear market is simply lower highs and lower lows. So far, I think that's what we're seeing shaping up, although even I am not ready to "declare" it a bear market yet. If we take out 11,030, that is very good for the bears, and if we go on to take out 10,975, it's party time!
Super Bull said... This relief rally is of poor quality. First there is diminishing volume. Second, speculative names like TIE and HANS are still leading the market. That is not a good sign. I reentered my shorts today (GOOG, NTAP, AMZN).
My response:I agree. All three of those issues got their teeth kicked in, so congratulations.
Hurricane5 said... The last few days should end all the talk about the Dow 30 at 5,000 in 2 years. I read that nonsense from several people. Once again, it must fall to 9,999 for the bears to have any hope. For all the bulls, enjoy the ride to 12,000! Congrats to all those who were able to buy terrific stocks on sale last week! When I shop for clothes I always welcome a shirt that is 10% off, and stocks are no different. Thank the fed chairman for the discount! Have a nice weekend :)
My response:The idea that stocks falling creates a "On Sale" opportunity is ridiculous. Would you have applied the same logic in April 2000? And May? And June? And so on, as the market cratered for over two years? I can see it now: "If you liked GOOG at $370, you'll
love it at $100!"
jockgunter said... You're cruising to be number one in Stephen Colbert's THREATDOWN against America !
My response:I think Stephen Colbert is hilarious, but I'm afraid I don't know what you mean. Maybe someone can enlighten me!
Super Bull said... I had been bullish until a few weeks ago. Since then I have been increasingly bearish. The problem is that I don't know whether this is just a severe correction(thus a bull market will resume shortly) or a major bear market. Below, I am going to list some fundamental reasons for both the bullish case and the bearish case. Feel free to either add to them or rebut them:
Bullish Case:
1. There are three billion people from BRIC (Brazil, Russia, India and China) joining the capitalistic system. This compares to about 800 million people in the existing system. These three billion people are willing to work hard to achieve the living standards of their western counterparts. Thus, they will create lots of wealth and become middle class. Then the US multinational companies can sell lots of products to them, Thus those companies will be making lots of money. Don't worry about the distribution of the pie because the pie will get much larger.
2. There are lots of innovations going on in Internet, Biotech, and alternate energy. Lots of wealth will be created by innovative people.
Bearish Case:
1. There is inflation in the system manifested in the form of price increases in gasoline, education expenses, healthcare cost, grocery cost, transportation cost, etc...
This will force central bankers around the world to jack up interest rates.
2. Growth is slowing in lots of tech companies. Witness Microsoft and Google.
3. Housing prices peaked already and are slowly going down. Thus the so-called house ATM is gone and consumers spending will begin to slow.
4. Oversea markets and especially China is going to slow down because there is no way China can grow 9 to 10 percent every year indefinitely into the future.
5. In the US, the Democrat party will likely retake the House of Representative and maybe even the Senate in the midterm election. They will pass some legislations that will benefit the lower or middle class at the expense of the upper class and shareholders. In other words, the shareholders' take of the earning pie will become slower.
6. The current PE of 19 for the S&P500 is high for peak earning if indeed this turns out to be the peak earning.
Although I use both fundamental and technical analysis in my stock trading, I believe that in order for a bear market to occur, there must be compelling fundamental reasons.
I know Trader Tim is only interested in technical analysis but I am sure some of the readers of his blog also use fundamental analysis. So maybe you guys can comment on these and even enlighten me.
My response:I think the fact that there are three times as many bearish reasons above as bullish, and the fact that the bullish reasons tend to be prosaic whereas the bearish ones are factual, makes the bears come up as the winner. I am heartened that Super Bull has been seeing things in a bearish light, since he's been right so often in the past.
John Wheatcroft said... Super Bull's bear case is problematic at best but number 5 is by far the worst piece of evidence - the stock market, since the beginning of time, has always done better under the Democrats than under the Republicans. You can look that up. Number 1 suggests that there is this new economic concept - "inflation" in the system. A brief look at history would reveal that there has been "inflation" in the system since the beginning of time. Inflation is meaningless in the long term and the short term. I've been around a week or two and I can guarantee I have lived through and profited in some of the most horrendous inflation laden periods of all time.
As far as housing is concerned - once the Fed starts cutting rates to head off the recession from becomming a depression prices will again go up. Probably faster this time since a lot of people who missed the last bubble are waiting for the next one.
Now for the weeklies. Last week I said there was a good possibility for a continued downtrend but I was wrong. If I had been more observant I would have seen the long tail on last weeks formation and that would have been a counter suggestion to my thinking - whatever. This week we are seeing a clear cut hammer formation in every index. "Hammering out the bottom" as they say. Bull trap? Bull crap. Just wishful thinking. This market has a long way to run yet.
'Cane - NTRI is dead, HANS is topped and GOOG might bounce around in the 350-450 range for a bit longer before it too implodes (nothing new coming out of the goog fountain). Don't forget once Goog starts going down there is going to be no bid for a long way. BIDU also appears toppy.
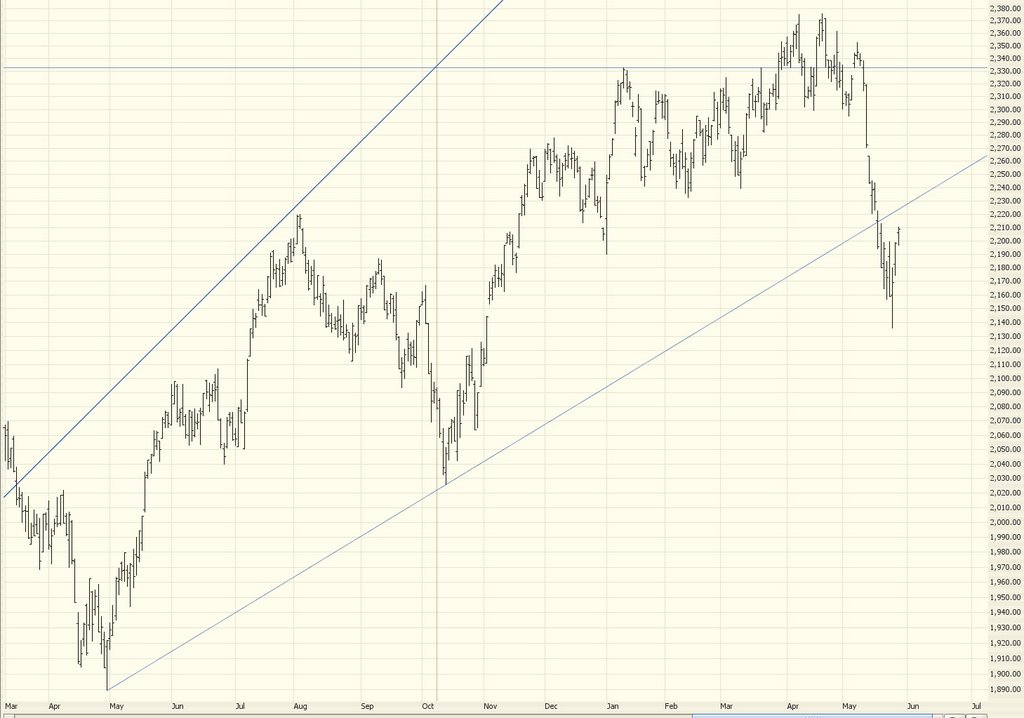
My response:I don't think the market has a long way to run. I think it's got a long way to fall. If you look at very long-term charts of the $SPX and the $INDU, they simply scream "market top", and every single chart I look at these days of volatile issues suggest that the highs reached on May 10th was the final death throe of the bull market.
Hurricane5 said... super bull, your argument for a bear market in point #2 could not be further from the truth. As I have said many times, Microsoft and Dell are yesteryear. Although Microsoft's growth is expected to double over the next 5 years thanks to the launch of Vista, it is still not a measure of the tech sector. AMD, GOOG, EBAY, JDSU, and APPL are just a few of the many new tech names that will lead the market. You say that the growth at GOOG is slowing? GOOG just beat earnings estimates by 16%. They will grow at over 70% this year. They will grow at over 25% every year for at least the next 5 years. I'll take that "slowing" growth any day. GOOG passes $600 this year.
John Weatcroft, You could not be further from the truth. I have said it before, but apparently I did not make it clear enough. Let me try this again. NTRI will earn AT LEAST $2.20 a share this year. It will trade at 50-55x earnings. You do the math. I'm not sure how you call a stock that just beat estimates by 50% "dead". Just do yourself a favor and buy as many shares as you can, and then thank me after the Q2 report in July.
GOOG will earn $10 a share and trade at 60x earnings. That is where I come up with $600. Simple math. I was a heavy buyer of GOOG in the low $300's. You should have been too. However, at current levels, you can still have over a 50% return this year. I said that BIDU will trade at levels not seen since its opening trading day over the next 18 months. It will.
Some new stock picks on this Memorial Day: TRID, JOYG, SIRI, and JDSU. Once again, I will not give stop prices so it is up to you to decide when to take profits. Have fun with the amazing returns you will see from any of my picks! Hope you are having a nice holiday!
My response:First, let's take a look at those Memorial Day picks for today alone. TRID was down 7.27%. JOYG was down 1%. JDSU was down 3.58%. SIRI bucked the trend and was up 5.02%. Of course, that's just one day.
The idea that GOOG is (a) somehow guaranteed to earn $10 per share and (b) more far-fetched, that the market would be willing to pay an insane 60 times earnings seems lunatic to me.
Let me explain something - - my office is in downtown Palo Alto, California, which was the epicenter of the Internet bubble madness. I saw it all, including the $17,000 per month in rent we paid for a shabby little house we used as an office space. Things spiraled out of control, and it came crashing down. We went through a (small) bear market in 2000-2002 and, since people have a memory span of about 10 days, everyone's forgotten about it and thinks it's party time again.
My view is that 2000-2002 was just a sneak peek of what's to come. We ultimately will take out the lows of October 2002 and head much farther down.
So......back to today's action.
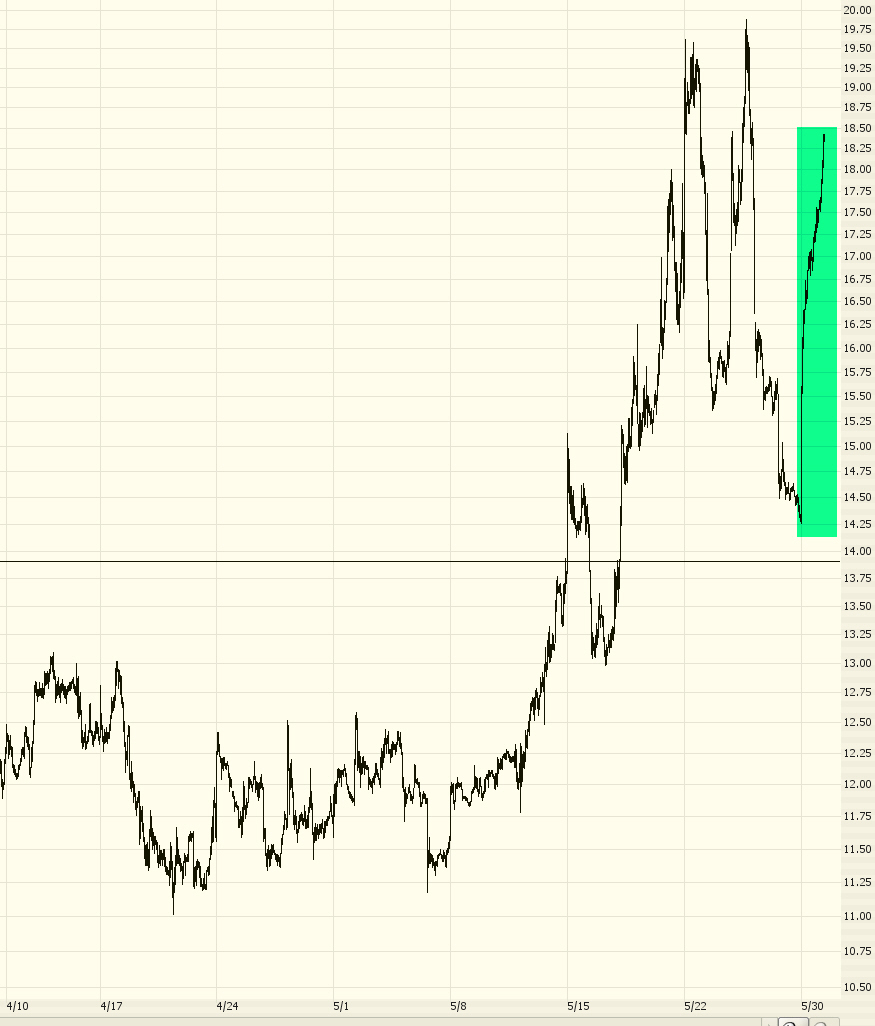
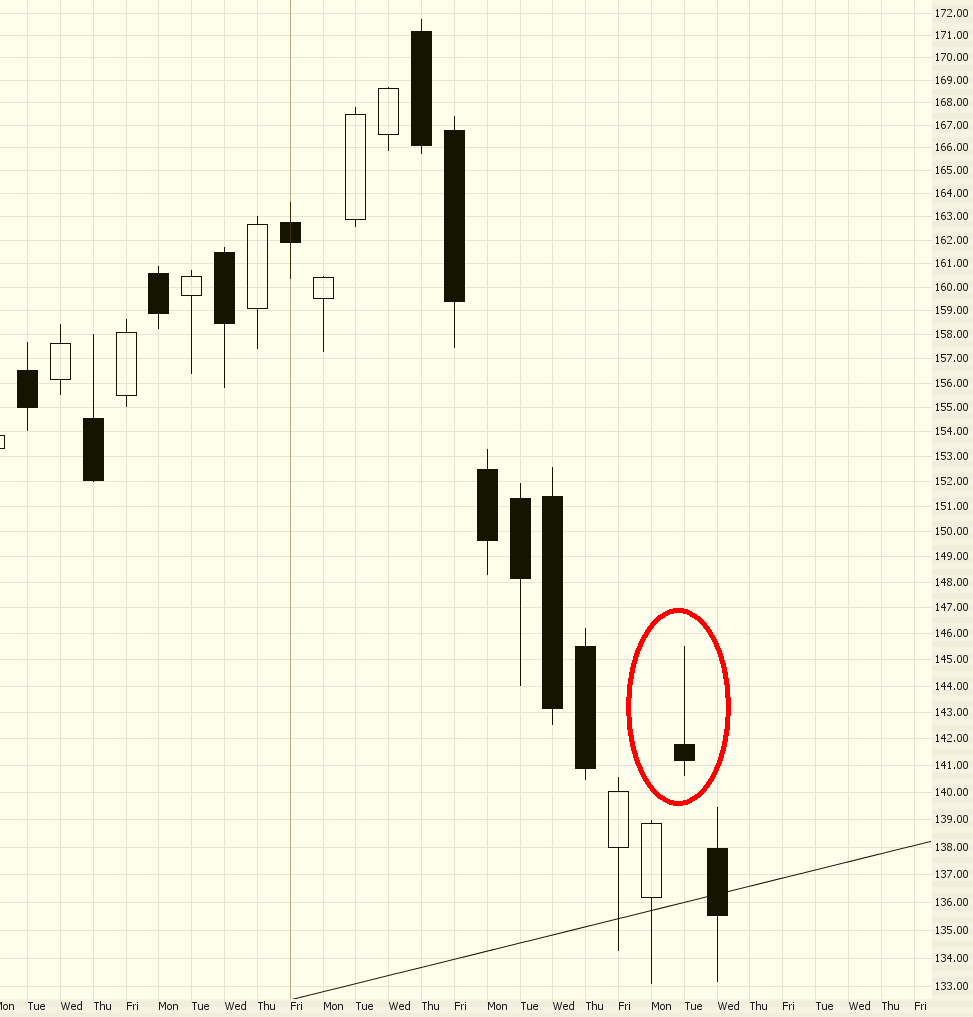
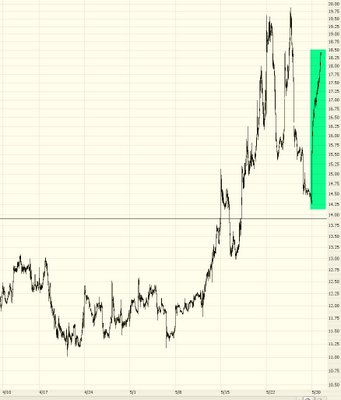
I'm a bit nervous that the market still has the opportunity for a bounce, since the resumption of the fall was so rapid. Looking at the $VIX (below), it seems that, in a single day, we've approach the recent extremes. If the market really starts to get hit hard, we could see those extremes beaten, because let's keep in mind, the VIX is historically still very low (it was three times this level back in the dark days of 2002). But I wouldn't be at all surprised to see some mild strength in the market tomorrow.
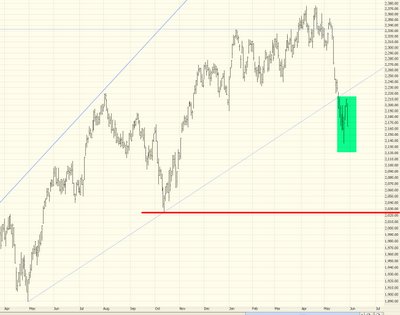
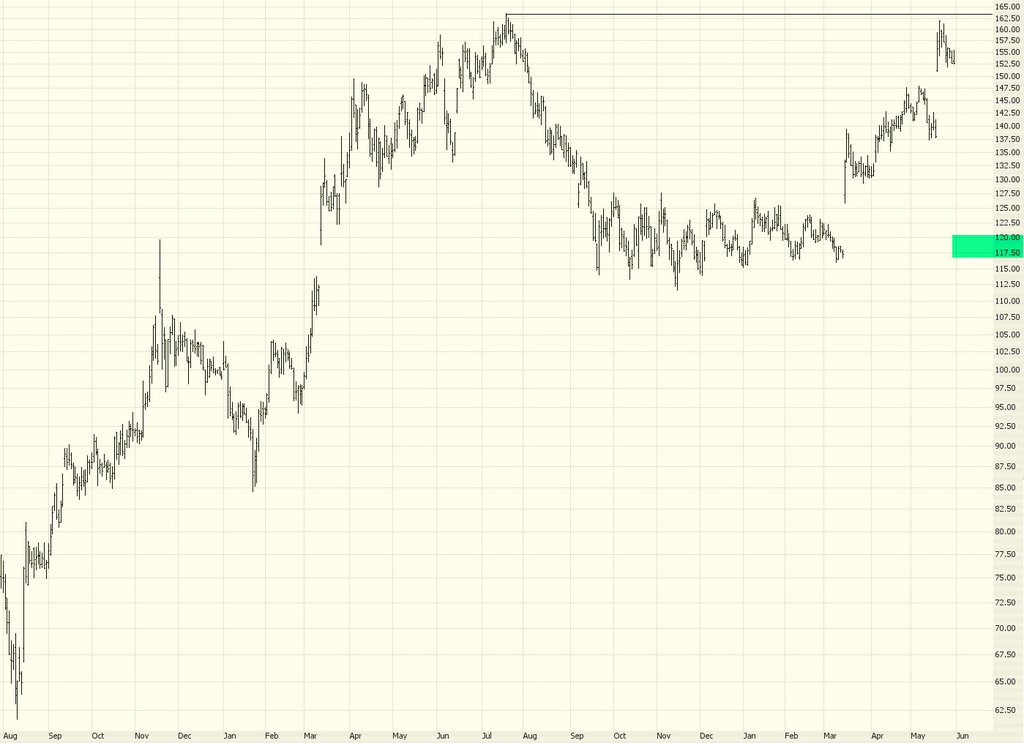
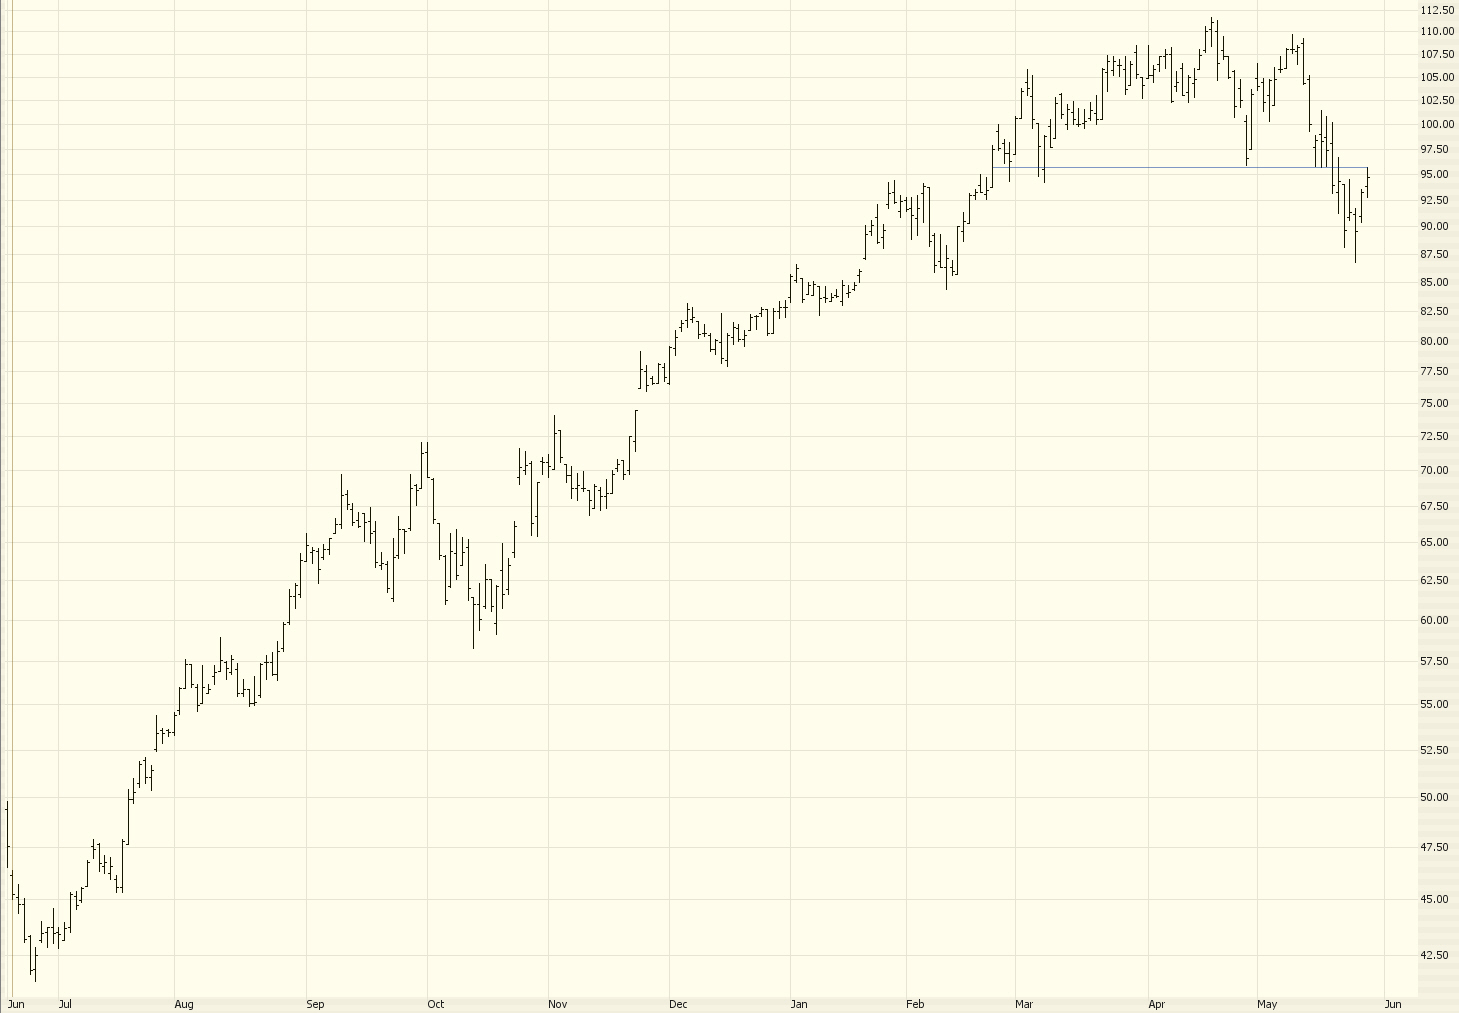
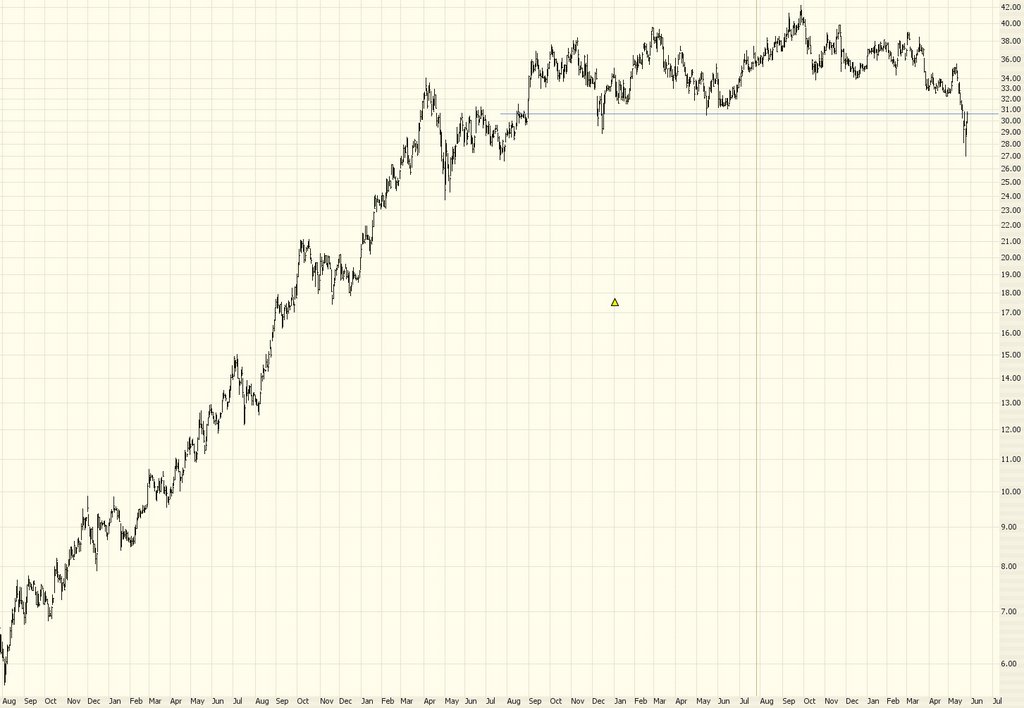
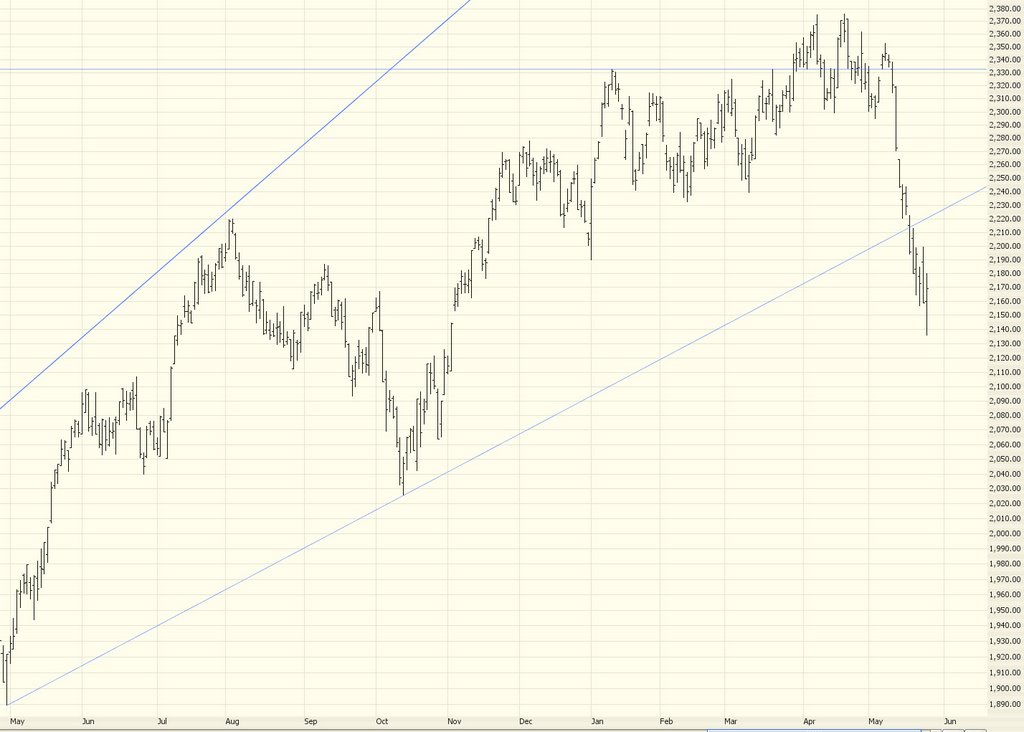
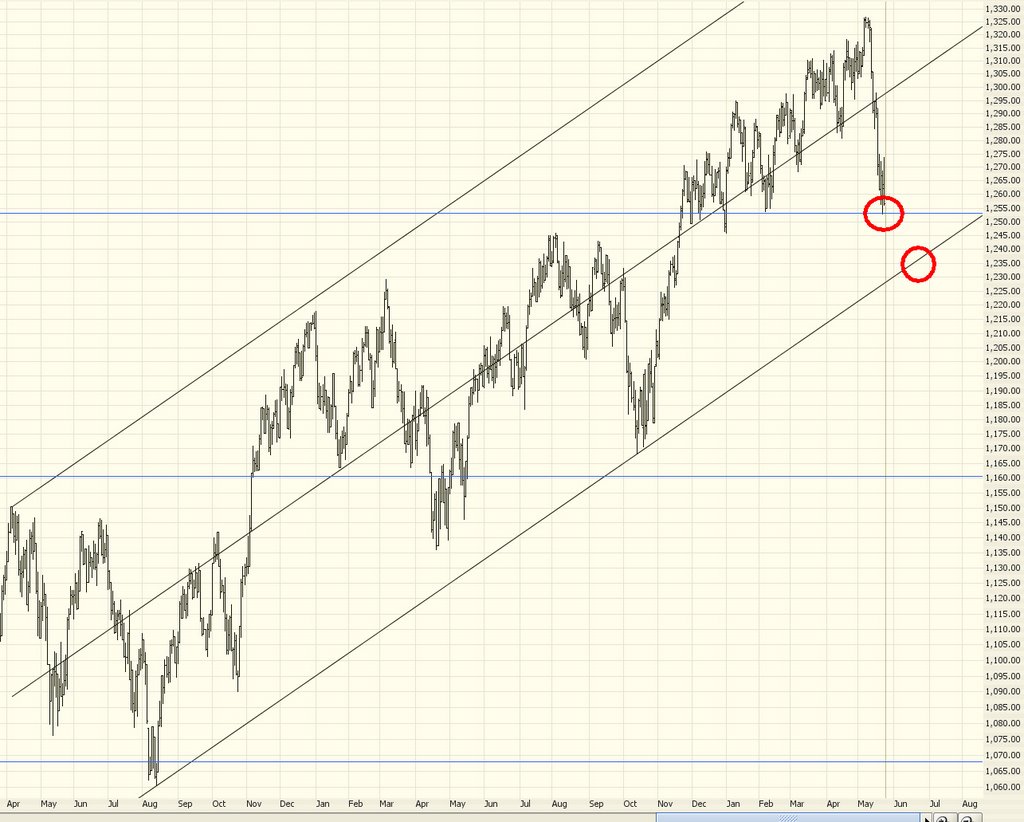
The NASDAQ Composite is representative of pretty much all the indexes and major stocks right now - - - a fall from May 10th until early last week, followed by a short, sharp upturn, followed by today's big fall. If we take out the lows set in October (represented by the thick red line) there is no doubt about it - we
will be in a bear market. No questions asked. (And it has nothing to do with big spooky round numbers like 10,000. Sheesh.....)