A Bounce is Very Likely
I've got to be quick; I've got a plane to catch! I believe:
+ We're firmly in a bear market
+ Any rises should be viewed as shorting opportunities
+ The nature of the market has utterly changed
However, I also think we're very, very, very due for a bounce. A few quick graphs:
The NASDAQ Composite is at a major Fib retracement level.
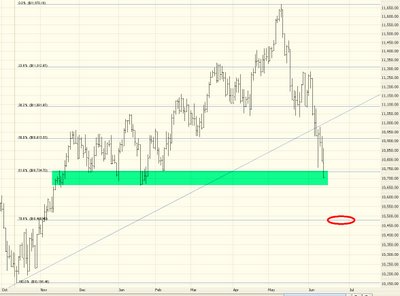
The Dow 30 is also at a major Fib level, added to which there is quite a bit of support at this level (see highlighted area in green).
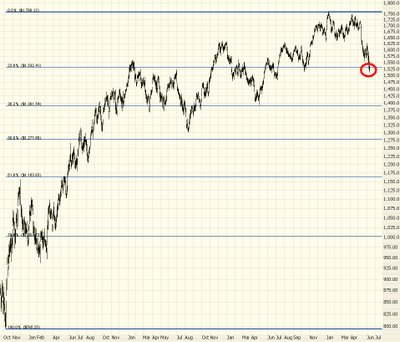
The NASDAQ 100 is also at a key Fib level, after been hammered over the past six weeks.
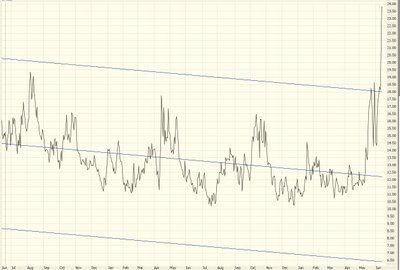
And the $VIX has gone stark, raving mad sky-high. This explosion of panic has to subside temporarily.
One other thing before I go. A few months ago, I tightened up the rules for posting on this blog. You had to be registered. All comments were moderated. And although it cut down on some of the obnoxious messages, I feel that it is impeding the free flow of ideas.
This blog has become somewhat of a gathering place for traders, and I'd rather their posts get published immediately. So I've relaxed all these rules and am keeping my fingers crossed that it goes well.
Thanks for your participation, and I appreciate all the support from my early self-pitying post! Good night, everybody.

6 comments:
Another 20 to 25 trading days before the bounce Tim!
I agree with Tim but the bounce will be sharp and last a day or so (options expiration). Next week back down AGAIN!
It's more than just fib support, there is fib level confluence with the major move down (from '00 to the Oct '02 bottom). So, 23% retracement back up, and 23% retracement down from recent high (as shown in your chart).
If this doesn't hold it, not sure what will.
I see a rally coming because we have fallen too far too fast. As most on this board know markets don't go down immediately nor do they go up immediately - they jig around. Anyway the VIX today is showing a "bearish harami" which means the VIX is probably going to go down for the next several days. You can see this clearly on any daily chart of the VIX using candlesticks. There are several recent examples of "bearish harami".
I seldom make recomendations but I am holding positions in Gray Wolf (GW), EWH and EWJ. The latter two are being held in anticipation of an overnight increase in both Hong Kong and Japan which should get a bump tomorrow at the open. The former is being held as a result of a filtered output coupling stochRSI(14,14) with a divergent and extaordinary excursion of the Chaikin oscillator from its 5 day MA.
Win lost or draw I will close these positions tomorrow morning as I can't stand the volatility.
Have a good trip Tim.
The market closed with the 3 sisters (DIA, SPY, QQQQ) showing a large white candle for the last hour. If you pull up about 10 days of hourly charts for these three you will see how often a large white candle in the last hour of one day leads to an up morning at least.
I find the hourly charts to be good predictors of the future.
cristi25 - it all depends on your time frame and appetite for risk. The charts I look at suggest IWM and LEH are done only way left to go is up - I have no feel for KBH it looks like it could do 2 points up tomorrow as easily as 2 points down.
Hope it works out for you. I'm done for the day.
Post a Comment