Showing posts with label oil. Show all posts

Thursday, October 05, 2006

What Does It Mean?

Another new high on the Dow today. I'm as confused as you are.

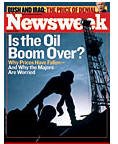
I was amused to see the cover story on Newsweek. For contrary thinkers out there, maybe this is another sign that oil's recent plunge is done for now and you should go bullish. I certainly have.

The recent breakout in the Dow leaves us thinking: what does it mean? Two possibilities are (1) a sustained, meaningful breakout, past 12,000 and beyond; or (2) a fake breakout.

I was looking at a century-looking chart of the Dow 30, and I saw something fascinating. Check this out (clicking on the image for a bigger version):
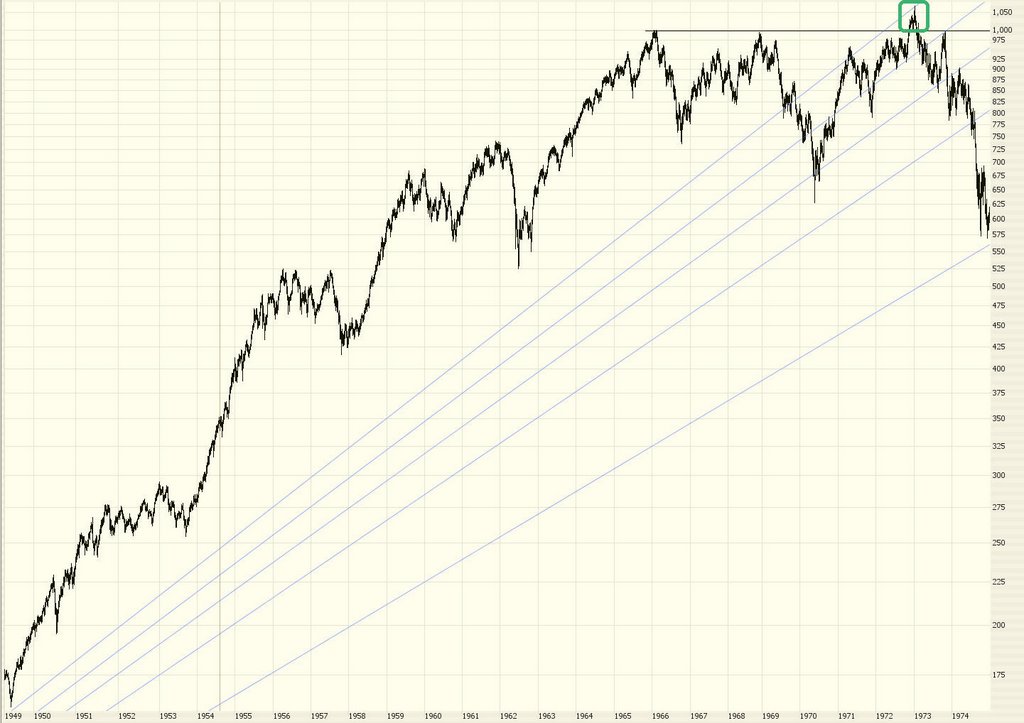

As you can see by the circle, there was a breakout in 1972. The pattern is similar to what we're seeing today. A long struggle to get past a major milestone (back then, it was Dow 1,000 as opposed to Dow 11,750). It broke out in Autumn - just like now - and it pushed the Dow up another 4% or so until January. Then, voom, it started plunging hard.

Does that mean this is what will happen this time? I don't know. Maybe. But it at least proves that a new breakout, even on a major index, doesn't guarantee a sustained movement to the upside. Here's what our own market looks like in the present day:


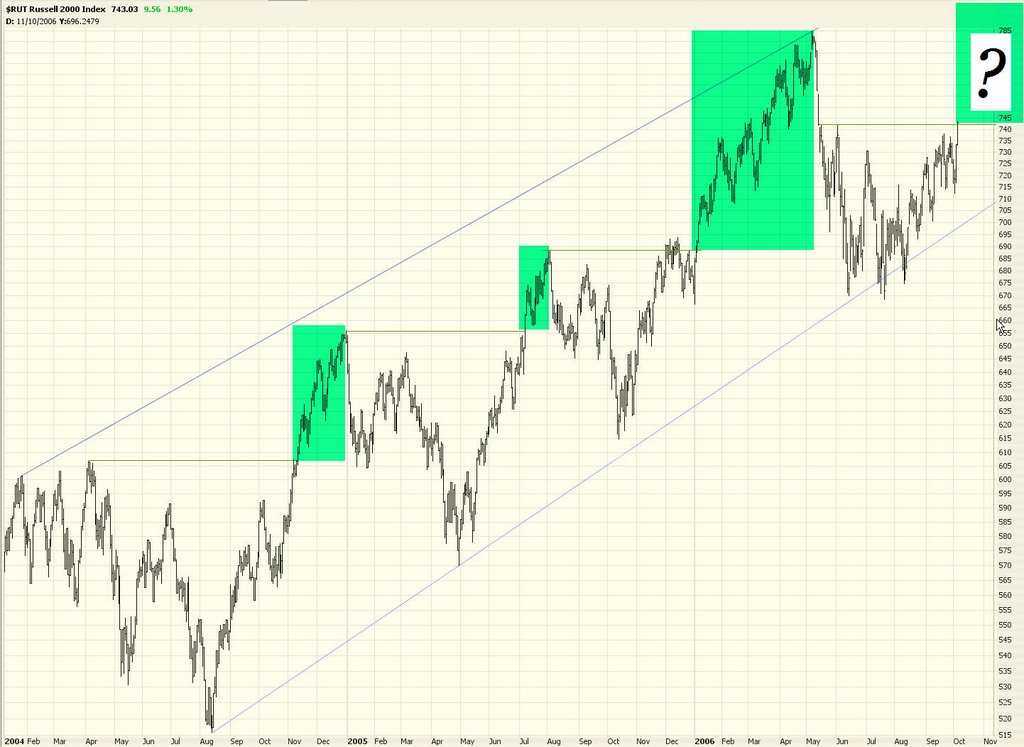
I was disappointed - very - that one of my last holdouts, Russell 2000, pushed through resistance today. As prior breakouts indicate, this could be very bullish for this index. I've shaded in green the movement following similar breakouts. I'm no longer in this position and currently am holding a mixed bag of puts and calls (the latter being mostly in energy).
Monday, September 25, 2006

Bad News Bears

Today started off well enough. The market's modest rise in the morning got blown to smithereens by the drop in housing prices (for the first time in 11 years), and oil services was down hard. It was enough to make a bear's heart go pitter-pat.

Sadly, the bulls took charge and stampeded most of the day. The Dow was up over 100 at one point, although it eased back to close up "only" 70 points for the day. OIH, $OSX, and other oil-related stocks formed hammer patterns, signaling a short-term bottom. So what started off as an "A" day wound up a "C-".

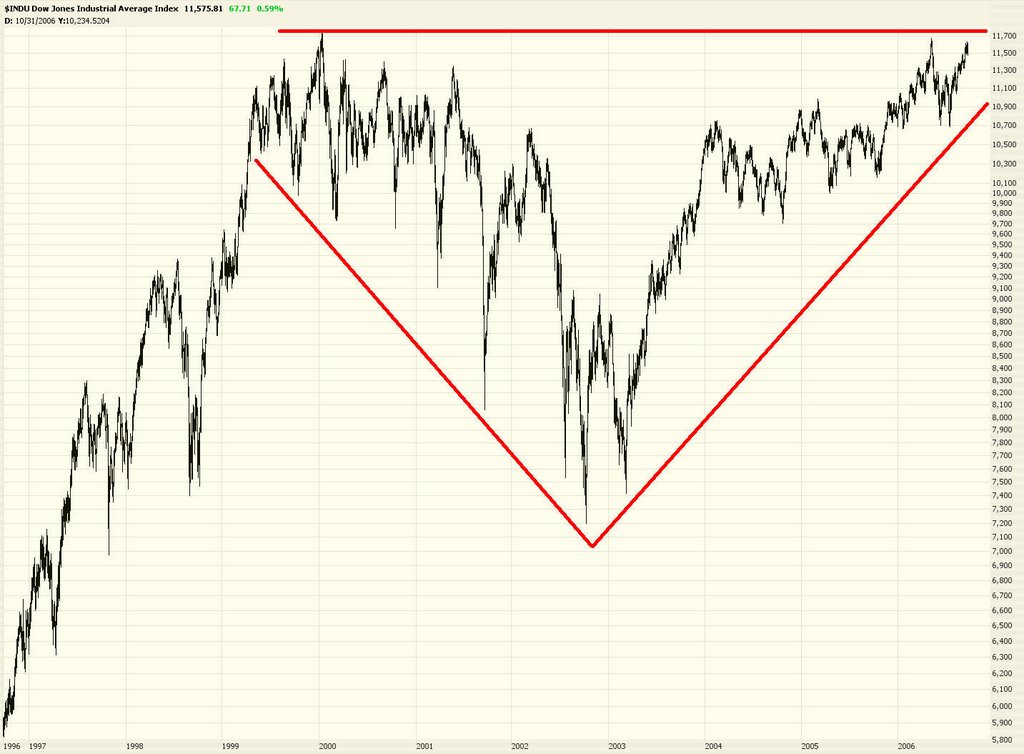
Let's take a step back and look for the past decade at the Dow 30. You can see why people don't really know what's going to happen next. We're at the very top of a large upside-down triangle. Busting through lifetime highs would take ungodly strength (and would cause me to jump off the nearest bridge). Sinking into another stairstep-down pattern seems completely elusive at this point, although that's the only thing that will make this "our" market.


The SPX, a broader index, isn't nearly as close to its lifetime highs, but it certainly received the "all clear" signal from the bulls today. There is a meaningful amount of upside between the current SPX price and the next Fibonacci retracement level. That isn't good news for us bears at all. Today is the kind of day that shows the bulls are still firmly in charge, even in September, historically the weakest month of the year.


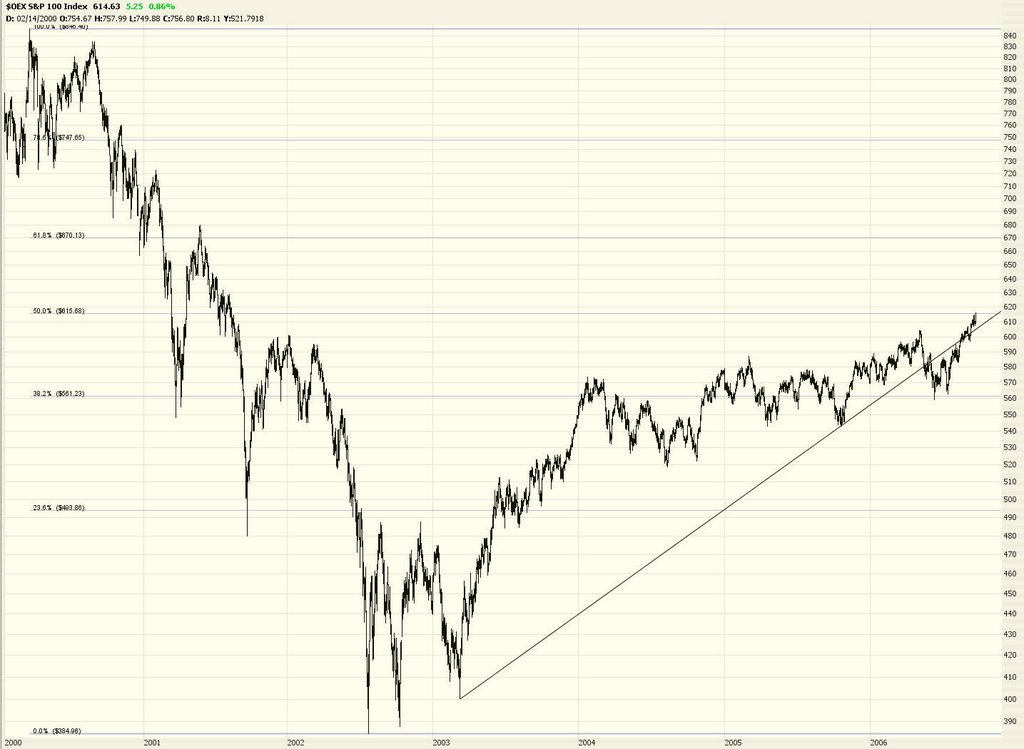
The $OEX is pretty much perfectly at the 50% retracement level.


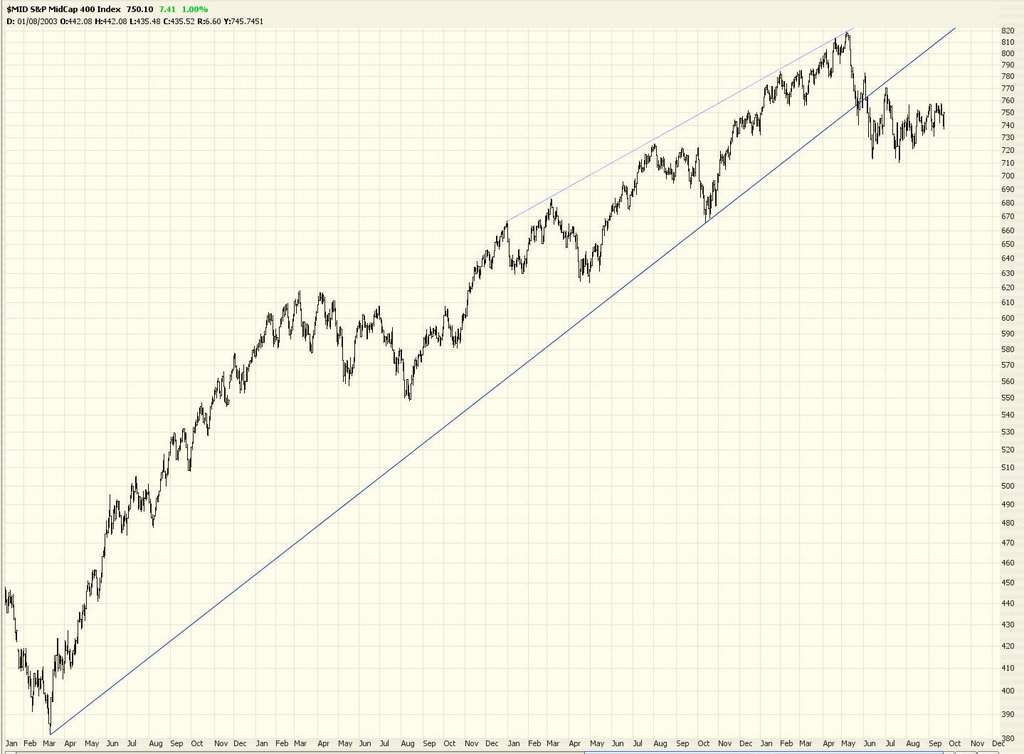
The $MID to me is looking sort of alluring as a potential put purchase. The stop price is pretty tight. Mind you, today's action is not encouraging. But if it's a one-day wonder, looking for shorts at these lofty levels is a good exercise.


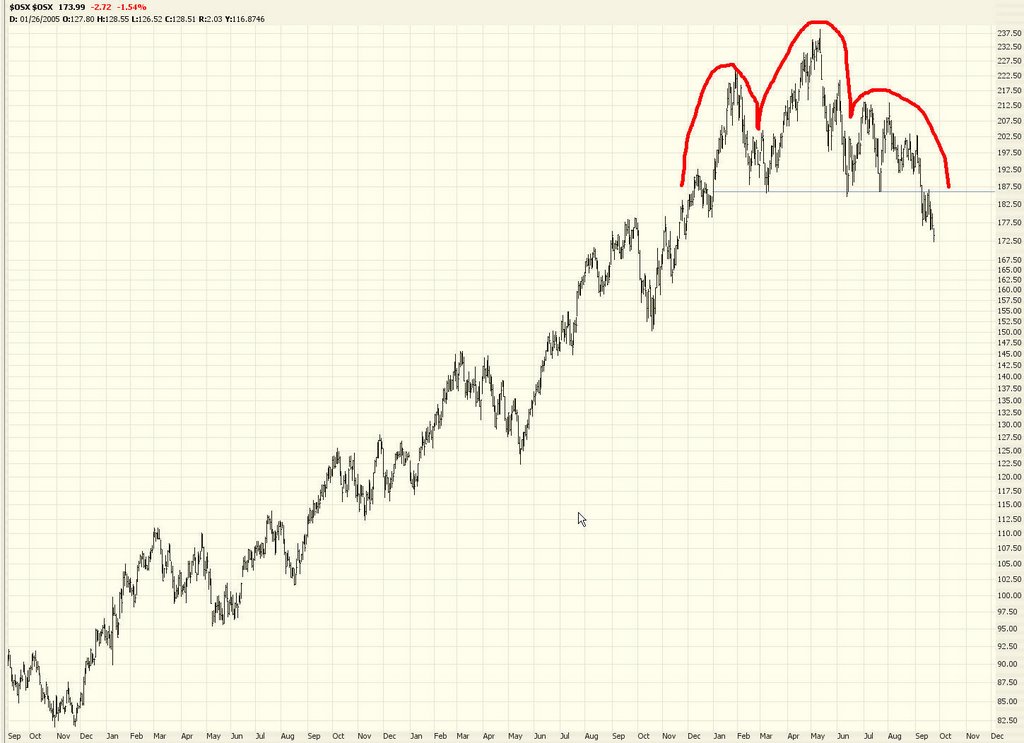
One honest-to-goodness down market that's been really good to me lately is oil. The $OSX, shown below, is very similar to the OIH, and you can see its squeaky-clean head and shoulders pattern. Things might have bottomed out for the short term (like the next week or so), but it's been great so far.


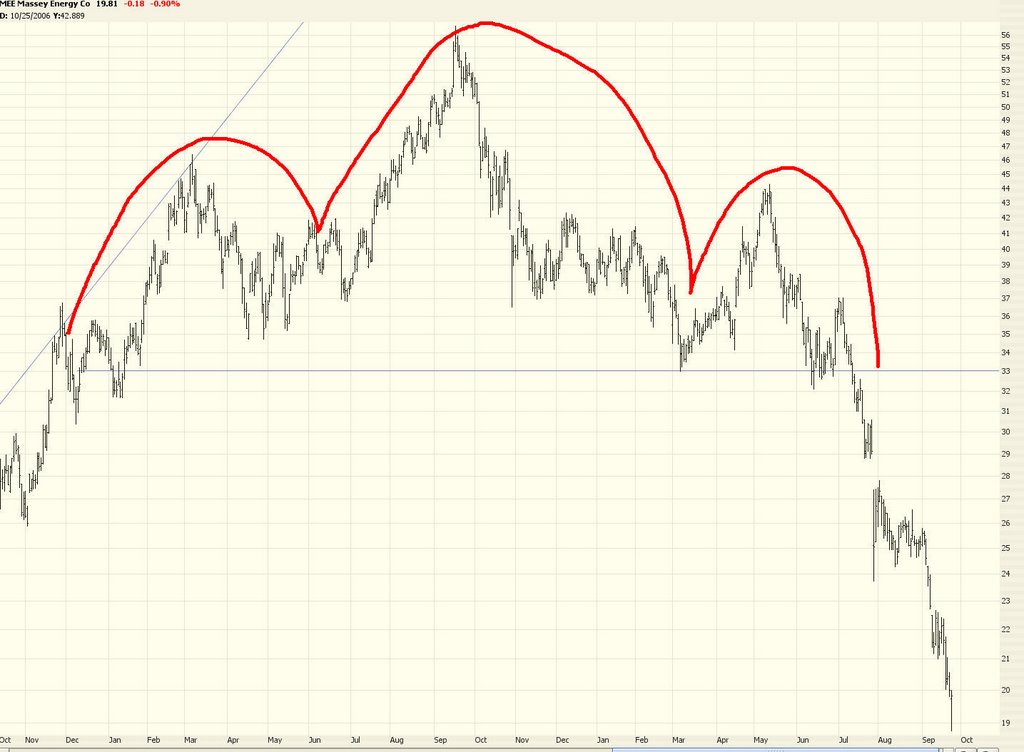
I recommended Massey Energy, for example, weeks ago. It has taken a terrific tumble.


But take a look at today's candlestick pattern. A honkin' big hammer. That spells short term bottom to me.


The NASDAQ 100 is extremely close to the make-or-break point for bears. Crossing above the line shown here would spell bad news for at least a little while for the bears.


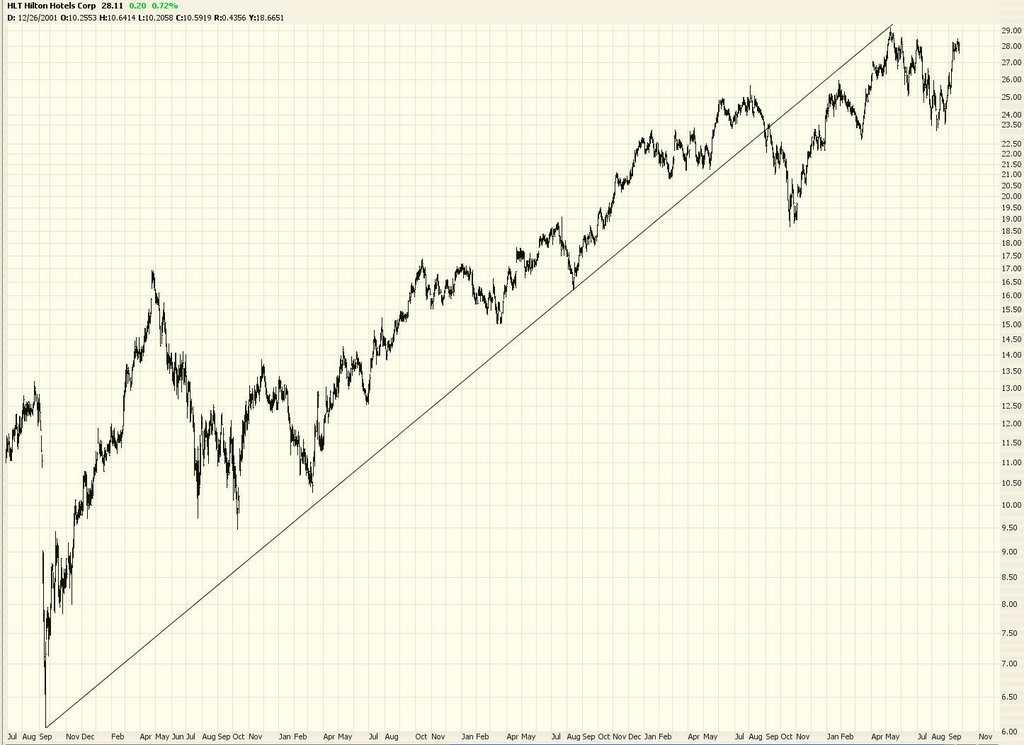
Hilton (HLT) caught my eye today as a short candidate.


As did NOV, which is in my (obviously) favorite pattern, the H and S.


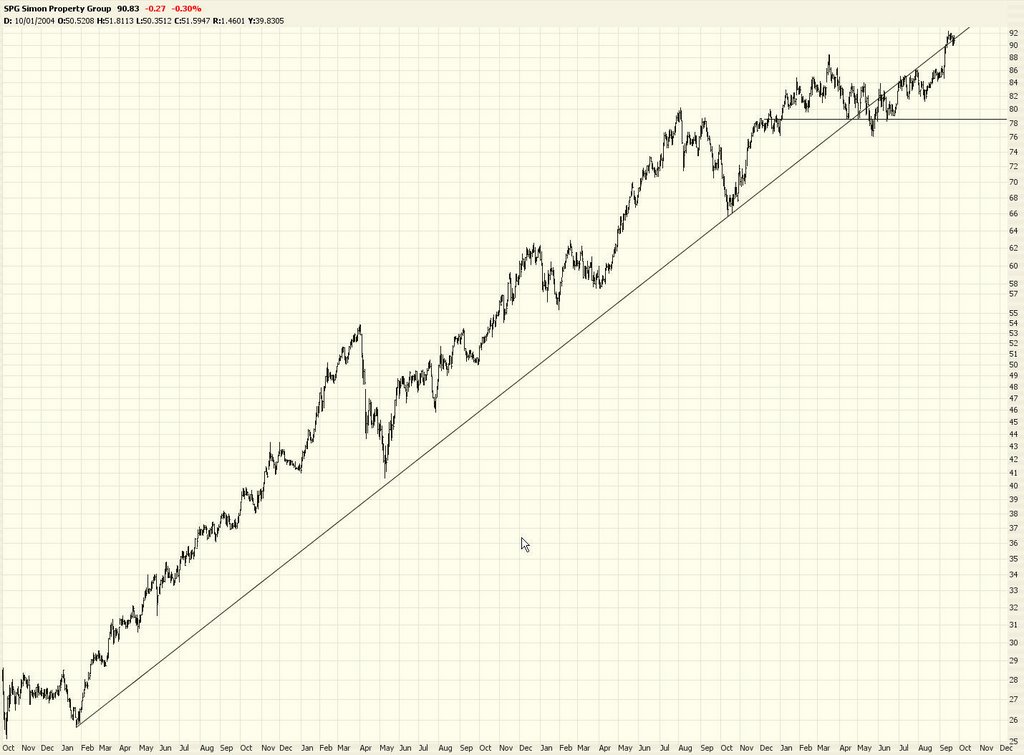
For those skeptical about the still sky-high REIT market (in spite of all the bad real estate news), take a look at SPG.

Wednesday, September 20, 2006

Slippery Oil

For a Fed day, it was relatively peaceful. The bulls got virtually all their gains within the first half hour of trading today. Sigh. Oil saved my bacon again, though. It would have been a rotten day otherwise.

The highlighted area indicates the Fed zaniness. Usually the market goes stark raving mad after an announcement. This swing was actually really modest. I guess the lack of volatility has extended even to the most extreme of events. It was a snoozer, pretty much.


As I mentioned, oil (OIH in particular) continues to go great. We've got an honest to goodness breakdown, with a beautiful head and shoulders pattern, post-retracement, at this point. This is textbook perfect.


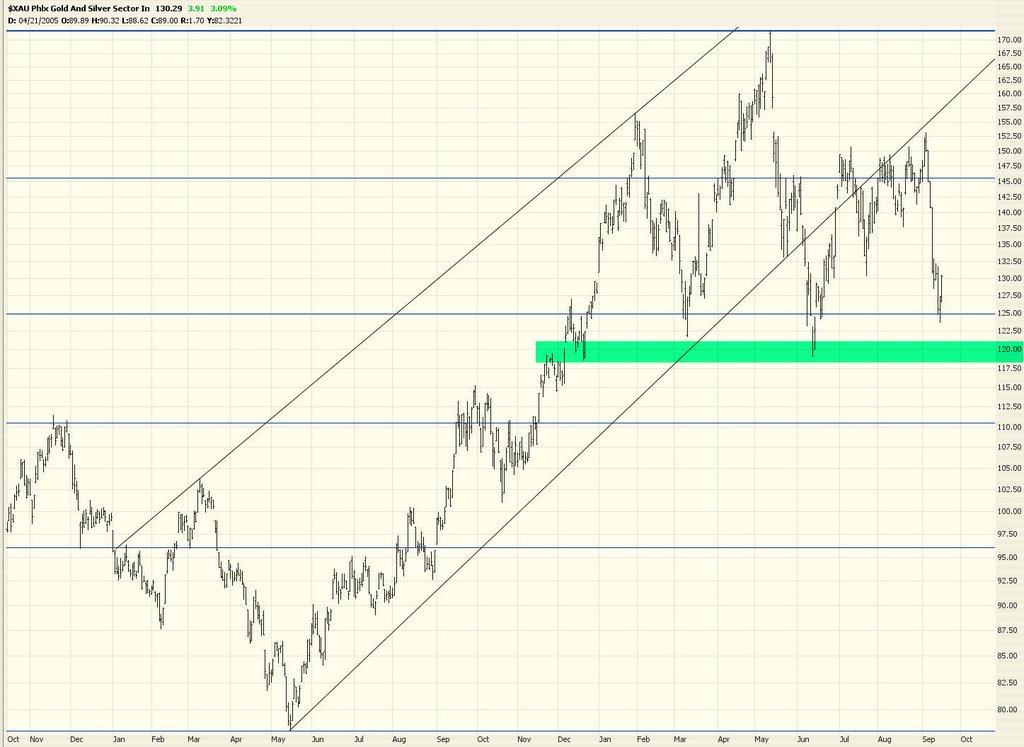
The gold and silver index, $XAU, seems a bit stuck at its retracement level. It is even more of a huge head and shoulders pattern than OIH, but it hasn't broken down yet.


The S&P had another strong day. Indeed, it's been disgustingly strong since mid-July. We haven't seen this much consistent strength since last autumn. We're either at a double top or - - with our luck lately - - we've got plenty of room left (green shaded area) on the upside. Oh, I'll mention this a hundredth time for those who missed it - - click on any image to see a bigger image.


The Russell 2000, on a long-term basis, is obviously far, far above its "Internet bubble" highs. It broke those long ago.


At this point, if it breaks through the horizontal line shown at 742.26, we're in even bigger trouble than we are already. That would be extremely bullish.


One stock I happened to come across today is CAL (Continental Airlines). Looks like another nice short/put-buying opportunity with a pretty low-risk stop price.


Things still haven't turned to the bear's favor. Not at all. I'm glad for OIH, at least. That, and a lot of related stocks, have been doing wonderfully poorly (which is good for the bears).

Monday, September 18, 2006

Oil and Gold turn to Rubber

Just a quick intraday post.

Oil and gold are having a pretty big up day, which is no surprise considering how badly they've been pummelled in recent weeks.

Oil - more precisely, OIH, which I consider a proxy for the major oil services stocks - is doing a textbook retracement to its neckline. The bolder among us may want to short aggressively here. This is a gorgeous head and shoulders pattern. It's always scary shorting at a time like this, naturally, because there's a lot of strength. But retracements to necklines often represent the lowest-risk time to go short, since you've got a crystal-clear stop loss level in case you're wrong.


Gold ($XAU) is murkier. It was forming a head and shoulders pattern, but it didn't get back down to its neckline. In addition, the price has pushed its way to a major Fibonacci retracement level, which implied the selling was over for now. So I'm steering clear at this point.


At the moment, the stock indexes are showing a skosh of weakness in spite of earlier strength. Let's hope it continues until the close!