Showing posts with label txt. Show all posts

Friday, February 09, 2007

Well Put

Good day on the market today, bears. This time, after a look at a couple of indexes, I'm going to show just stocks on which I think puts might be a lucrative position. They have a number of properties in common - - the stocks are high priced (meaning the options can get really juicy). They have options with decent volume. And they seem to be running out of steam.

The stock market finally - FINALLY! - made its mind up on direction today, and it was down. As you can clearly see from the horizontal line of support, the moment it pushed through, it was party time.


Looking at the past several months, you can very clearly see that early in this bull phase the price action and RSI were lined up (green lines) and yet, for a couple of months or more, RSI and price action have been absolutely divergent (red lines).


Going back to an even wider time range, you can see how lofty the S&P 500 is right now. Which is why my puts went up so fast today.


But let's not get too excited yet (lest I get another cowardly voicemail from an Australian hermaphrodite). There have been many times that the market has taken a quick, exciting drop. I've marked each of them here with red lines. And each time, it shakes it off and simply moves on to new lifetime highs. So I'm willing to concede this may be fake-out number twenty thousand and six.


The rest of today's entry is just stock charts, pure and simple - - again, with the focus being on puts. I've mentioned many of these before, and own puts on most or all of them. Goldman Sachs (GS):


Cabot (COG):


Capital One (COF):


Bear Stearns (BSC):


AutoZone (AZO):


Merrill Lynch (MER):


MicroStrategy (MSTR):


Research in Motion (RIMM):


Textron (TXT):


Exxon Mobil (XOM):


Have a good weekend. To most of you, at least.

Thursday, November 09, 2006

Sea Change

It was nice to see a good, solid down day. Particularly when the market blasted higher from the opening bell, riding on the wings of CSCO's strong earnings. The fact that the NASDAQ actually fell after such a strong opening is great. Green on the screen is a pleasant change these days.

The real change going on is in the political/social pulse of the country. 1994's Republican sweep into Congress preceded the monster bull market of 1995-2000. Conservative values, religion, the 'contract with America' - the whole schmear.

Now that the pendulum is starting to swing the other way, what do we have? Cover stories about aetheism, bestselling books about atheism, a very left-of-center Speaker of the House. It's like a mirror image of 1994. And don't you think the odds of a Democratic president in 2008 are pretty strong? The pendulum is swinging to the left, and I imagine it's going to be approaching socialism before it starts tipping the other way again.

How good do you think that's going to be for corporate profits? Can you imagine what kind of nuclear bomb will hit the market when the capital gains tax is eliminated and people must pay ordinary income on stock profits? After all, no more tax breaks for the rich!

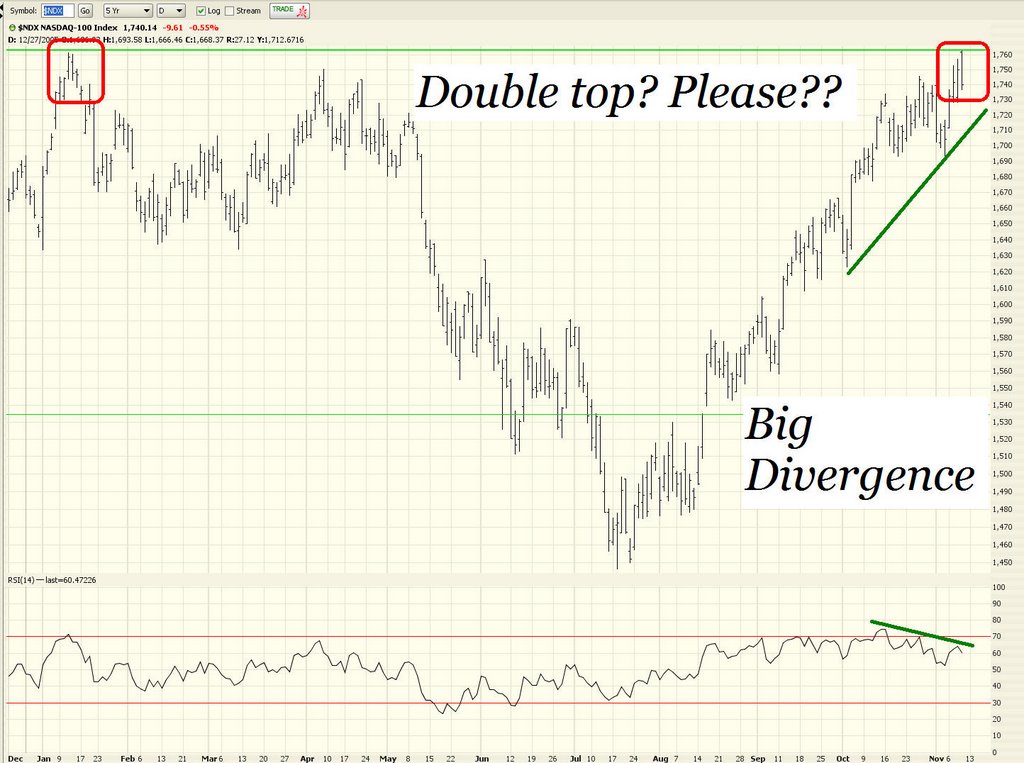
Like I mentioned, the NASDAQ fell. The $NDX pierced its prior 100% Fib level (which, cough cough, I've conveniently skooched upward to today's high). I like the weakness today.


The Russell 2000, a perpetual favorite of mine, has puts which I've been gobbling up at these levels. Someone asked about IWM - to which I respond, yes, I like this for a short position. I wouldn't call it a head and shoulders, but I like how it is weakening.


I think I mentioned a couple of days back going long the $SOX. Nahhhhhh. I changed my mind and bought puts yesterday. I'm glad I did. This did well today, and it's got a really obvious stop price (and a really obvious this-was-the-right-choice price).


I've never drawn a trendline on an RSI until today, but it works rather well, don't you think?


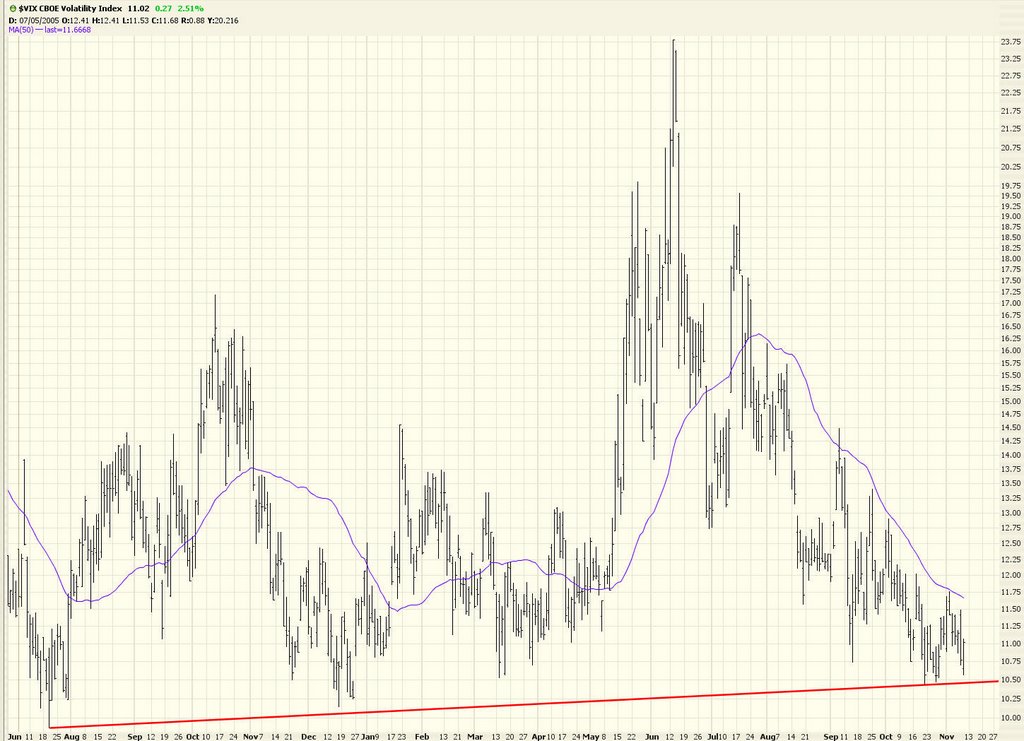
The cool thing is that the $VIX is slowly but surely turning upward. A series of higher lows, marked by that ascending trendline, illustrates this. C'mon, $VIX!!!


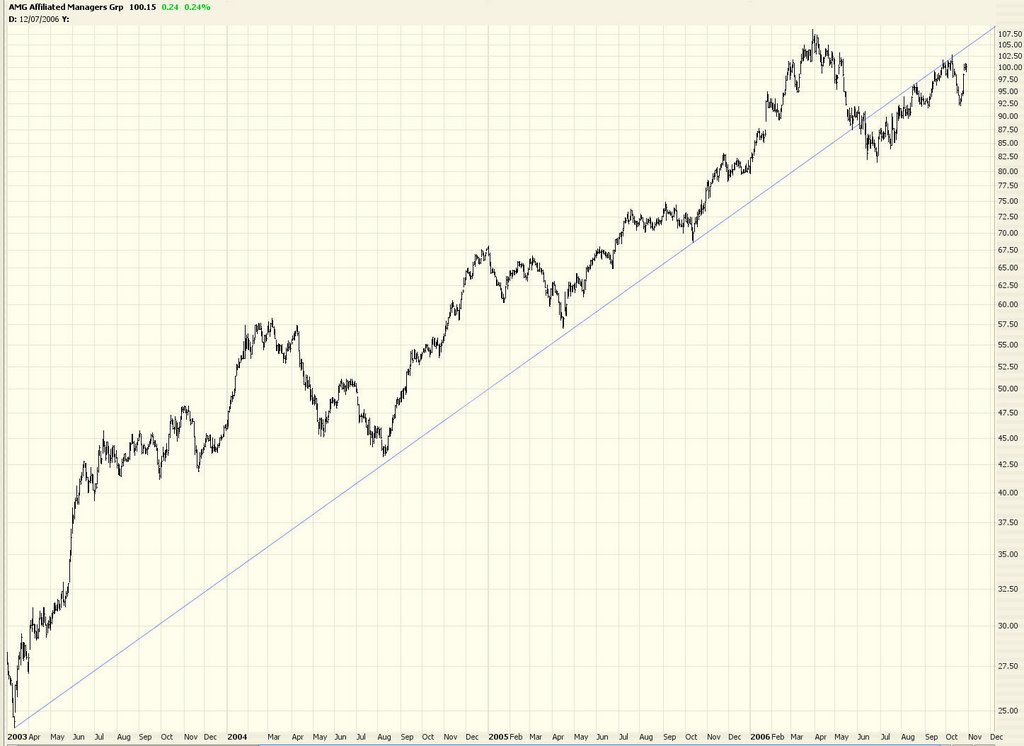
Now for some specific short suggestions, all of which have put options available. AMG:


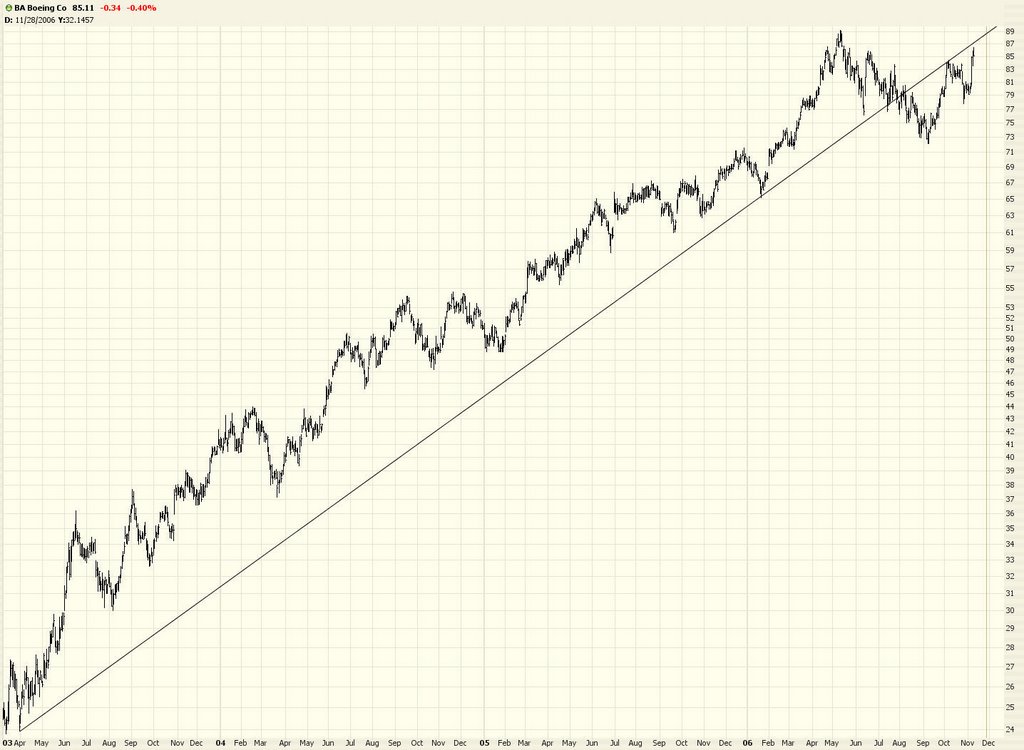
BA, which kissed the underbelly of its former trendline today:


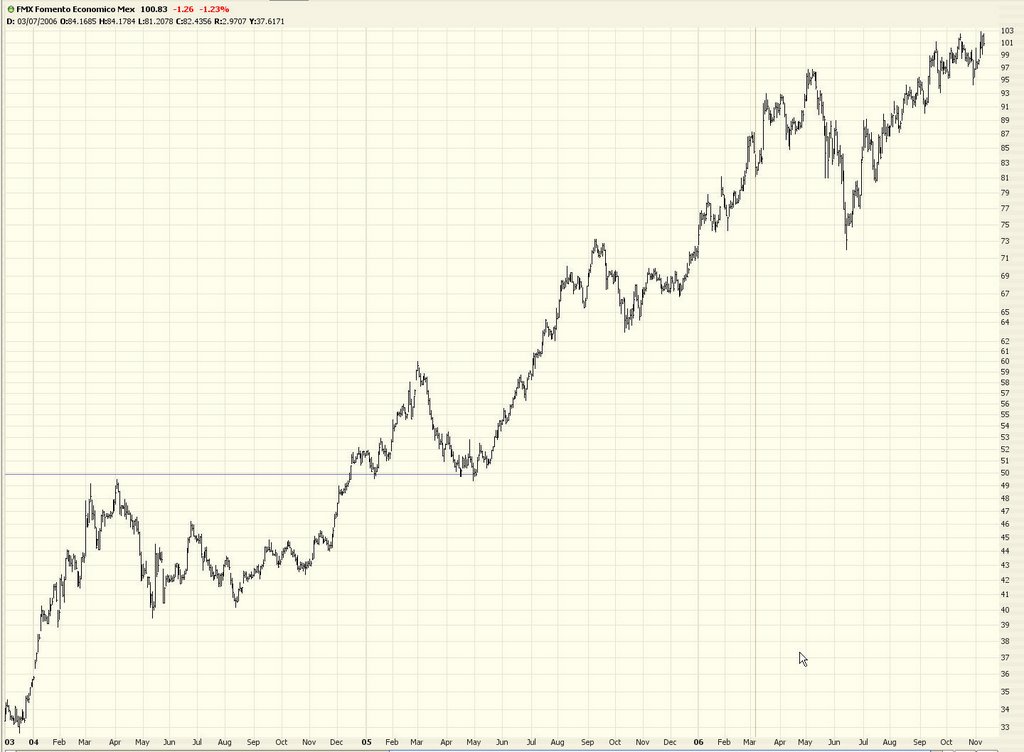
FMX (no options on this, I don't think, but......):


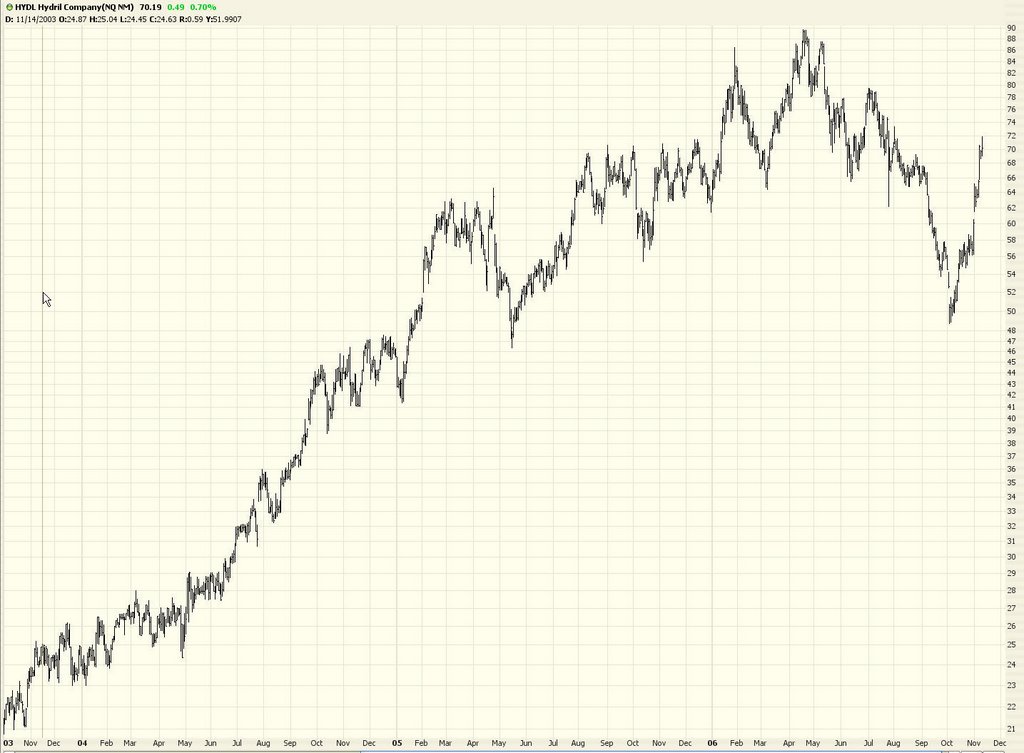
HYDL, which busted its head and shoulders pattern, but still looks sweet:


TXT:


Hey, I could use another dose of Down tomorrow. We'll see.

Monday, October 30, 2006

Tasty Shorts

The market didn't do too much of anything today. Oil (and therefore OIH) softened up a tad, which is consistent with my speculation that the energy market is going to resume its downward movement. Gold, in spite of the metal's rise in price, softened too on the $XAU. The Dow just lost a handful of points. At least we didn't have some big 'recovery' day after Friday's nice drop.

I just wanted to share a few charts on which I own puts right now. Here's AMG. This pattern is basically in a "post-broken trendline" situation, which is a favorite of mine. The general uptrend has been clearly broken, and the stock has recovered partly or fully to the underside of the trendline. These often represent low risk/high reward trades. Let's call this kind of pattern PBT for the sake of today's entry.


LEN is just a nice topping formation:


NDAQ looks pooped:


TXT is another "PBT":


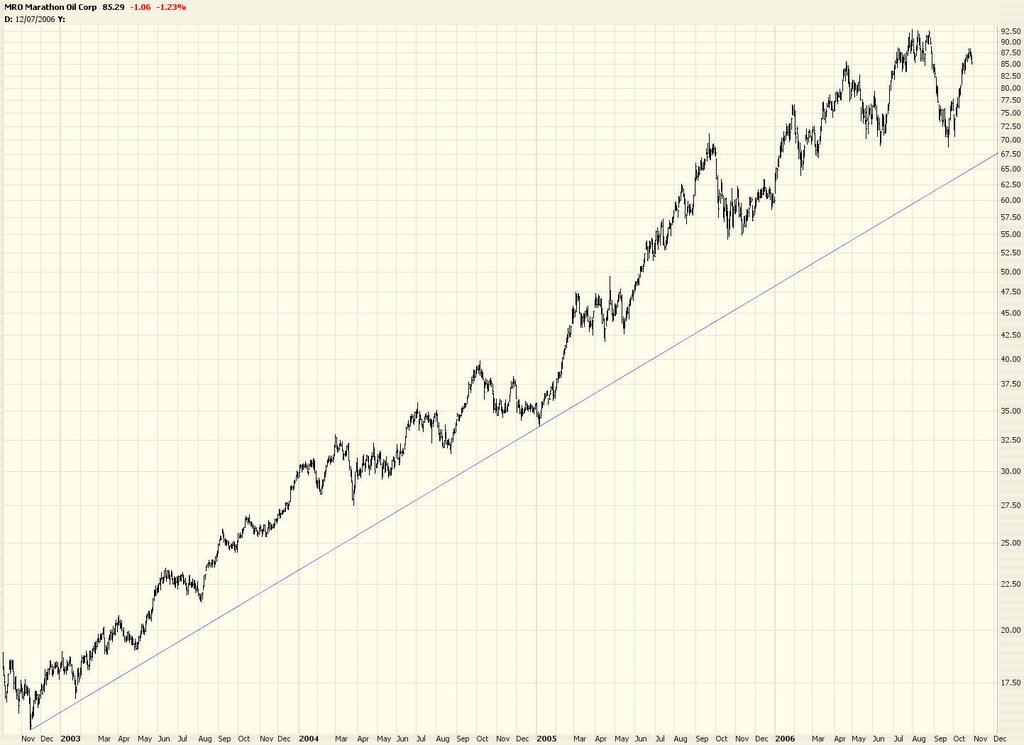
I've mentioned MRO a few times already:


Altria (MO), yet another "PBT", which seems kind of common these days:


The VIX went up some time, which is also consistent with my view that we've bottomed out on volatility and complacency. The market misbehaved badly in September and October (typically bearish months, yet the market went up) so let's hope the typically bullish months of November and December likewise confuse everyone! We bears could use a break. A sustained break.

Tuesday, October 24, 2006

The Tireless Bull

Each day seems to bring more of the same. The market jumps down. Firms up. Dances around the +0 net change all day long. Then does a late day surge. It's teasing the bears. And the bulls don't seem to be getting tired.

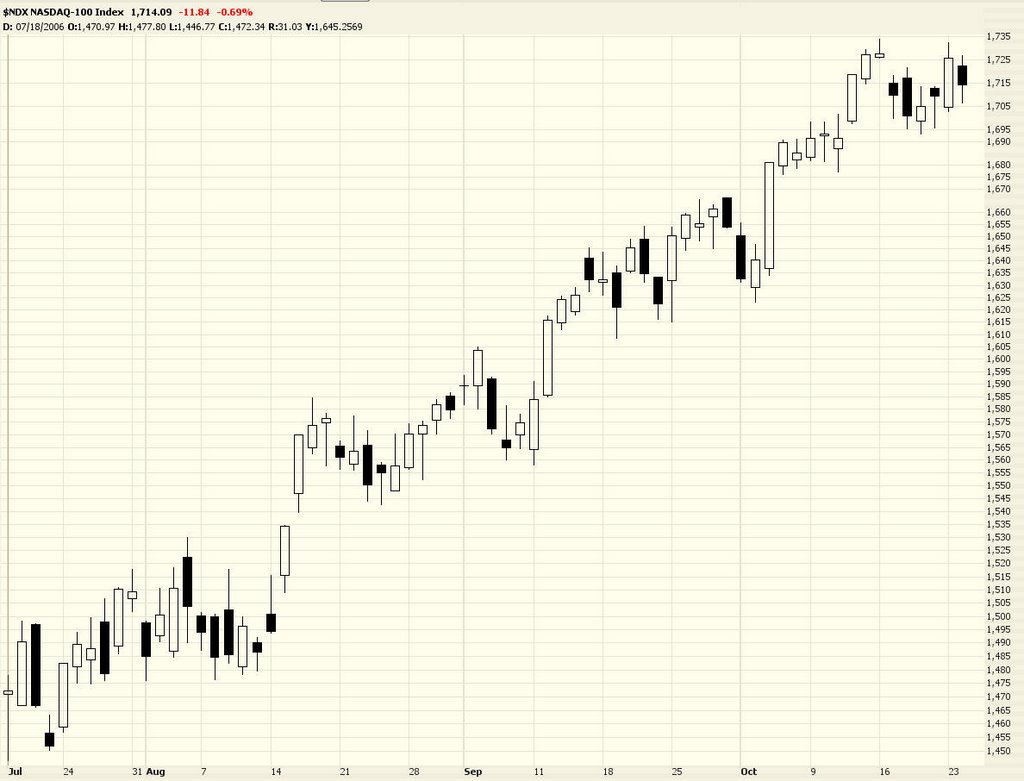
One silver lining to this very big cloud is that the leadership is thinning. Take the NASDAQ 100 for instance. In spite of the Dow making lifetime new highs virtually every day, this index has been a laggard. It was even down a decent amount today.


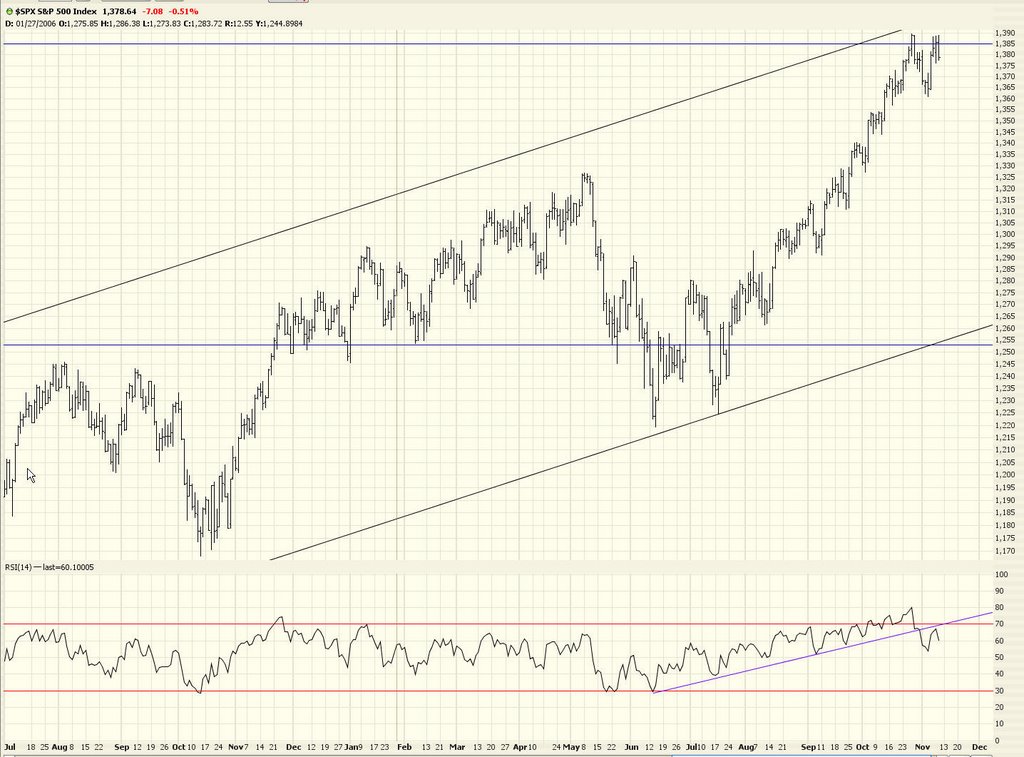
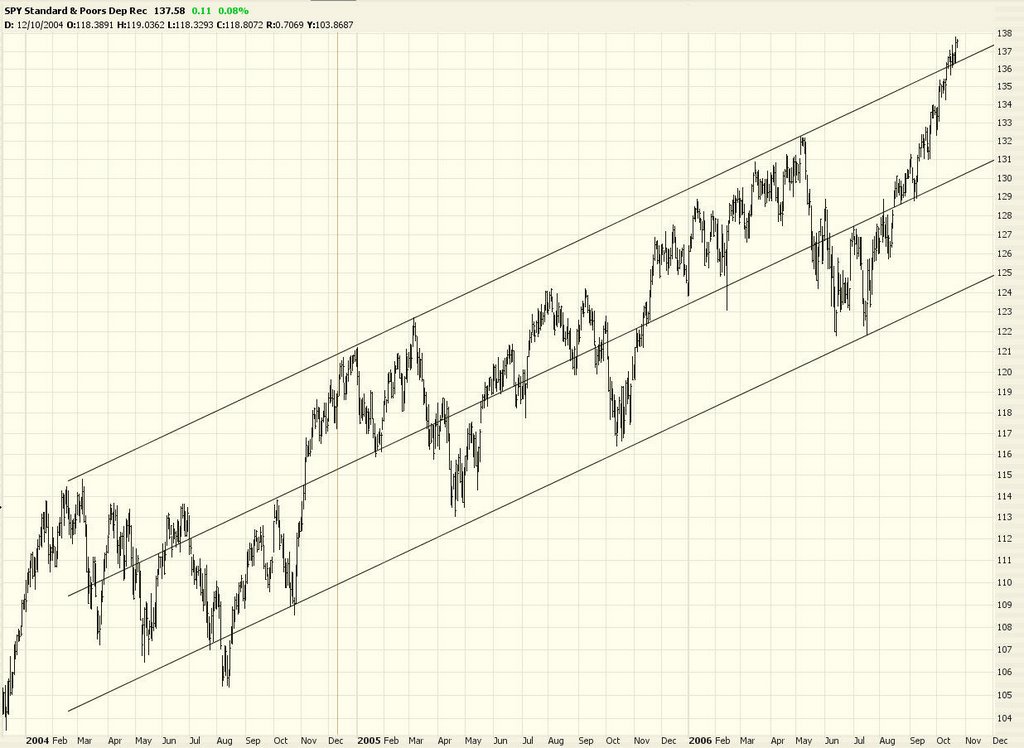
As you can see by the chart of SPY, the market is ahead of itself. It has "overshot" the channel, just like it "undershot" it early on.


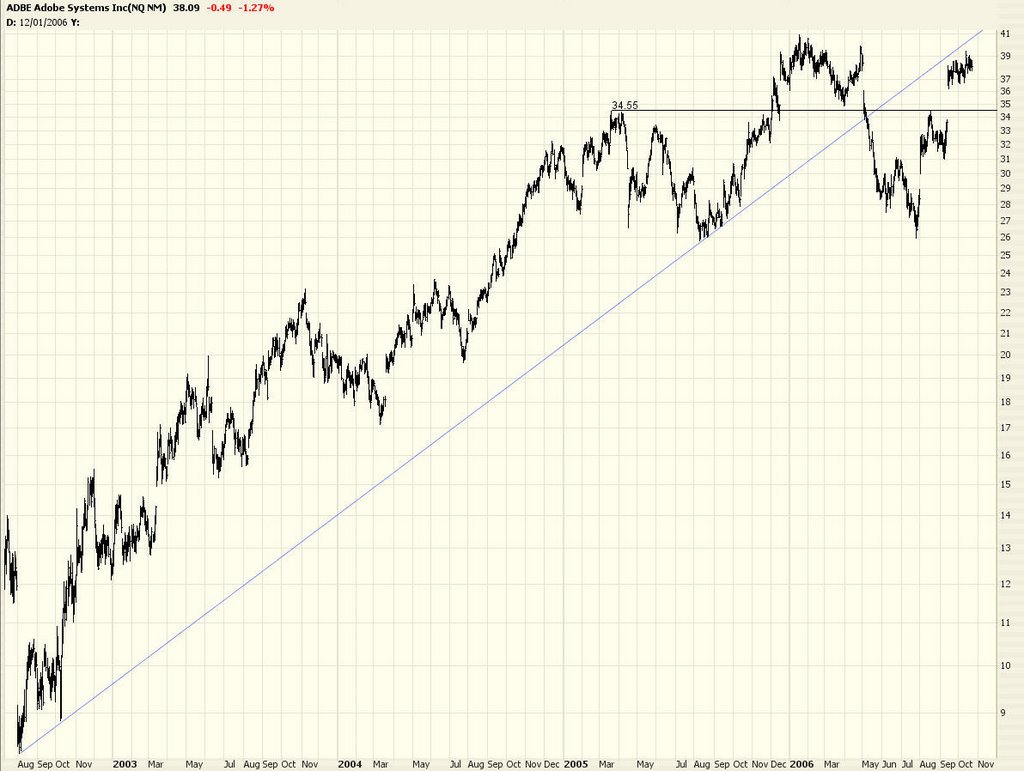
Worth considering as a short - Adobe (ADBE):


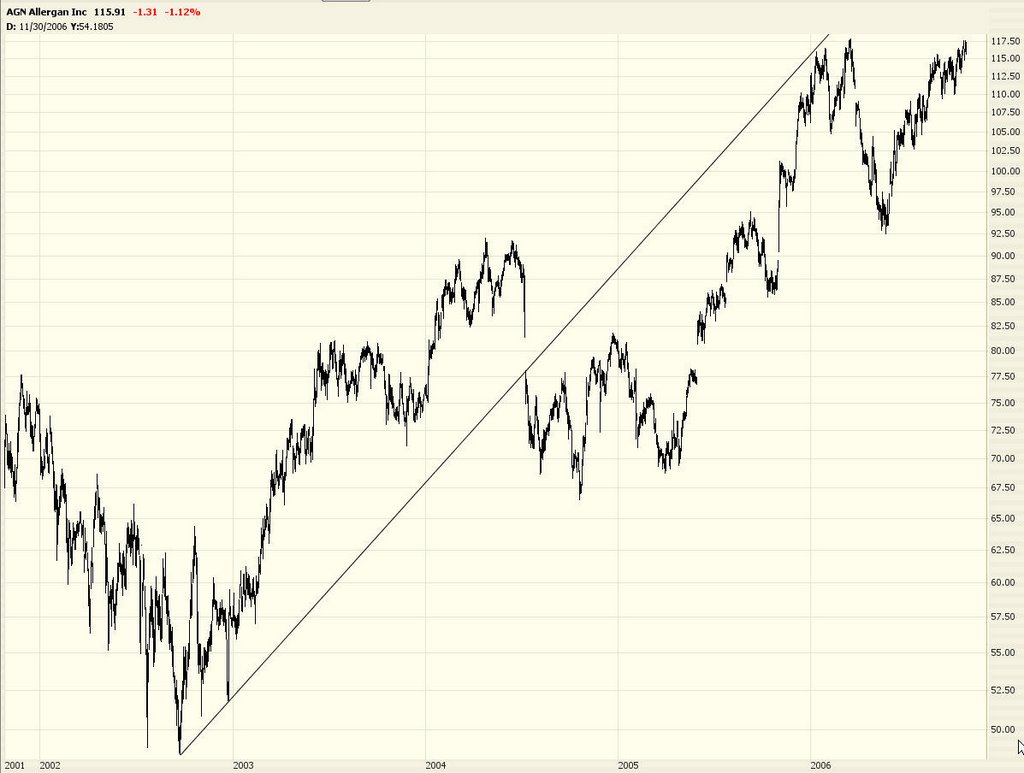
Another candidate - Allergan (AGN):


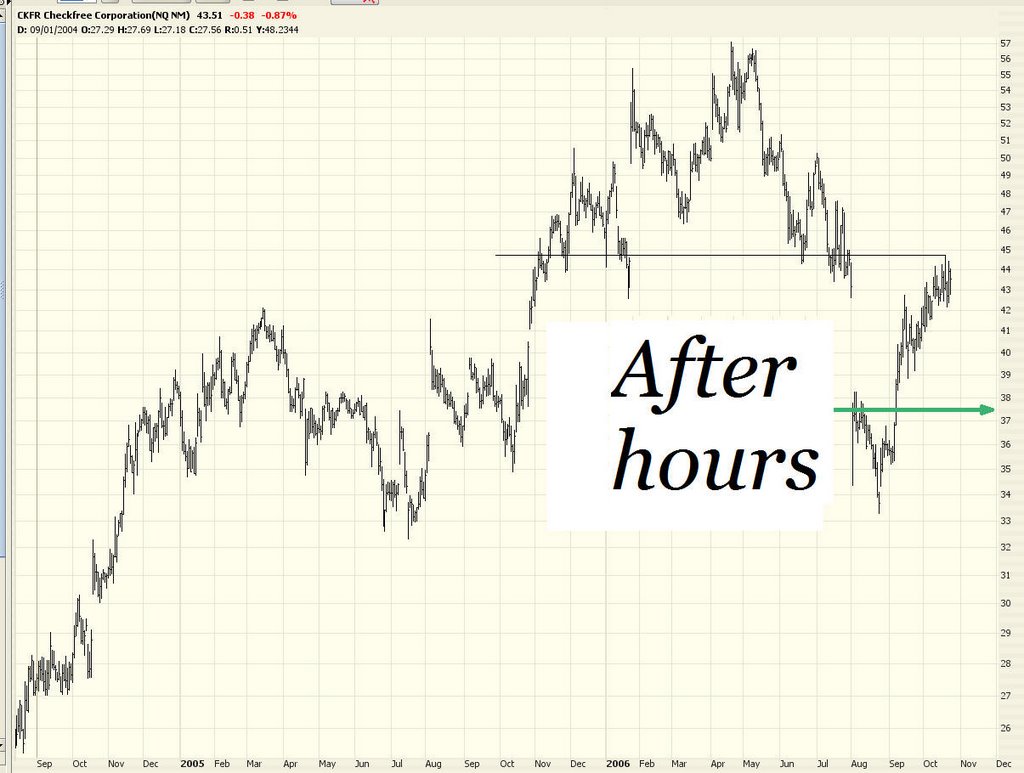
I suggested Checkfree (CKFR) earlier this month, and it's getting smashed in after hours trading today. Nice to have a bright spot in this horrible market.


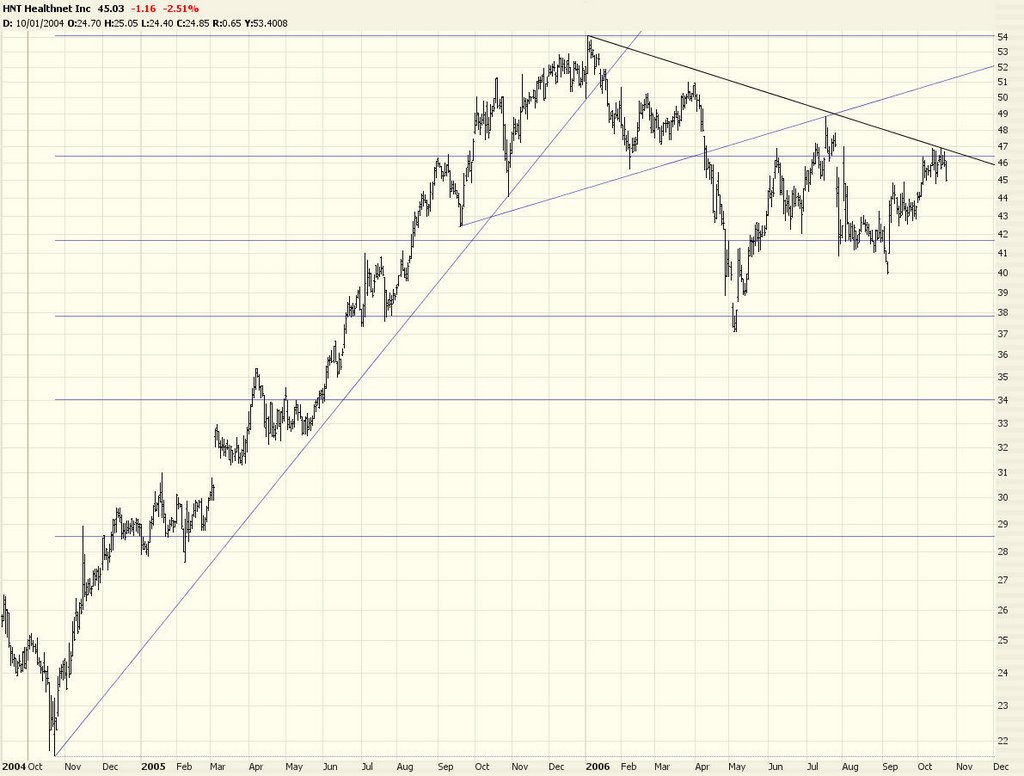
Health Net (HNT) is another short candidate.


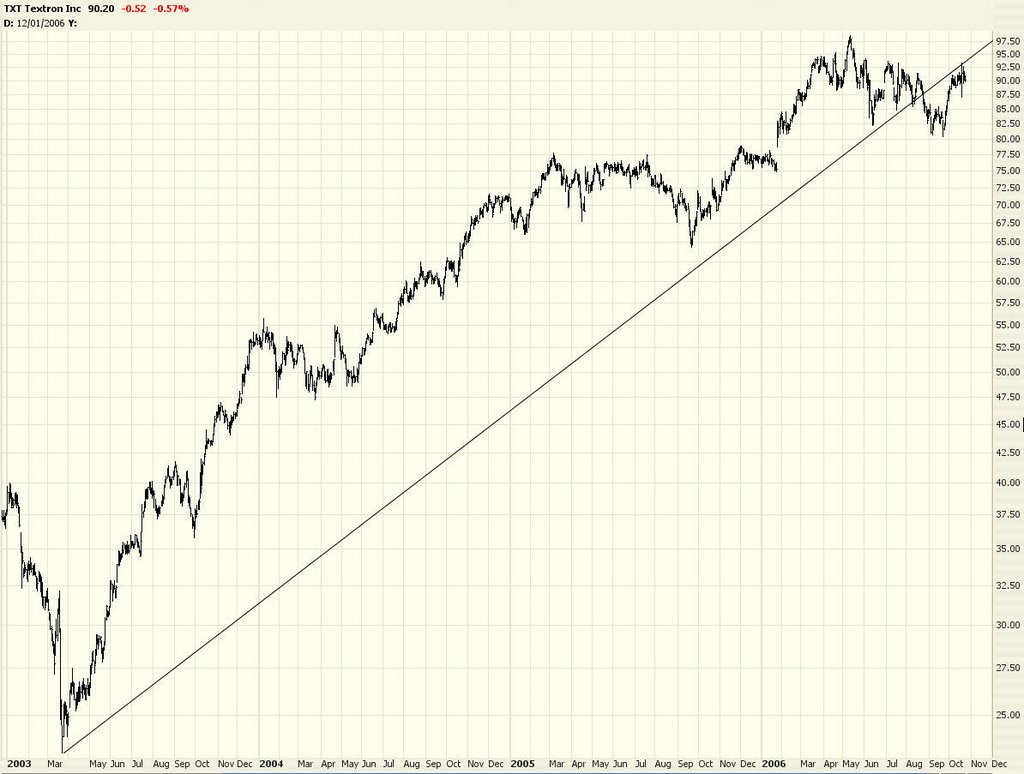
And, lastly, Textron (TXT):


I've noticed in the comments section (which is much quieter now that the anomymous people are locked out) that people sometimes append their ideas with "do your homework" or "do your due diligence" or something else along those lines. Let me save your typing fingers - - you don't need to say such things. The whole idea behind charting is that whatever knowledge the market has is already built into the chart.

Does anyone really think that by puttering around the net they are going to uncover some explosive new information about a stock, be it good or bad, that it absent from the minds of the collective body that trades it? If so, have at it. I personally think you're wasting your time.

To everyone who has survived so far - my hat's off to you. This sucks!

Wednesday, October 11, 2006

La De Da

It seems a tiny passenger plane accidentally running into an apartment building has more import to the world financial markets than a crazed dictator with nuclear arms. Go figure.

I thought we had 'em today, but the plunge protectors (or whoever.....) pushed most of the losses off the Dow. Phooey.

I had a great day with Legg Mason (LM) and, generally speaking, things were pretty good. I humbly offer up a few suggestions for shorts/puts, simply because I'll never wise up........

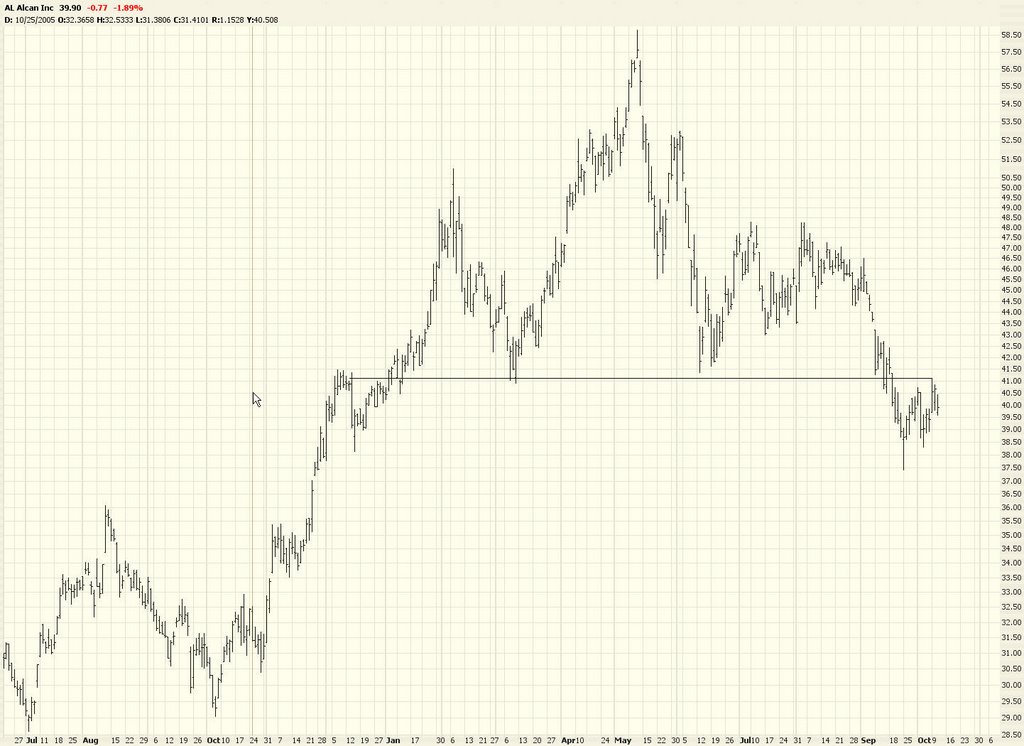
Alcan (AL), a lovely head and shoulders pattern....


Alexandria Real Estate - - many REITs have similar charts (symbol ARE):


Cleveland Cliffs (CLF), a nice Fib setup:


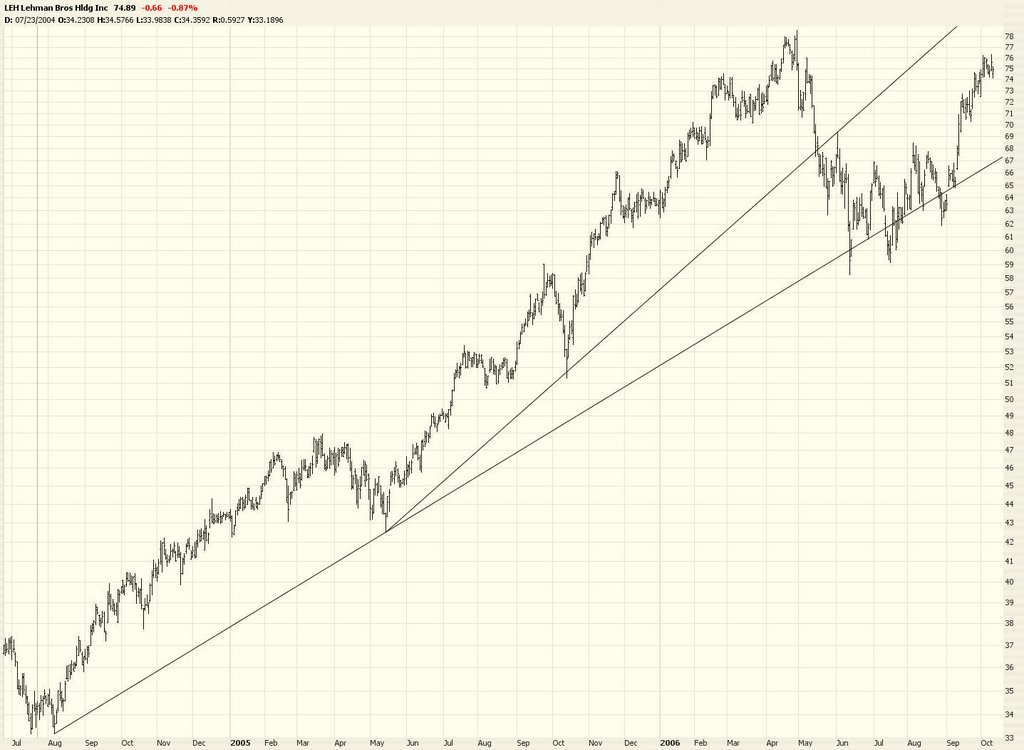
Lehman (LEH):


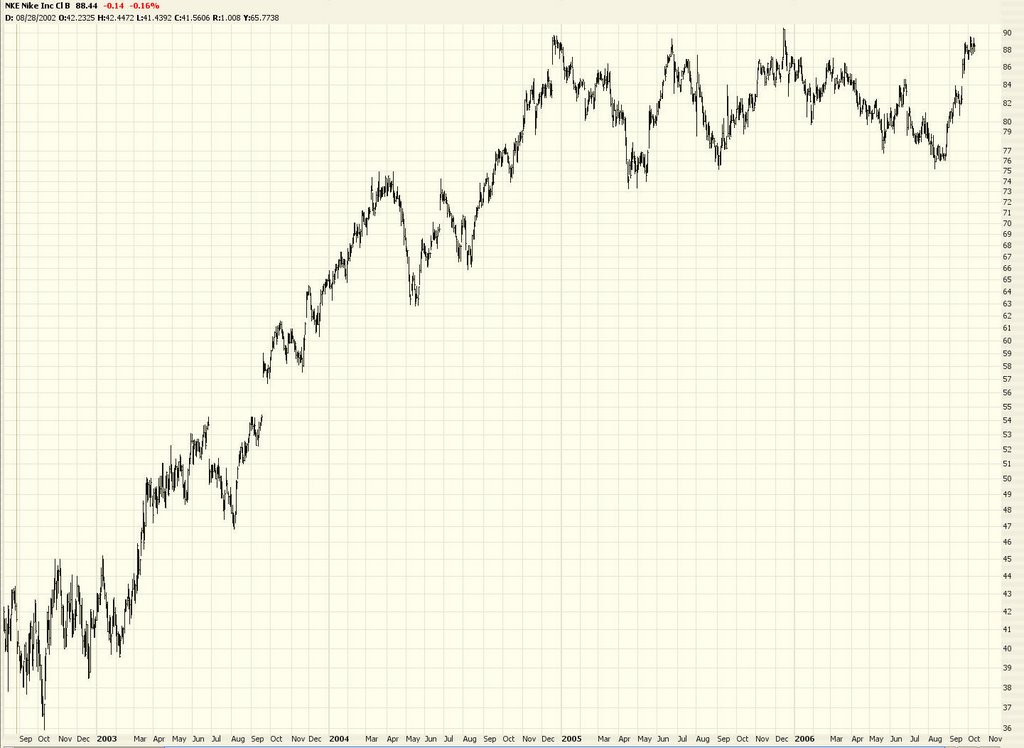
Nike (NKE) way at the top of what looks like a massive distribution:


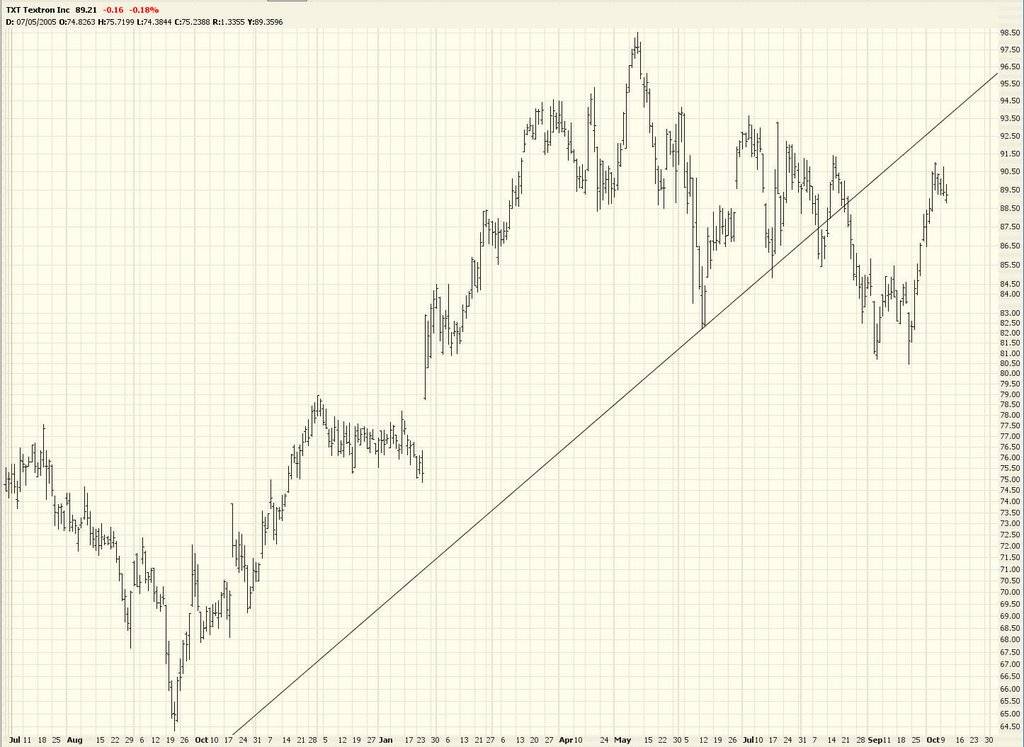
Textron (TXT):

Nothing to say about the markets that I haven't already said. Best of luck to ya.