
Retracing Back to Resistance
Today's action seems to have elicited a lot of "Take THAT, bears!" from both the media and the readers of this blog.
Simply stated, I think today's retracement is to be taken in stride. Look at the graph below, which is a minute-by-minute graph of the $INDU for all of 2006. The upper trendline, briefly conquered, now represents resistance. Today was a retracement back up to that line, and I suspect tomorrow we'll start to see prices sinking again. Click on the graph for a much bigger view.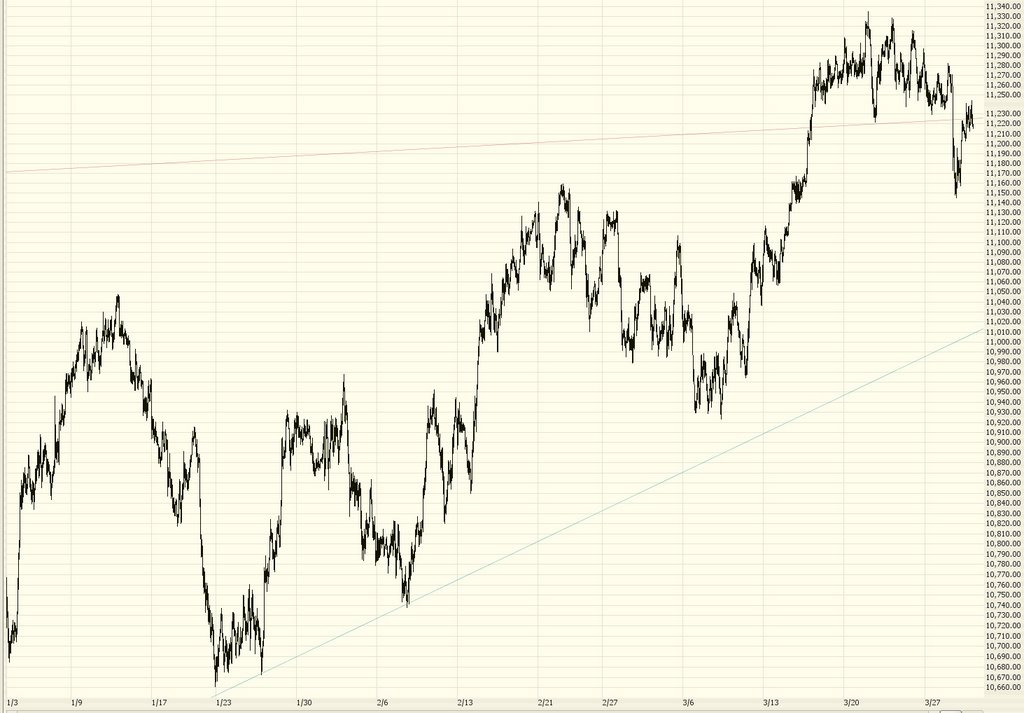
6 comments:
Maybe. Maybe not. The fed said the economy is growing. That means that business is growing. The perception is that the jobs market (especially for accountants and truck drivers) is hotter than a pistol. The NASDAQ didn't just go back to where it was it went up 32 points. Thats 32 over yesterday and 15 over Monday. I'm not a bull nor a bear - I just trade. But right now I can make a better bull case than bear case.
Observation from Todays market action:
Dow Up 66 points, Nasdaq 5 year high on volume that is higher than yesterday and above average. Today was a good accumulation day, which is what has been missing for some time now. The Bull's are not letting go, looks like they are adding to their positions. Unless we do not see several distribution days and the dow below 10900, i am trading bullish.
The old 'Taylor Trading' approach concerning buy day, sell day, sell short day echoes through my nearly empty head. My son put it succinctly, "anybody betting on consecutive down days in this market is crazy."
John, I respect your opinion, but profit growth and margins tend to be mean reverting, and historically about 50% of total return comes from dividends which are profoundly anemic. Price ratios are also trending at historic relative highs not lows. Can the market go higher? You bet. But can it go higher indefinitely without any corrections? I doubt it. My proprietary algorithms show a lot of bigger ETFs are pretty extended. They are extended not only by short-term Bollinger Bands, but by absolute numbers as well. Add in that only 5 of the NDX stocks are oversold by stochastics, and you have to wonder.
Actually, I heard a CNBC Cheerleader describe yesterday's action as 'horrible.' That sums it up. A day when the Dow loses less than 1% and less than 2 standard deviations of price (using volatility bands) has become symbolic of 'carnage'. The VXO rose something like 0.12 during this mass exodus. You have to wonder about the whole COOKED FROG theory in action.
Considering the wishy-washy, "could-be-up, could-be-down" alternatives out there in blog-land (I won't name names), I imagine I'm probably foolhardy to predict what would happen on the NEXT day. But still.....so far, so good.
"anybody betting on consecutive down days in this market is crazy." Interesting that I did a post on just that subject about a week ago. For the past few years, down days have been mean-reverting while up days have been trending.
http://nodoodahs.com/?p=131
Actually I have several posts on that oscillator since that one, see the base of the site http://nodoodahs.com/. I believe I have invented a new indicator (a following, trending indicator, like ADX), because I have not seen anything like it before. Could be wrong.
"what you are seeing here my friends is a nice blow-off top"? I think what you're seeing here is the end of the quarter. Trend is up until the technicals prove us wrong.
Right now the DJI and SPX are at significant support levels, but there are multiple levels below that, including several horizontal support levels and short- and long-term uptrend lines.
For the DJI, I would suggest that 11K is the level to re-assess bullishness. This would be a short-term trendline violation.
http://stockcharts.com/h-sc/ui?c=$indu,uu[e,a]daclyiay[dc][pb20!b50!b200][vc60][ile12,26,9!ls12,26,9!lb14!lc20][J71180780,Y]&listNum=1#
For the SPX you've got levels at 1285, 1275, etc.
http://stockcharts.com/h-sc/ui?c=$spx,uu[e,a]daclyiay[dc][pb20!b50!b200][vc60][ile12,26,9!ls12,26,9!lb14!lc20][j71181449,y]&curChartList=1#
Hmm. Considering the action today, it certainly looks like we're at support. Are prices falling? No? That's support.
Fascinating that you don't want to address the obvious supporting trendlines, some of which go back 2.5 years (S&P 500) and won't be violated unless we fall significantly from here (1220 or so).
Unless you get just stoopid with timeframes of 6+ years, there is no resistance on the SPX chart, other than the 1310 of the last 3 weeks.
I'll ask again, since you don't seem to be hearing it. TA is not about being bullish or bearish, but being with the market, and knowing when you've been proven wrong. I have stated repeatedly that 1295, 1285, 1270, and 1220 are my target support areas for the S&P, and as long as they're all valid, it's bullsville for me.
pb, what's your "uncle" level? At what point (if reached) will the market convince you to trade bullishly? Or are you a permabear?
Post a Comment