
The Ten Year View
I remain confounded at the market's rise, but you can't argue with price action.
I would like for you to look at a view I usually don't show here - the ten year view - of these various markets. I'll say very little about these, relying on you to draw your own conclusions. Remember that clicking any image makes a larger one come up. These graphs were up-to-date as of the market's close March 15, 2006.
Here, first, is the Dow Jones Industrial Average. You can see an array of Fibonacci fans (which are actually coming all the way back from 1932) that help us see where prices are "clinging". The recent year's price action has been unusually strong, but you can still see the minor resistance line I've drawn.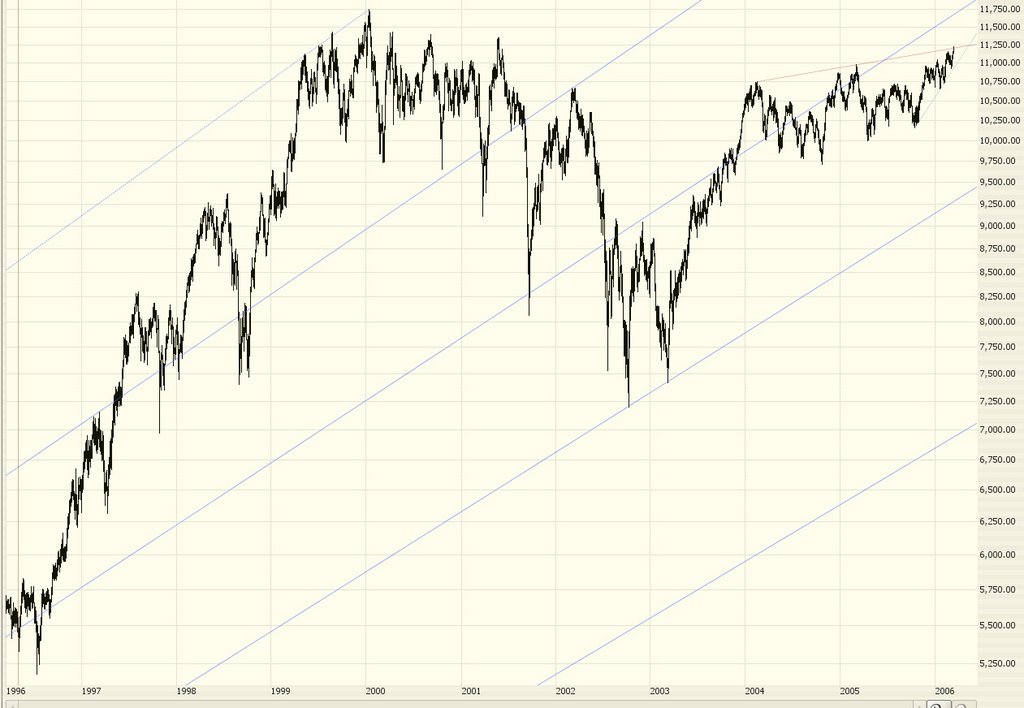
Next is the Russell 2000, which has been especially stong lately. Prices are up against the limits of an ascending wedge.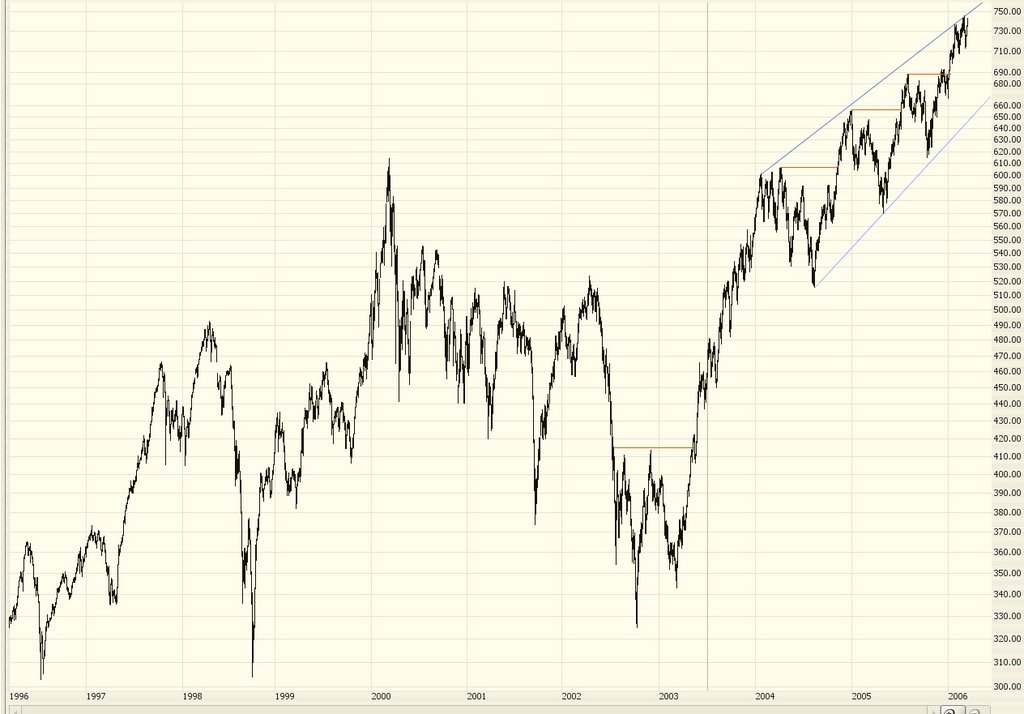
Next is the S&P 500 which, like the Dow, has Fibonacci fans from very long ago shown on it as well as the more minor year-long resistance level.
Now just look at the Dow Transports. Does anyone besides me think these are just a touch pricey? That the graph is basically a hockey stick? Incredible. Notice, however, in spite of its rise, how it is already on the "wrong" side of its ascending trendline.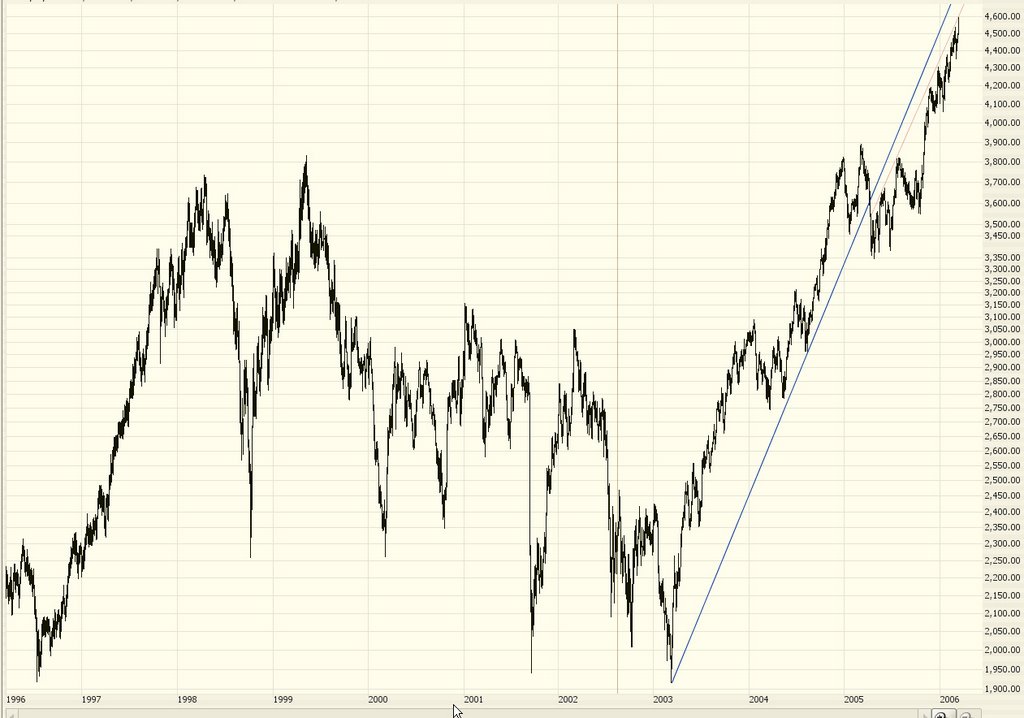
The Dow Utilities, mentioned here about a week ago, seem to be prone to breaking a head & shoulders formation; this index is already on the bearish side of its major ascending trendline.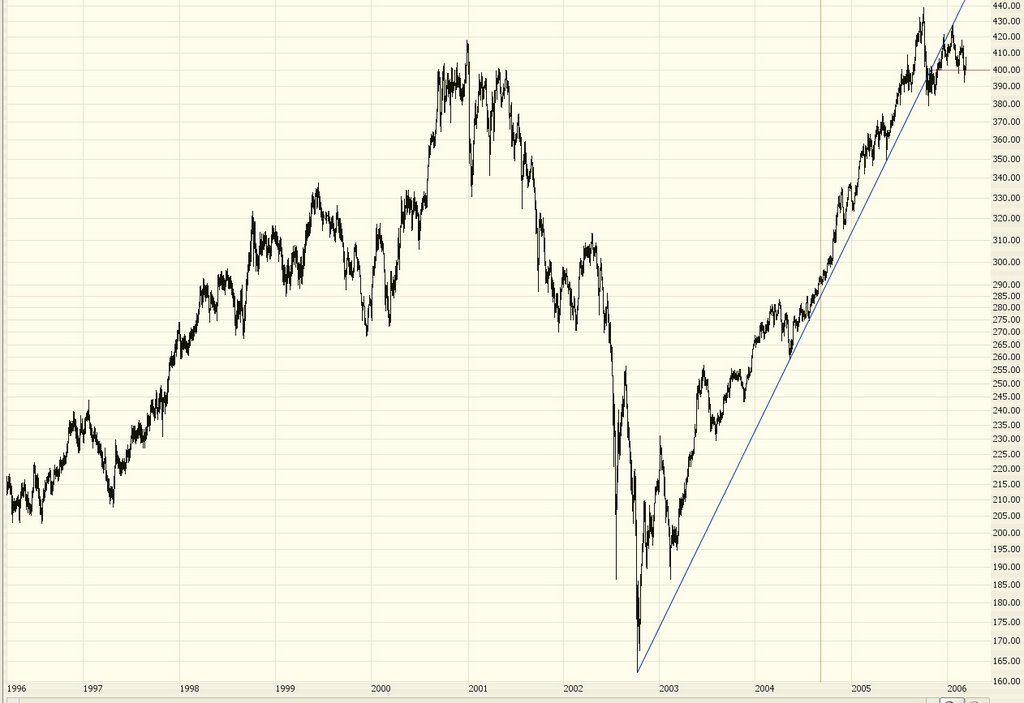
And last but not least is the volatility index, the VIX. The sea change here is that the "fear" levels remained in a consistent range for years and years. But in the past couple of years, the VIX has plunged to never-before-seen lows, indicating a level of confidence (or complacency, if you prefer) never before witnessed.
My dread fear is that we poor bears are going to wind up with the mindset Abbie Hoffman was in when he wrote his suicide note: "It's too late. We can't win. They've gotten too powerful." Nooooooooooo!
6 comments:
Hey Tim, I think the trannies are parabolic and the VIX is just sad. But when I look at the VIX I can't help but think what we are seeing is the demise of the retail investor and overwhelming influence of the ETFs on the market. I wonder if anyone has plotted the volume/volatility of the ETFs against the VIX. I'll have to ask Brett Steenbarger if he has done any work on that.
By the way I'm a user of prophet net and like that site a lot.
Thanks
The market has set new highs this week. This has occured on lower volume. If the volume does not pick up in the direction of the uptrend, its going to be difficult to sustain futher upward movement. Although there are divergences, i would not trade on the bearish side.
Something else to consider:
http://www.cnn.com/2006/POLITICS/03/16/congress.debt.ap/index.html
9 trillion and very little to show for it. If all this debt were being racked up to build out new infrastructure,
improve schools and make us more competetive I'd probably be a little less concerned. But it all seems to go to
pork.
There's that divergence between the SOX & S&P 500's new 52 week high that I was talking about. If tech is more than
4% off it's 52 week high and the S&P is *at* it's 52 week high, this divergence always leads to a correction. Happened last year too.
http://finance.yahoo.com/q/bc?t=1y&s=%5ESOXX&l=on&z=l&q=l&c=&c=%5EGSPC
So we're due to fall at least 10% very soon. May it be the "big one" so my puts pay off.
-Mike
I like the OIH as a short at these levels (as well as similar stocks, like HP and APC).
There is no point in anticipating a reversal. When its there you will 'know' it. It will be a long ride down. i do not mind getting on that train a bit late, do not want to be the first one to catch it.
Post a Comment