
Shorts!
The market's recent activity reminds me of the Talking Heads' song "Empty Motion." Tons of volume, but nothing's really going anywhere.
The oil sector took a hit, which I like, since I've got puts on APC and OIH. But we're still just in a tug-of-war. My colleague Michael Kahn mentioned in his column the stunning volume on the market last Friday. Nearly 500 million shares traded hands, yet the market hardly budged.
Today I wanted to share some specific short ideas with you. I'm already in these positions (they were established before today). As always, I endeavor to provide stop prices for responsible trading! And, as always, remember you can click on any graph to see a much bigger version (and click the Back button of your browser to get back to the posting).
Symbol: ATI
Why? This has been part of the super-hot steel sector. The run-up has been huge, and my feeling is that the trend has reversed here. Possible double top.
Close If Price Crosses Above: 58.45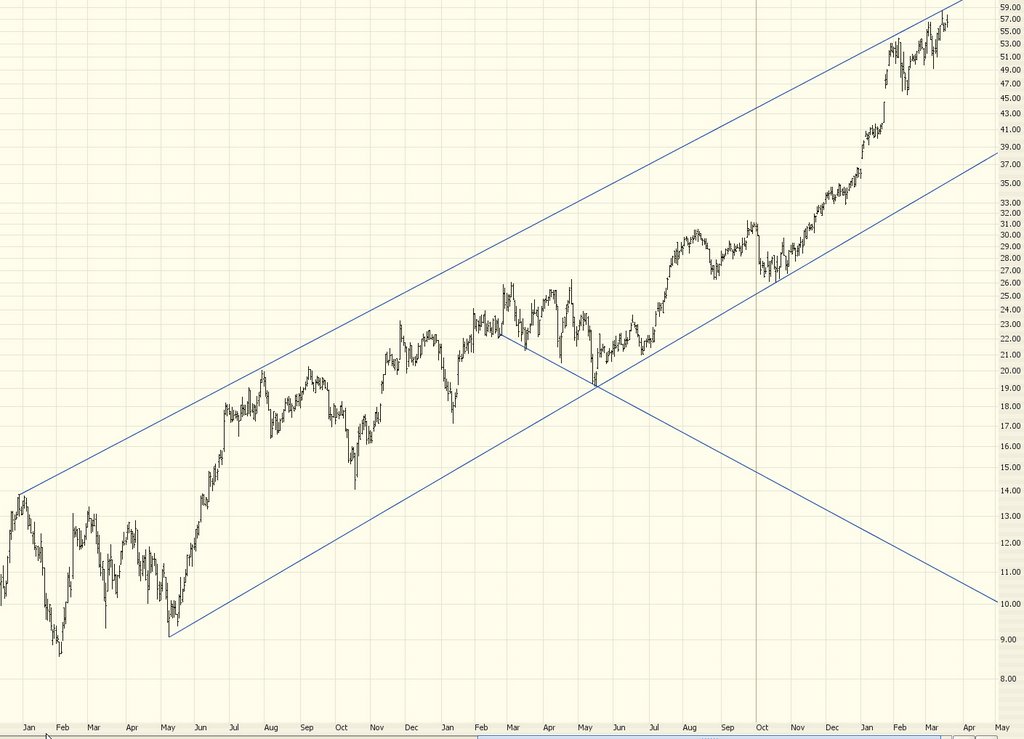
Symbol: APC
Why? Good day today on this one (I bought puts last Friday). APC is one of the high-fliers in the oil sector. I've got a bearish view on crude oil, which flows into this suggestion. A break beneath its ascending trendline would obviously mean fireworks.
Close If Price Crosses Above: 101.03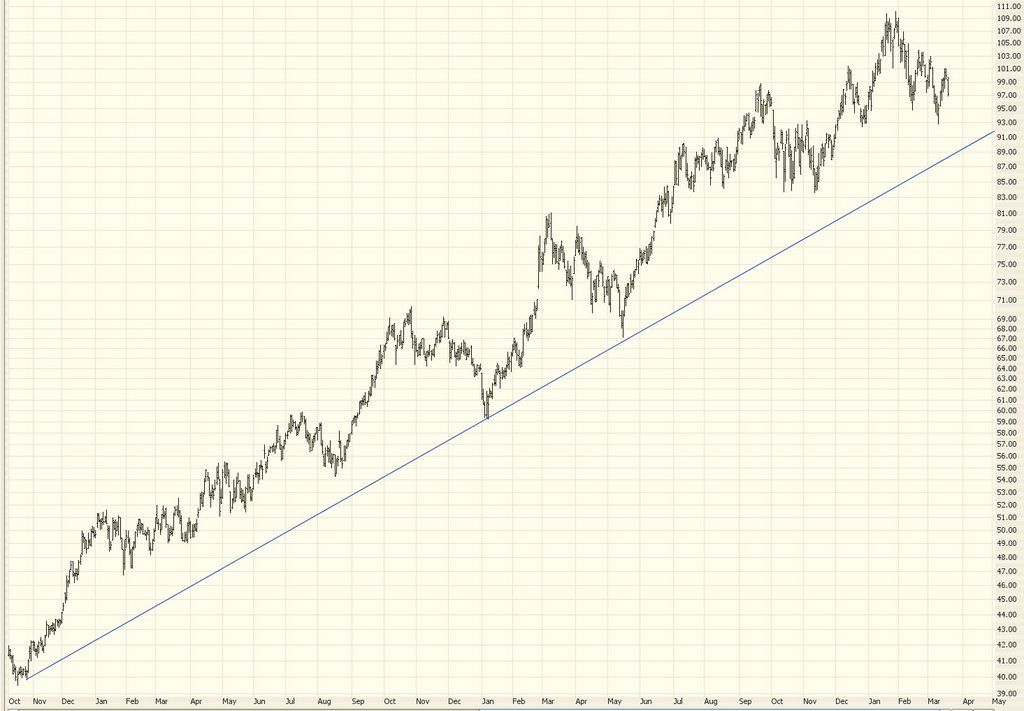
Symbol: BNI
Why? Double-top and part of the richly valued transporation sector.
Close If Price Crosses Above: 81.72
Symbol: RIO
Why? Head & shoulders pattern which has broken its neckline and retraced back to it.
Close If Price Crosses Above: 45.9
Symbol: ESRX
Why? High-risk trade here, folks! This is a white-hot stock but I think it's out of steam. (Of course, I felt this way about HANS which has continued to shoot higher).
Close If Price Crosses Above: 92.95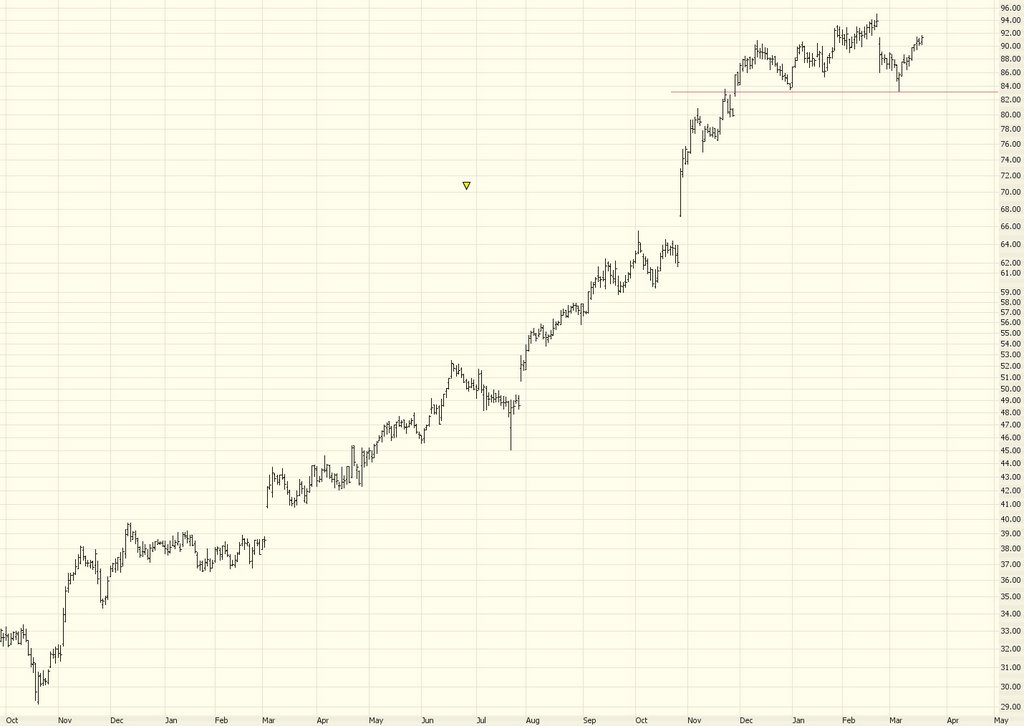
Symbol: FLR
Why? Very nice "lower highs/lower lows" pattern. Suggests a change in trend.
Close If Price Crosses Above: 85.58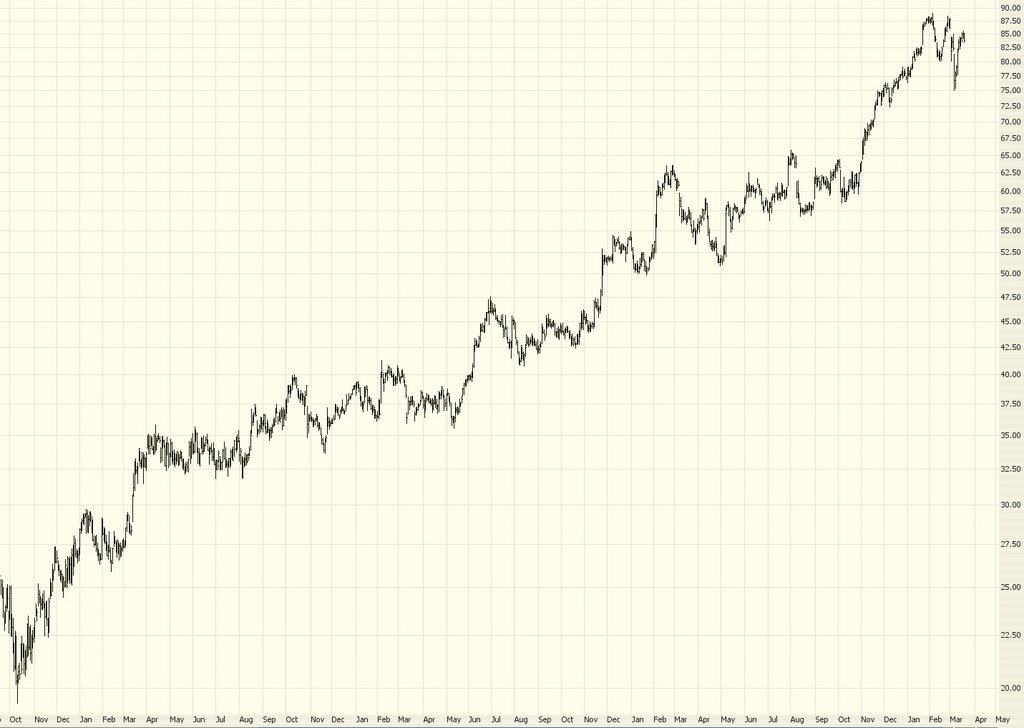
Symbol: HP
Why? High-flying oil service sector stock which seems to be in a clear downtrend now.
Close If Price Crosses Above: 67.87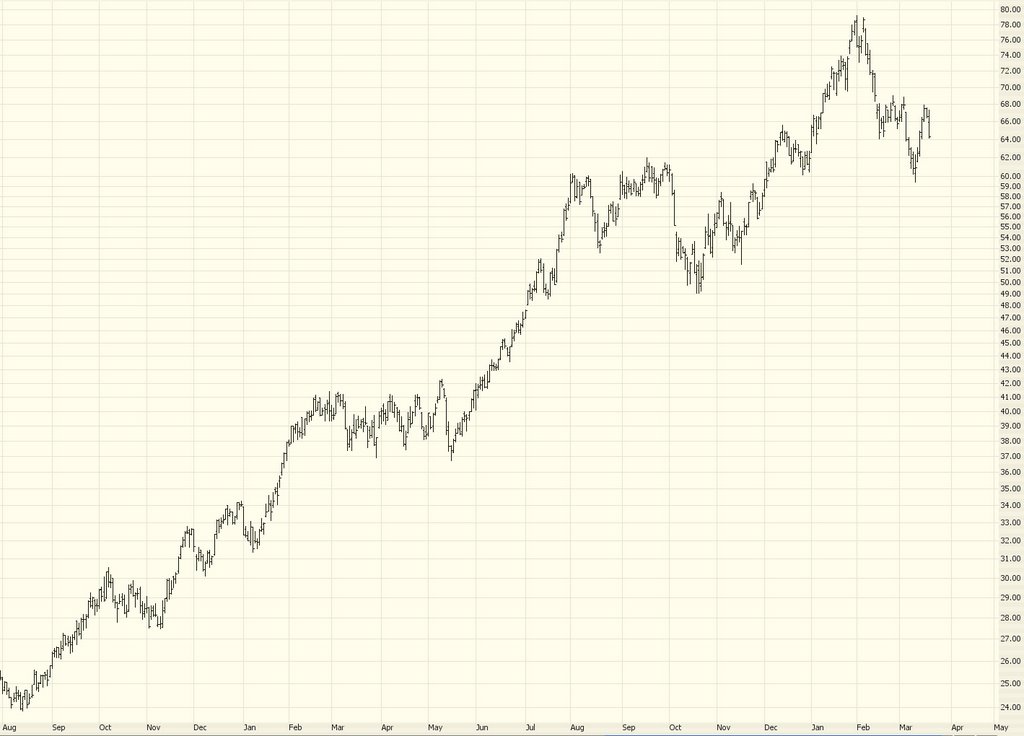
Symbol: IWM
Why? The ETF of the Russell 2000 index, the trendlines I've drawn plainly show this index is pushing hard at its resistance levels.
Close If Price Crosses Above: 74.50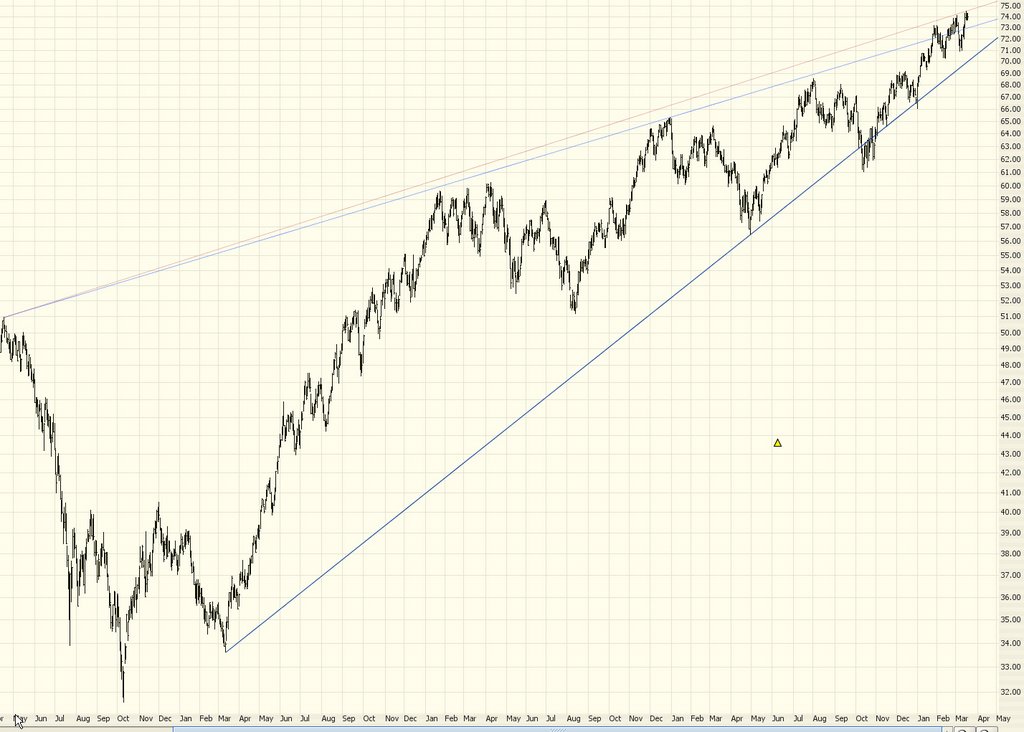
Symbol: QQQQ
Why? A head and shoulders in formation, mentioned a couple of times in this blog recently; a break beneath 40.16 would be fantastic for the bears.
Close If Price Crosses Above: 41.92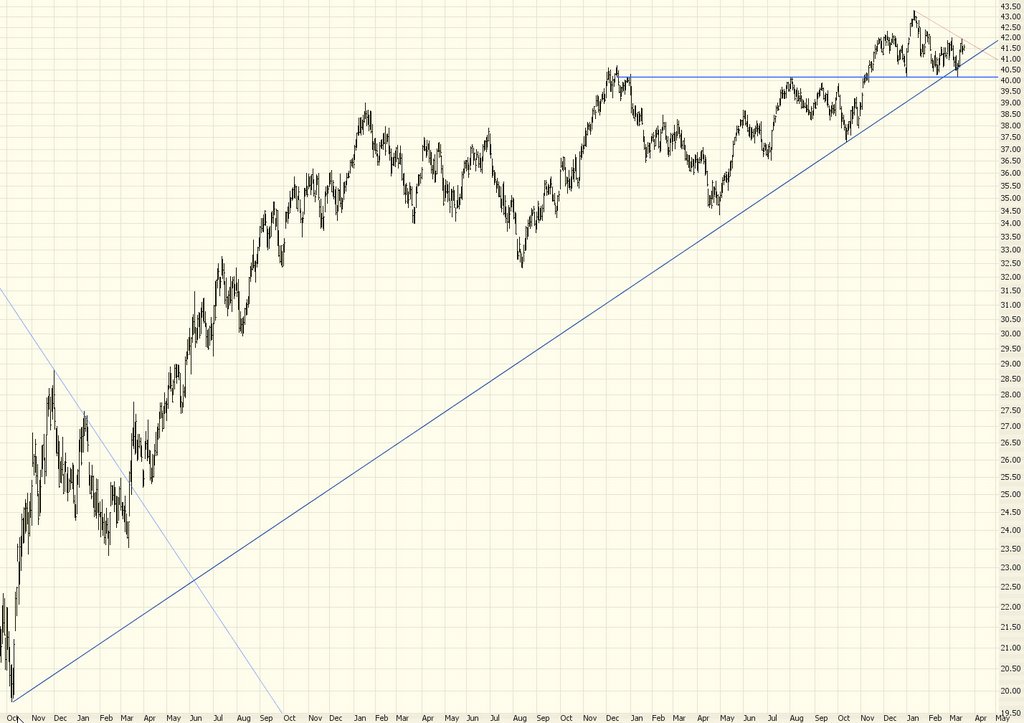
Symbol: PD
Why? This is also a head and shoulders in formation. It has broken beneath its ostensible neckline, only to push back above it again. But at these levels, it's a relatively low risk/high reward trade.
Close If Price Crosses Above: 76.80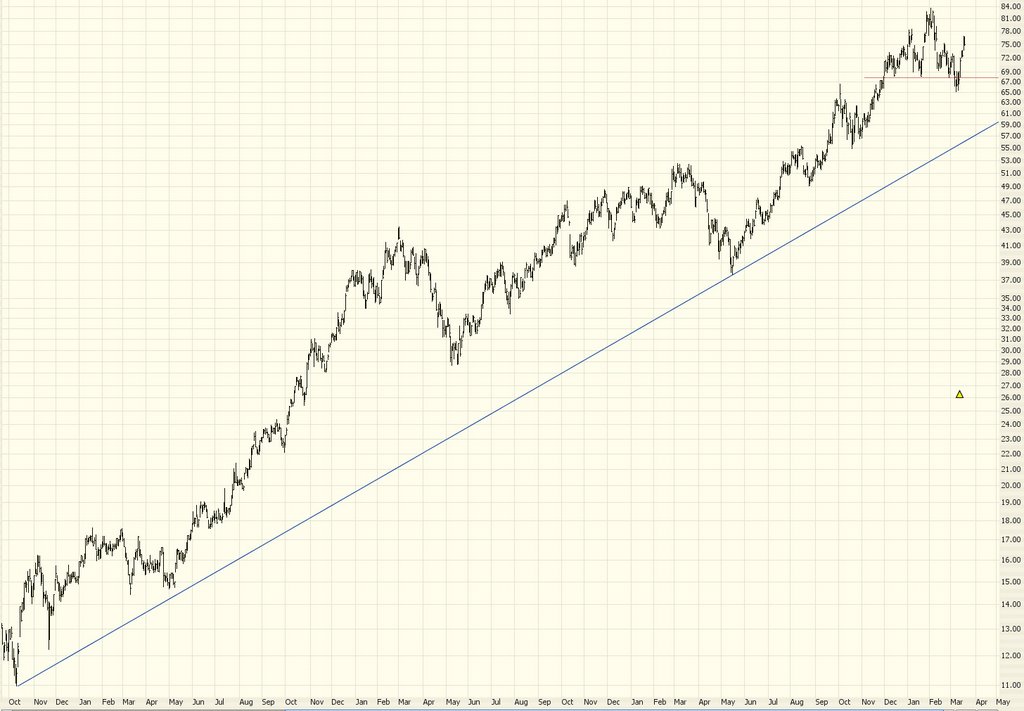
Symbol: UTH
Why? Similar to the NASDAQ 100, this index has formed a very nice head and shoulders formation and is clearing below its former uptrend. I've mentioned this one before. Again, it's got to break the neckline to have meaning. But it's a honey of a pattern.
Close If Price Crosses Above: 116.22
Best of luck, everyone. It's tough out there! Keep your eyes on the prize.
6 comments:
All these charts have great uptrends. Are you anticapting a reversal? On these price charts, no sign of one? Trading on anticipation of a reversal is always risky. The one oil stock that looks like a great short is APA. This one has reversed by breaking its ascending trendline (5 years) and formed a lower top.
The only one of the list that I feel even slightly comfortable with as a short is RIO - my ta shows a potential breakdown. Some of the rest are getting a bit long in the tooth and may roll but others seem to be fresh in their latest thrust.
Well you know what you are doing - just my 2 cents worth.
Yes, I'm anticipating a reversal - actually, most of these have already reversed, in my opinion. I agree trading on anticipation is deadly and costly. These downtrends are, I confess, VERY short and iffy......but I think by and large the plain uptrends have stopped or been broken. I think the symbol Kapil Khanna meant was APC, and I agree.
Tim,
I actually meant APA (Apache Corp). Its formed a lower top on its weekly chart and broken a 5 year trendline on its logarithmic chart. Volume is also great on the downside. Check it out if you have not already.
For those of you keeping score..........out of the ELEVEN short recommendations I posted, how many of them went down the next day?
ELEVEN.
And there you have it.
Tim, I'm a novice at technical analysis and have learned a lot from your posts. One observation I have is that APC seems to be in a head/shoulders pattern and is trending toward it's $93 support (maybe correct term is neckline?). Would it be a reasonable statement to expect it to drop to $93 and either bounce off or break through support on high volume?
Post a Comment