Answers to Your Questions
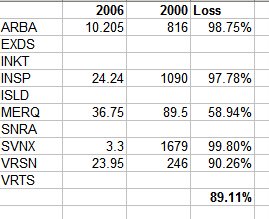
A reader recently sent in a link to some Jim Cramer recommendations back in February 2000. I thought it would be interesting to see how the sweaty, bald fellow's fervent suggestions fared.
It was difficult, because five out of the ten hot picks are no longer with us. I don't want to dig to see what happened to them, but suffice it to say that the 90% loss cited below is probably generous:
I've been getting a lot of questions recently in the Comments section, so I thought I'd answer a few here:
Why would you recommend shorting ADSK on a big volume, big gain day?
First off, the puts I bought on this yesterday are already up 20%. Second, the reason is because I thought this chart was a total gift. As you can see from the chart I posted with the recommendation, the price was coming right up against resistance. That makes for a very low risk, high reward trade. The fact that it was a big up day simply made the puts that much cheaper.
Do you check the news each night on your holdings?
No, not really. I'm a technician. To my way of thinking, all the news is already built into the chart. If something huge happens to a stock, I'm naturally curious (such as with GOOG earlier this week). But by and large the chart is all that matters. I don't care about anything but the ticker symbol.
How many positions to you have at one time?
Usually about 18 or so. Perhaps 10 shorts and 8 puts. Something like that.
What's your basis for your bearish stand?
I could go on at great length, but I really try to cover this (in bits and pieces) on my blog. The simplest answer is this - - look at a REALLY long term stock chart (the Dow, for example, from 1900 to present). In my opinion, the arguments for a bear market completely outweigh the idea that stocks could push on to new highs. The Fibonacci fans, the retracement levels, the trendlines - all of them spell "doom" over the next 10 years.
Why do you express frustration at the market's lack of direction when it's been up for the past three years?
I recognize that many indexes - particularly the small caps - have done very well since late 2002. My point is simply that over the past six years, there really hasn't been meaningful motion. And surely no one can point to a clear trend for the past year or so. The markets simply bobble up and down.
Wow, if this short recommendation is as good as your AAPL, NTRI, and OIH short recommendations then I am in for a treat.
Well, that's very cute. AAPL and NTRI are still, I believe, fantastic shorts. OIH is more iffy, but I try to state stop prices whenever I make a suggested trade. If you don't find the blog helpful, please don't waste your time.

5 comments:
Thanks Tim! Your blog is great 'cause it doesn;t try to hype the bull-sh.t case like so many others do (ie. mainstream media, Jim Cramer in particular) He actually was recommending GM at $50 back in early '04. Anyways, no one is perfect, but that guy would not see a cloud in the sky even during a hurricane. Sorry, Cramer, not trying to bash you too much, but you are one hyper-bull that will be dropped by CNBC as soon as this market shows how bearish it really is!
By the way, you can look at the aforementioned big picture of the Dow at http://tradertim.blogspot.com/2005/07/century-long-pattern.html
Tim- I enjoy your blog. I apprciate the clarity of your technical examples- and I am able to see how experienced technician can look at the chart and in some cases give me a whole new perspective.
I look forward to meeting you in Las Vegas.
Jon Christman
christma@wfu.edu
Looking at the Fibonacci fans, the retracement levels and the trendlines in a REALLY long term stock chart will determine the future course of the stock market and by extension the future course of the economy as well. Trader Tim, you are brilliant. You should win the Nobel economic prize.
Hi; I'm kind of weary of smart-alecky comments from Anonymous readers, so I'm only letting registered users comment from now on; sorry to the rest of you for this inconvenience.
Post a Comment