
Failed Breakout - Hurrah!
Today was a really interesting one. The Dow pushed higher by about 50 points, started weakening, and never looked back. It wasn't a collapse by any stretch - - the Dow closed down 39 points - - but this kind of "pop and drop" day is wonderful, particularly since it's demoralizing to the bulls.
Let's first look at the S&P 500 index. Take note of the blue trendline above the prices (resistance, obviously). See how the prices are progressively unable to touch (let alone cross above) the line. Finally, see how the prices give up and surrender away from this line.
The intraday chart of the Dow is similar, except this index shows more strength. In fact, it pushed itself to a new multi-year high today, only to see it exhaust itself early and start the descent.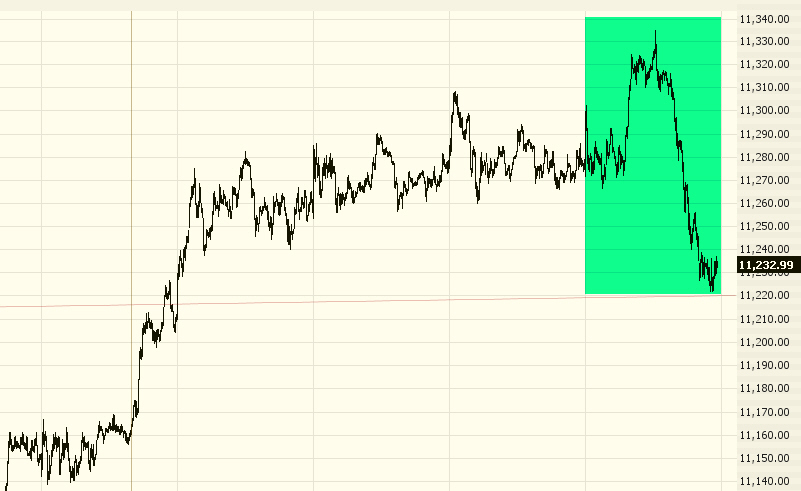
The longer-term view is what really counts. Below is a daily graph of the Dow 30 going back more than a year. As you can see, the prices did in fact move above an important resistance line a few days ago. If this line holds, it could be bullish for the market (hissss). If today's weakness follows through and pushes prices back below this resistance level, it invalidates the breakout altogether.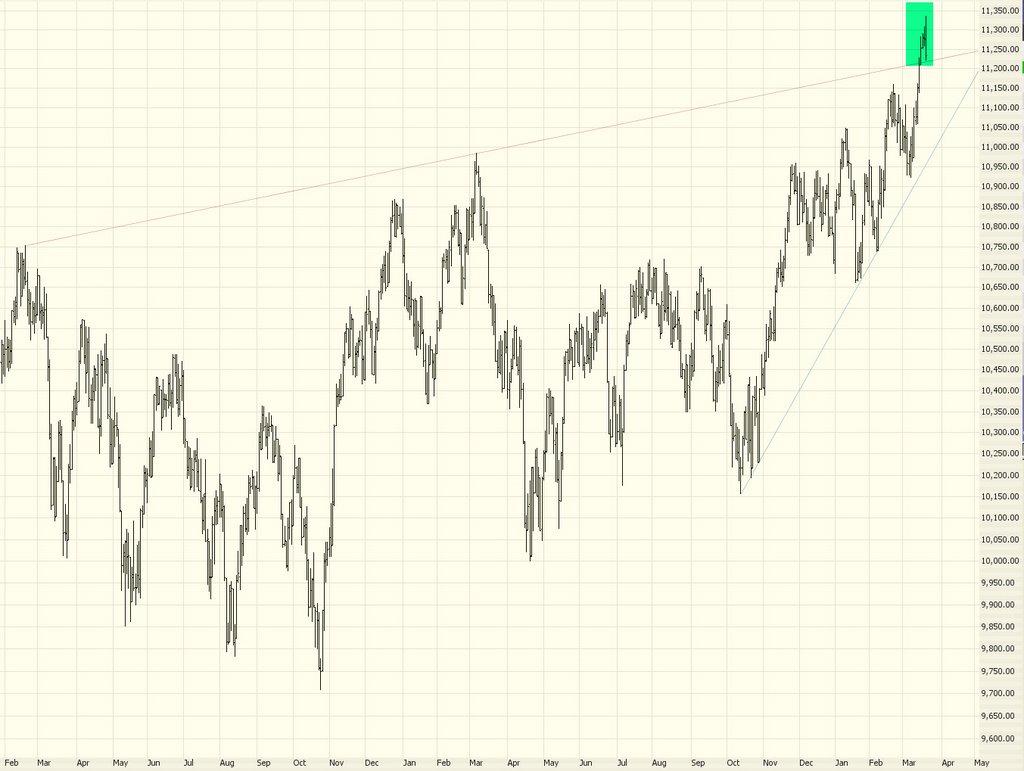
5 comments:
If the dow breaks 10900, i will ride the bear down :).
I'll call it a failed breakout on the S&P when it closes below 1295. See chart.
http://nodoodahs.com/wp-content/uploads/20060317spx3month.GIF
I'll call it a bear when the S&P violates this two-and-a-half year trend line (in green).
http://nodoodahs.com/wp-content/uploads/20060317spx3year.GIF
My pleasure, Des! Happy you made some green!
bsi87, take a look at the dailies for the S&P 500. The index made three rises, one at each side of Feb, and the recent March one. Daily MACD is higher on each subsequent peak, as each peak is higher in price than the last. The daily RSI confirms, again each price peak corresponds with a higher point in the RSI.
Check out http://stockcharts.com/def/servlet/SC.web?c=$INDU and http://finance.yahoo.com/q/cp?s=%5EDJI. 24 advancers to 6 decliners in the Dow, with 7 up more than 1% vs. 2 down more than 1%. That's a pretty broad advance, just about every market was 2 to 1 advancers.
I disagree about the importance of new individual highs being a sign of a healthy advance for an index high. Actually, a strong number of individual highs means that the advance is weak, and is carried by a small number of stocks. When the index is zooming to new highs, and the number of individual highs is small, that must mean that very few of the members are showing extraordinary weakness, and that the index is advancing broadly.
I have outlined in my previous charts and on my blog the points at which I will re-evaluate my bullish stance; have you drawn the line in the sand, that if the market crosses it, you will re-evaluate your bearish stance?
If (and I do mean IF) the various support levels are violated, I'll be jettisoning my weakest investments and actively trolling for stocks to short.
Until that time, I'm all in and all long, except for the occasional short that falls in my lap.
Tim was kind enough to state the levels at which he'd re-evaluate, and I have done so as well. bsi, what level (if any) would the index have to hit to convert you (even temporarily) to bullishness?
Post a Comment