
What a Drag..........
Dear Readers,
I gotta level with ya, it is not fun to write this blog in this kind of environment. Another nearly triple-point rise today. Ugh. I notice the comments section has gone stark, raving mad - nearly 200 comments. If the market had been slammed today, I'd love to go check out the comments. As it is now, I'd rather not see what people are saying!
Well, as has been pointed out by readers before, there is no right or wrong in the market. There is simply the market. It seems hard to believe that less than a month ago (July 18th) we were flirting with breaking Dow 10,660 and heading into a major descent. Seems like a million years ago, doesn't it? Sad. My only hope is that my emotions tend to inversely correlate to the bearish prospects of the market. I'm feeling like crap, so maybe we're at a turning point, eh? Or maybe not.
The $INDU has risen to the point where it's become very demoralizing for the bears. There's really no "line in the sand" left to speak of. If the high set today is crossed anytime soon, the only goal left to conquer is the high set back in May (and, if that is crossed, the all-time high set in January 2000). The Dow "should have" (definitely in quotes....) resumed its fall where the green arrow is pointed (remember, click any image to see a much bigger image). But the bulls grabbed this ball and ran with it.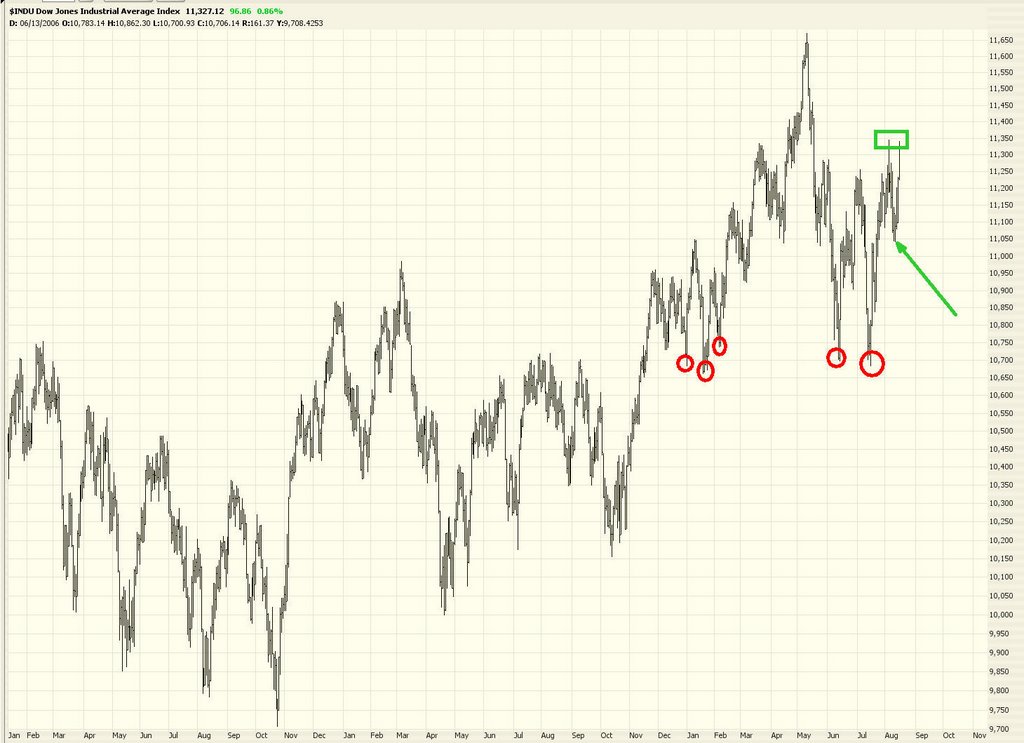
The NASDAQ 100, like many other indexes, is just underneath its former support line. There is a chance (hope springs eternal!) that this could be a turning point, since the former support is now resistance.
The S&P 100 is in a similar position.
Here is a heavily marked-up S&P 500 chart. We're still in the lower half of the channel that extends back for quite some time. I'm not exactly sure what to make of this graph, except that it sure was more fun to be a bear from June 1 to July 15 than it is now.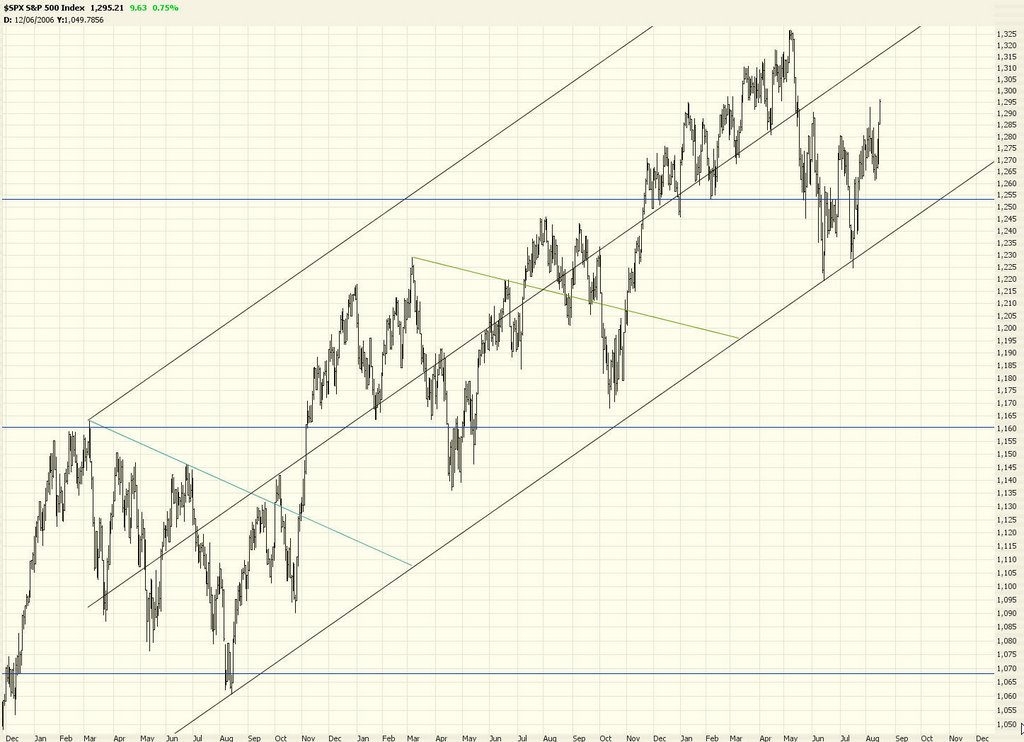
The Dow Utilities are looking pretty toppy right now.
The Amex Major Market ($XMI) looks like it's making another serious attempt at a breakout. The last time it did this, marked in yellow, it failed. We shall see if it fails again or pushes off to blast away from this consolidation zone.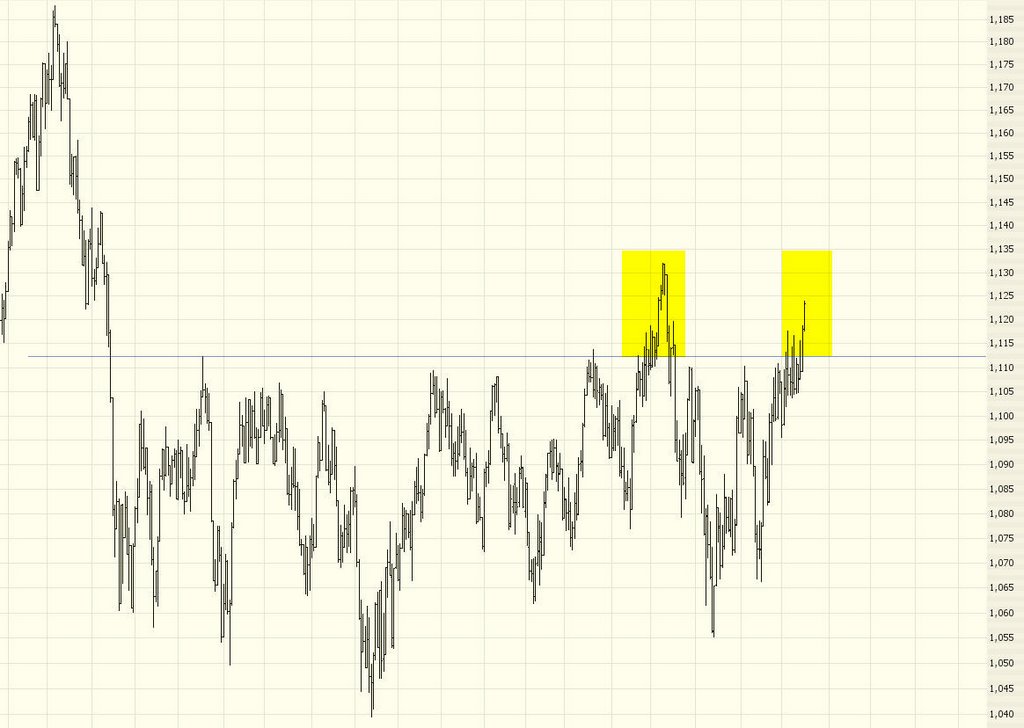
The energy shorts I've got were just about the only bright spot in my portfolio today. There is some weakness here, and this is about the only graph I can point to as looking really primed for a fall.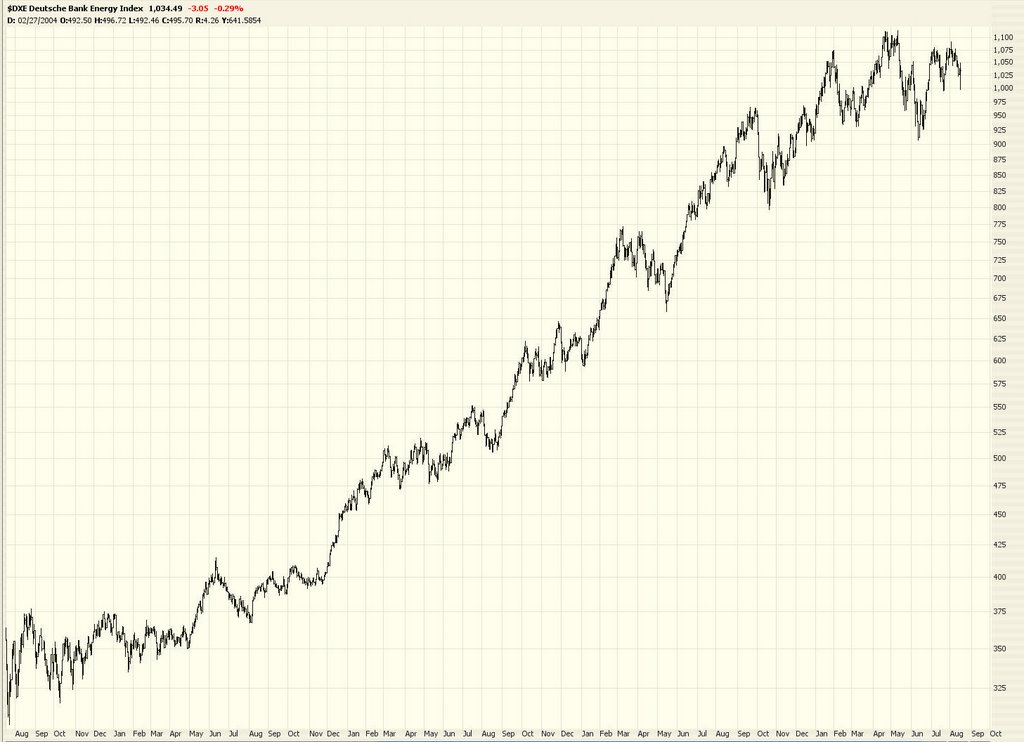
What a bummer of a day. Yuck!
125 comments:
Tim,
I love the work you have done on your blog since the spring...so many different ideas. It's appreciated.
I sensed last week by looking at the Stoch and realizing that this selloff wasn't that intense that it was time for me to cash out of my puts.... Luckily I got out.
And judging from the board it is almost time to reenter but I am going to be patient. Has anything really changed? No. This market got forced up... artificially. That is why so many shorts got squeezed this week.
Earnings are going to be weak in October and growth will slow....patience.
Cheers
tim, been readin this blog for about two mos now, love it , you do great work, but the comment section has gotten ridiculous. its like a aim page for a bunch of "yes men". used to be intellegent posts with forethought and opinions with base, now like a penny stock site with a shitload of baseless opinions. i never agreed with hurricane5 but at least he did'nt just spout off.
love your "tech" take on things , but the comments have gotten sad.
Charts are fine for analyzing what HAS happened. They can't look into the future, they can't predict inflation, CPI, etc., things that set the market off. Look at the market day by day.
For the remaining of the week, I think a little upside is still left specially in nasdaq100. But next week is bear's week..
Ray
I know this has been a horrible week for you, Tim, so I just want you to know that I (like many) really enjoy your blog, including -- and maybe especially the fact -- that you always tell us what you really think.
I was introduced to the idea of cycles a while back. I think there's something to them (I think of them as "reversion to the mean") which is why I'm in the bearish camp: we're "scheduled" for a correction in '06. But unlike planetary cycles, market cycles are not exact and can be shorter or longer in duration than the "should" be.
My guess? You'll be vindicated -- just not yet.
Meanwhile, I love your blog, including its energy and verve. Thank you for creating it, hosting it, and (espcially!) for letting us know your thoughts, complete with charts!
~ Nona
pb: This is what I posted on the last blog:
I agree regarding inflation. Bernanke talked up a storm back in March-May trying to convince everyone that he was hawkish on inflation. In reality, it was all just a head game to crush the speculative hedge funds in the commodities markets.
We all know now that the Fed is not only dovish on inflation, but is completely controlled by the big money players in the markets. And with Paulson at the helm of the treasury, say goodbye to the US dollar.
Liquidity is the name of the game here. Dollar value and inflation are just pawns in the game. Once the markets start running south, they turn on the faucets to float the market higher. Maintain confidence in fiat currencies at all costs, regardless of inflation risks, by refusing to flinch in the global economic scene.
M3? What M3??
-Tony
2:01 PM
I've been researching cycle theory lately (Seasonal and Presidential Election) for the last few weeks, and a lot of it makes sense to me. I am still holding on to my short positions, since I believe that the best is yet to come. From what I have learned, the bear paw will probably swoop down in the October/November period. THAT is when the markets will take a big ride down.
I don't want to advertise other sites here, but since this is a blog and not a for-profit website, I figure it's ok.
www.stocktiming.com has a pretty reasonable subscription price. The subscriber updates are "different" than the standard junk you read on the web. New technical indicators and just plain good information on liquidity flows, program trading, institutional activity, etc.
Anyways, I just thought I would share. I've been a subscriber for only one month so far and it's likely that I'll continue my subscription. Very good stuff. And like I said, it's different than the standard junk you typically read on the web.
Boy, I used to love Don Coxe's weekly webcast. That guy had the inside scoop on just about everything. Unfortunately, he has discontinued his public webcast and limited it only to BMO clients. If I had enough extra cash, I'd probably float some over to BMO and get signed up as a client. It would be worth it.
-Tony
Maybe this will cheer our fellow bears till bear market.
http://www.marketwatch.com/News/Story/Story.aspx?column=John+Dvorak's+Second+Opinion&siteid=
Here is what I think happens tomorrow, we get an early morning rise followed by a minor selloff, I would be adding to QID at NASDAQ 2165-2170.
HPQ will lift the techs but how much, if i was in NVDA, SMH, AMD, INTC or BRCM as of last Friday or early Monday I would be certainly selling for a profit. Amazing how quick everyone forgets about the JULY lows when the markets are in rally mode. I dont think were jumping out of a trading range just yet, I think the dow tops off at max 11450-11525 and starts its next fall. NASDAQ TOPS 2200.
Trader 2006
Mr. Market's job is to take as much money as possible from everyone, longs and shorts alike. Right now he is taking it from the shorts. As soon as the shorts get squeezed out and the longs grow more confident, look out,
Right now I'm thinking we are likely to see a double top in the $INDU before we crash. The next one will make May look like a picnic for the bulls. Sooner or later fundamentals matter.
I can't count the number of times I heard talking heads mention evidence of a soft landing. I have seen lots of evidence of a slow down, even evidence that the economy is slowing faster than most economists anticipated, but I have seen zero evidence of a soft landing (which I think, in any event, would only be able to be seen in a rear view mirrow).
Make money both way, Long and Short.
Tim, I use MarketMatrix throughout trading hours, to scan for strength and weakness. I wondered if the sector column...it will be great help if it show the intraday percent gainer or looser, much like the one on Yahoo industry center Yahoo Industry Center
I try to find weakness in stocks of intraday sector gainers.
I don't how difficult it is to implement it....just my idea.
my picks
many coming out saying dow 12k, dow 11700, dow up another 400 points by the end of august....come on guys. A while ago there was a 2-3 day rally and everyone was bullish a few days later everything came down and the bears were owning the market. I feel the same thing this time, we may go higher but not much higher. Before you know profit taking will be back and those huge triple digit drops will be back again.
Trader 2006
PPT (plunge protection team) of course, why do you think they stopped reporting M3?
Anyone notice QCOM's meteoric rise over the last couple of days and the simultaneous favourable remarks by Merrill Lynch? A few days back, QCOM was falling to $33 because Sprint adopted WiMax instead of QCOM's CDMA technology. Now, its options expiry, and surprise, surprise, max pain for QCOM is $37.50. How convenient that QCOM moves up 4 bucks in 2 days, without any news. Well done, Merrill Lynch, we all know there will be no accountability, no SEC probe, when QCOM just as mysteriously dips back to 33 next week.
The NYA program trades have been floating a ton of liquidity back into the markets. You can see it between 1:45 and 2:15 PM on the past couple of days.
Adding fuel to the fire is the fact that margin players are getting squeezed out in the process. All sorts of resistances have been just absolutely demolished in the last 3 days. The resistances have been absolutely NO RESISTANCE whatsoever. And nobody considers that as "odd"??? Say it with me, folks: M-A-N-I-P-U-L-A-T-I-O-N.
Whenever things need to get shaken up, they just turn on the faucets. This is pure maniplulation, it's not "stupid bullish retail investors".
Unfortunately, there's no way to know whether "They" want to float the markets up, or crash them down. I guess it depends on whose money they want to take, the bulls or the bears.
Back in May, it was the bulls. This time around, it's the bears. My guess is that it will be the bulls' turn to get their money taken away pretty soon. The only question is, when?
After a 4.4% gainer in the Naz, I'm suspecting that it will be sooner than later, so if we do get another 20-point day or more on the Naz, I'm doubling up on my QID.
-Tony
Watcher,
Thanks for sharing the info on QCOM. Where do we get the max pain numbers for a stock? Looks like this is probably a good way to stick it to "them"
- Jay Mac
Hey guys, dont want to pump my blog (which is just my thoughts among many) but i found a great picture of a look into the future of a BULL trader in the next 4 weeks.
Just joking, it can be a bear also, but its a funny pic.
www.thetenreport.blogspot.com
Hey, anyone out there notice that Ford (F) has risen over 30% in the last 3 weeks???
HAHAHAHA!!
The stock has been overbought for more than 2 weeks now, gapping up 4 or 5 times in the process.
That's hilarious.
-Tony
Tony
That is the joke of the day for me. What the f*** are people who are buying this sh** thinking? Looks like a good short for me.
As you mentioned the stock is way over-bought, but it above both the 50 and 200 Day MA
- Jay Mac
I guess "technically," the gaps have all been covered. But not very well. I would definitely NOT rule out the possibility of a 62% Fib retracement here, which puts it around $6.89.
As I said, it hasn't shown weakness yet, but it's running up against HUGE resistance in the low $8 area. If it gets pushed back from here, I wouldn't mind piling on the shorts for a quick 10% gain or better back to the low $7s.
-Tony
Great comments by everyone.
TONY agree with your comments.
As for the overall market i think it is manipulation, complete manipulation. Its program buying, thats all. They can pump this market anytime they feel like it. BRCM up over 35% on what basis. NVDA had some options game going on stock falls over 2 bucks to 22 now over 27, QCOM hahaha sadddd.
So many are wanting in on this market. I for one am looking at 2 possible position tomorrow:
USO at 65.50
QID 65-65.50. I dont see another 25+ gain on the nasdaq.
by the way Ford is looking very good to short.
Trader 2006
forgot to sign my last post at 8:48pm
new shorts for tomorrow TOL.
Stock has bo reason for the last rise.
trader 2006
Jay Mac
Here's a site with a max pain calculator:
http://www.iqauto.com/cgi-bin/pain.pl
btw, right now, max pain for QCOM is 35 not 37.5.
Ford has a date with it's 200 day at $7.46 --- pile on the shorts! It might trade down in sympathy with the GM downgrade!
Investor 2006 (used to be trader '06) but this market is messing with me!
Thanks eddie, TNT looks great.
Money flow is very weak, volume is low, stochastics are way overbought, and it's way above its 50- and 200-day MAs.
Looks like a low-risk short here, too. Maybe 6 or 7 points on the upside, and I can't even count how many points on the downside... maybe 35-40??
I had looked into TNT earlier in the year, but forgot about it since its big decline.
Thanks.
-Tony
Ok, I don't get this. Please can someone explain it to me??
QQQQ is up 0.08% on the day so far.
QID (double inverse of QQQQ) is down 0.37%.
Why is it more than 4 times the inverse???
-Tony
I think I may have answered my question. It appears that there's a 0.2% fee that's tacked onto the ETF.
Nice.
tony i usually judge QID movement by the NDX 100
trader 2006
Market is looking for direction this morning, may be a while before we find one. Nasdaq off 1 dow up 5. BOring if you ask me. Not worried to go long any sector ETF when I have SDS and QID as back up. But im waiting patiently for QID to head back to $72+. The patience will SURELY pay off.
Trader 2006
I think it will be time to enter into USO soon, im waiting patiently for something under 65
Oil falls sharply on healthy fuel stocks
http://news.yahoo.com/s/nm/20060817/bs_nm/markets_oil_dc
anyone think 1297 will be taken out on the spx, yesterday some guy on cnbc said that is a key level.
They upgraded AMD today, that stock has had a nice steady rally these last 3-4 weeks. Up over 38% since its mid july sell-off. If i was invested in some of these companies with 25-45% gain i would be selling. There is no way these stocks gain another 25-35% in the next 4 weeks.
trader 2006.
Markets flat, HPQ and AMD are keeping this market higher. IF HPQ had reported a dismal qu it would be a nice day for the bears. DELL reports tonight, not looking for anything great. That stock used to be a big market mover but not that much today. Patiently waiting to add more to my QID postion.
Trader 2006
Man, it certainly looks like this rally's out of steam. But for some reason, it doesn't seem to want to break down.
I don't get it. Someone keeps pumping money into this market. Obviously, the day is FAR from over, but it's not looking very weak from where I sit. The markets tried several times to get into the red, only to pop right back up again.
The Naz is now sitting at a 5% gain in only 3.25 trading days.
Unreal.
-Tony
More on the options expiration and max pain theory. Look at SIRF - a few days ago it was dropping below 19. Now its risen to around 24.7. No news. And would you believe it, max pain for SIRF is 25!
I think shorting QCOM and SIRF around this level tomorrow will make at least $4 each next week.
"IBD is saying that we are in a potential rally."
of course after the fact.
No one could have predicted this. Market is being pumped up by the hedge funds. They own the market. Im sure most of them on days like this are sitting on tens of millions worth of gains.
Trader 2006
agree at as I see the markets touching intraday highs. Just as we sold off 3-4-5 days in a row, we are pushing higher the same way. SPX 1300 is 1 point away, some bull on here said once 1300 is crossed its going to 1340.
trader 2006
Folks, I bring you good news. Be patient till Monday. Let the options manipulations get out of the way. You will see your market drop, you will profit from your shorts.
Right now you are seeing an enormous pressure by some of the big boys, those who wrote the puts and calls. They have to make sure that most options expire tomorrow. Or else they go out of business. Its a matter of their survival.
This rally is completely artificial. You can plainly see most of the run up is in the stocks with the most options, and to the point of 'max pain'. Friday AH or Monday AM you will see big blocks of these stocks dumped by these guys.
So stay tight, don't fret, and be ready for the downswing. This week's gains will be wiped out next week.
Jason agree about the options statement. Someone on wallstreet has to make money and get their fat bonuses on wallstreet.
Trader 2006
16 Minutes till the Philly Fed report, lets see wht comes out
I have been telling folks about this rally on Tuesday. The precursor was there on Monday. The fact that alot of you refuse to believe it and use the fundamental basis as a way to hold your short position is pure ignorance. The market will do it's thing.
The person that needed help 2 days ago with his deep losses are now even in deeper hole, assuming he didn't get stop out and listen to some of you here to hold.
Trader II
The market is breaking out and ready to challenge the old highs soon. Either you join the bull party or sit on the sideline.
Is anyone else out there getting stopped out of trades on a regular basis? Mostly short, but I've had a few longs go against me as well.
Also, is anyone trading in a TAXABLE account? Just wondering what you do about all the trading documentation when tax season comes around.
Thanks.
Jerry
Trader II
"precursor was there on Monday"
explain, market was showing nothing of the sort, this rally is based off of the CPI and PPI data THATSSSSS IT. Nothing else. WAtch the selloff carefully. Everyone will be wishing they sold up here...
Trader 2006
oil had something to contribute to this rally but I feel oil will make its way back to $75.
Trader 2006
cnbc is hyping it up left and right. Kudlow is happy as anybody, saying this is the greatest story never told or something like that.
HPQ giving up, nearing intraday lows
Trader 2006
Trader 2006,
On Monday we have a 100 point move on the dow only to fade in the afternoon. Clearly the market is showing strength in wake of those 2 big numbers (PPI, CPI). When the numbers confirmed the follwing 2 days, the market finally reviewed it's hand. The Dow is up over 300 points the last 3 days and most of the shorts here continue to fight this trend.
Look at the daily dow chart over the last 6 months and you'll see a symmetrical move with double bottom at 10700. If this move plays out the way it does, 11,700 should be fast and furious.
Trader II
Jerry,
I do all my trading in my IRA accounts precisely to avoid tax reporting headaches.
Over half of the value of my regular account is in cash because I, too, anticipate the possibility of a serious decline. That said, I made two purchases yesterday (MO and SYT) and one today (DOW) in my regular, taxable account; all are positions that I expect to hold for a long time. Yesterday's purchases were additions to long-held positions; today's was the first purchase for a position that I expect to build over time.
I don't know that I'm doing the right thing vis-a-vis the taxable and non-taxable accounts, but this is the way I'm dealing with the issue. I, too, would love to hear what others have to say.
After seeing the rally fade on monday I think was selling ahead of the PPI data, thats all.
As for 11700 the charts may show it but I do NOT SEE A CATALYST for this market. I just dont. Even if 11700 is taken out and 12000 is reached congrats to all bulls but im holding onto my QID and SDS. Last time I bought QLD the markets were in drop mode and everyone thought i was crazy well now I own QID and will not sell until I see plenty of green in my portfolio. I think a drop in the nasdaq back 2050 is certainly possible. Im not betting my entire portfolio on a drop just about 40% of it. Time will tell.
Trader 2006
Trader 2006,
Very seldom do the market show a catalyst and let you get in for the ride. By the time the catalyst unravels it will be too late. It's best to step aside for now. Alot of charts are starting to break their downtrend and it's only gearing up for the next leg up. I've been pounding on the STOPS for 4 days. USE IT!
Trader II
I dont like that the fact the trannys arent participating, still denotes IMO that the problems that were at the surface awhile back are still there and just being ignored, and that can come back and bite this rally attempt in the near future.
Basically the trannys should be acting better than this.
I think the thing that bothers me most is the fact that as soon as the indices show ANY signs of weakness, the money just gets pumped right back into them.
For example, early this morning, the indices were quite weak, drifting into the red for a while. Also, right around noon, the Dow drifted back to a gain of only 17, but within 10 minutes, it drove back up to 37, the highest point of the day.
Somebody or some organization is floating this market. This is not "normal" price action. There is absolutely no profit taking, no weakness in ANY of the indices. And all of this because the core CPI was 0.2% instead of 0.3% (even though the CPI itself was 0.4%, as expected)???
There's absolutely NO way that those PPI and CPI readings should have had this effect on the markets without serious manipulation and money being floated into the market. Hedge funds? M3 money? Who knows.
I just don't see why those simple readings (which are frequently inaccurate anyways) could cause a rally like this. Earnings and guidance CERTAINLY have NOT been the cause.
IYT was down around 75, was going to buy last week but said nah this market is headed lower. Now close to 80 Go figure, I never have any luck in this market.
Hedge funds is why this market is floating higher, im watching the the dow and agree that everytime it has weakened by 5-15 points it moves to a new high for the day, im not trading that. Unless the market weakens by afternoon than maybe but this market is being manipulated. Incredible.
Trader 2006
1300 on the SPX is .45 away, lets see how they cheer on 1300. lets see if we have a run to 1340 like one of the posters said.
Trader 2006
It's global liquidity gone wild. Have a look at the Hang Seng Index. It printed new 52 week, 5 year highs this week and money continues to pour in. We'll see that here soon. It's now a global game.
Trader II
Hedgefund???? You think with the volume explosion to the upside the last few days it's because of hedgefunds? This is institutional buying. Pure & Simple.
A quote from Tim last night.
"If the high set today is crossed anytime soon, the only goal left to conquer is the high set back in May (and, if that is crossed, the all-time high set in January 2000)."
So i guess thats it, ill cover and sell my puts and go long because now there is a 100% chance that the dow goes back to 11700, thats it, what happens when and if 11700 is reached and october starts creeping up. Will that be the excuse to sell and go short.
What you are seeing is a classic, textbook example of how a bullish reversal takes place.
When everyone is doom and gloom and shorting with all they can, a few of the large institutions use some excuse (this time it was PPI & CPI, could have been anything) to pump up some of the shares. Shorts with tight stops are taken out, the institutions unload their shares on them making a profit. Then they repeat this process taking out new bunches of shorts at higher and higher levels. The big institutions keep making profits at each stage - its the shorts who lose out. The process is self-sustaining because of the large number of shorts who panic, and keep covering on each dip. The shorts with the tight stops suffer the least losses. Where the rally stops depends on the number of shorts, the number of profit takers, and any external news. In this case, news has been good (good HP earnings, lower oil and gas, ME ceasefire holding, etc.). So we may see the rally sustained for some time. I don't agree its all because of options manipulation. Some of it may be that, but because of this process, we should be seeing a sustained rally.
Anyone still short from 11K should have their tradings re-evaluated. No reason anyone should take a 360 point jam against you.
Trade Safe
Trader II
I don't agree that it's just fund money. There's just absolutely no way they would continue to buy, buy, buy for days at a stretch like this.
Manipulation is seen when the indices absolutely fail to decline even 5 points or so. It's a perfect straight line upwards. If funds were buying, they would buy in blocks, not in a steady stream over the course of 4 days.
Just like when the markets go down, the sellers hit the bid and short at the same time.
Think of it this way: SOMEBODY had to be selling their shares over the last 4 days. And for the indices to rise in such a straight line like that, there's no way it's just "random chance."
Look at the 5-day behavior of COMPQ, INDU, SPY, QQQQ, or whatever. There aren't even any dips or spikes at all. It's a nonstop stream of buying.
That is NOT how funds operate, especially in this environment.
Good news is bad news and bad news is good news. When does that factor change. When does a bullish GDP become great news and not bad news. When does a great job numbers become great news and not bad news. Seems that the trend were in now is that a bad GDP is great along with light employment numbers.
Trader 2006
"Look at the 5-day behavior of COMPQ, INDU, SPY, QQQQ, or whatever. There aren't even any dips or spikes at all. It's a nonstop stream of buying."
Sorry to be rude, but this is actually funny. To see un-abated straight line buying for 1, no 2, no 3, no 4 days!!! And yet you didn't join the party. The problem isn't the government nor the market. It's you. Alot of folks here have embledded bearish views here about the economy and the market. Market fundamentals don't drive the market liquidity does.
Trader II
costas the bear turned bull or???
Only possible way I would buy these markets is on a minor dip, say if the dow backed off to 11250 and nasdaq 2125. Then i would add, only buying into ETFs such as SMH, EWZ, PSI, PHO, PIV etc. Knowing my luck ill add on a few long positions only to see profit taking kick in at 10am tomorrow morning.
Trader 2006
Look at USO dropping hard the past few days trading around 65.90
Sitting on the sideline for now.
- Jay Mac
Anonymous 10:04
Its the shorts covering on each dip which you see as buying. The institution just buys a block of shares early, drives the price up, and then sells the shares to the shorts who got stopped out or panic and cover. Old, old trick, I wonder why no one saw it coming.
"Its the shorts covering on each dip which you see as buying. The institution just buys a block of shares early, drives the price up, and then sells the shares to the shorts who got stopped out or panic and cover. Old, old trick, I wonder why no one saw it coming."
Those are your assumptions. No one knows, nor confirm this. We use technical analysis to spot entry, exit & price trends. I think we should use it.
Trader II here is a list of reasons why I think new great highs on the dow is limited
Inflation on the rise, people who think inflation isnt there has problems.
ARMS are in reset mode, individuals paying more out of their pockets then they were a year ago to live in their nice new house that they bought with NO MONEY DOWN!!!
M3? what M3???
Housing bubble has popped, I continue to read the news about a glut of houses and condos on the market. The sector is done with. I see another 5% drop in housing prices by the end of 2006 and 8-12% dip by end of 2007.
People using there houses as piggy banks is nearing an end. How much can you borrow against your house to fuel your spending habits. With rates up the cost to borrow is going higher. 2/3 of the economy is based on consumer spending. Without the consumer spending what do you think happens.
NEGATIVE savings in America. Everyone spends spends spends. Major debt on the rise.
Value of the dollar continues to drop.
OIL still trading above $70.
A war that is costing billions and billions of dollars
Possible recession in 1st half of 2007.
Corporate profits slowing.
Trader 2006
watching the dow trade up 43 down to 40 back to 41, soon to be 46 if the the manipulation continues.
Trader 2006
"Think of it this way: SOMEBODY had to be selling their shares over the last 4 days"
_____________________
That's entertaining, considering you're posting this on a bear site. Ever occur to you that selling and short selling look alike?
haha AMZN up $1.55 and EBAY up over $1.85.
Incredible.
these 2 g net stocks that had such pathetic earnings taking advantage of the 3 day rally.
Trader 2006
Trader 2006,
Again, those are fundamentals/news of the market and since we are all know about it, it's already old news. I have pointed out that if you look oversea in the Hang Sang Market, it have just printed new 52 week high and 5 year highs. The Hang Sang market are facing the same issues here. A bubble housing market, inflation, high oil/gas prices etc. but YET it still print new highs? Why? I don't know, nor does anyone else. But what i do know is it was able to climb to new highs despite all the negative news. My years of trading have taught me to see a trend and don't fight it. The news is all noise.
Trader II
So you think those with influence are buying as an investment at these ridiculous levels? Ok, so where were these dumb tossers when the market was below 11000? Do you all think serious investing institutions just sit around and wait for news to come, wait and see what the market reaction is and then join in by buying. Thats whats amateurs do. The prices are being marked up by your marketmakers and the amount of buying actually going on at those inflated levels is very basic. The sustainablity has more to do with a lack of sellers than anything else. Simple as that. Few people want to take on the market by selling, whether its the futures or actual shares under these circumstances. Until there is collective selling of substance or until the marketmekers decide to protect their wholesale trading positions against a possible selling spree by marking the prices down instead of up, this farce carries on. I think at any time now though, that protective cover will come and then be reinforced by some good old fashion profit taking. If you were a fund mamager wouldnt you rather buy a 'good thing' at a low price and not a high price? As it happens the entire markets are so over inflated, none are worth buying. Role on a repeat of 1987, because this is very similar to what happened then, in terms or sentiment. Remeber the Titantic was thought to be unsinkable......and that misjudged, ill informed and arrogant belief is exact what exists right now
AMZN filling the gap up 33 to 29.
I read so many posts with detailed analysis recommending going short on AMZN at 25. Now it is close to 30. This is incredible.
Guess what? The max pain price for AMZN is .............
30
- Jay Mac
"Think of it this way: SOMEBODY had to be selling their shares over the last 4 days"
_____________________
That's entertaining, considering you're posting this on a bear site. Ever occur to you that selling and short selling look alike?
10:32 AM
Now let's be reasonable. You can't use the argument that this rally is fueled by short-covering, then come back and say that all of the sellers in the last 2 days are short sellers!
So which is it? Short covering or short selling? You can't have it both ways. I don't know of one single short that covers his position, then reshorts immediately.
Downosedive said:
"Do you all think serious investing institutions just sit around and wait for news to come, wait and see what the market reaction is and then join in by buying. Thats whats amateurs do. The prices are being marked up by your marketmakers and the amount of buying actually going on at those inflated levels is very basic."
Wow. Very good stuff there. I completely agree. You don't see fund managers waiting until the train has already left the station before joining in the buying spree. If stock prices are so damn cheap at Dow-11,350, then doesn't it stand to reason that they were DIRT CHEAP at 10,700??
This is manipulation, plain and simple. There is no other alternative. Big Money buyers don't buy stocks when they're already 20% off their lows and on a major 4-day runup. They're SELLING at these prices.
It's amateurs like some of the bulls around here that are buying their shares, just to jump on board the train. That's fine, if you can scalp a profit, but I get the feeling that when this train stops, people will go flying off.
Jay Mac
Glad you are using and proving the max pain theory.
Next time, you can make a killing from it.
I know on the next dip people will regret not selling now. If we go red thats it for the day, profit taking will begin. IF we stay green could finish the day strong but who knows.
As for AMZN jay, i would be willing to short but that would just increase my risk in my portfolio, im good with my QID and SDS for now. Have cash to play with but really waiting for USO to drop under $65 so i can buy. Last time it dropped to the mid 60's it rallied. Not saying it will happen again but I think oil looks oversold.
Trader 2006
watcher where can i find the max pain theories
Trader 2006
I remember watching Cramer last week talking about how AMZN and EBAY were out and VCLK, NILE and IACI were in. Funny EBAY and AMZN are up about 2-3 bucks since then. Cramer times everything perfect ahhahahaha
Trader 2006
Hey guys! The rally seems to be fizzling.
But watch out for institutions to step in in again - they have to keep it up till tomorrow. After that, its downhill all the way. Yipee!
Wow, the Dow just dove hard and fast down from 42 points to 6 points in like 20 minutes.
Looks like the liquidity faucet has been turned OFF today for the recent 2 PM market float.
If profit taking ensues and continues past 3 PM, the bears could be in good shape.
-Tony
Here's the site with the Max Pain calculator:
http://www.iqauto.com/cgi-bin/pain.pl
It has links to the theory too. Amazing articles. Cramer (I always thought he was a nitwit) wrote an article on it in 1997. Too bad his stock-picking isn't better than a monkey's (www.cramerwatch.org). But the theory itself seems to work. Purdue University has done some serious work on it.
IMO
people who say that the fund managers are playing with the market are assuming that all fund managers are great at their job. " that is untrue "
there really is only a few great fund managers. considering that there is thousands of funds , there cannot posibly be thousands of good managers.
yes, they have more money to work with, but they will still have their own HERDING mentality
I refuse to believe that they act in concert with each other, they compete with each other
Cramer is worth $60 million. He can say whatever he wants!
BSI you mention:
"On this scale, there was a nice H&S pattern that, if the neckline at 2050 had broken, would have put the Naz below 2000. But late Friday afternoon last week when it didn't break, I closed all my short positions. That was a good move since there was a gap up open this past Monday. "
thats why its tough to trade this market, the charts were showing that but when the economic data came out all was changed in seconds at 8:31am tueday morning after the PPI was out.
those "amateur" bulls made a lot of money in this unexpected run.
funny, in another much earlier post i mentioned the gnomes would jack up this market. Paulson, no doubt, was ordered to "make it happen" and given the liquidity to do so - and he is.
the question is whether this rally will sustain until the november elections are over. keep in mind that this administration has not generated any good news since its inception and incumbent republicans are panicking.
inflation? according to the gov stats inflation is under control. the real danger is that the dollar is in danger of being yanked as the world's currency. if that happens gold flies high and the major players with all their short positions will fall heavily. now that would be a crash!
housing? bubble is leaking. refinancing provided a lot of liquidity for consumer spending. don't count on it in the coming years.
energy? might drop if there is a significant slowdown in the economy but a hard winter, hurricanes, and midEast instability will float this sector.
my pov is that this rally is all political. the question is will the gnomes attempt to break dow 12000?
i got caught with puts and got my behind whipped. well, that's the trader's life...
as a closing: let us think of the poor soldiers in iraq who are being forgotten. i may have lost some money in this market, but they are losing their lives, hands, legs...
good luck to all.
john
bsi87,
You seem to be an experienced trader. I am a beginner and lose a lot of money(painful lessons).
Are your trades profitable?
tie is fun to short if you time it right you can make quick money. Traded it a few times before. Last short i had on it was $32.50, right before a fed announcement, after that the stock went up and I sold, if i would have only held onto it. hahah. Never traded it after that.
Trader 2006
could someone tell me to hold off on USO im sooo tempted to buy it here. I think it could be trading back at 67-68 sometime next week.
Trader 2006
Right now every bear in here is wishing they added more to their short positions and every bull is wishing they sold. I for one was going to add more to my QID at 67 but held off, then at 65.90 i was tempted but said no way. Ended up with no trades today, just sitting back waiting to see where we head by 4pm. Next week is a different story.
Trader 2006
Is there any rhyme or reason to this market? Bearish, bullish, bearish, make up your mind!
Anon 10:24 "Those are your assumptions. No one knows, nor confirm this. We use technical analysis to spot entry, exit & price trends. I think we should use it."
Technical analysis is useful and I rely on it a lot, but did it indicate this rally? Or this reversal we're seeing right now? All the trendlines, patterns, indicators - nothing forecasted this. So you have to know how the market works, too.
I got margined called yesterday even though I've been saying that 2145-2150 will be met with heavy resistance. People ask me why I don't stop out. Stop out with losses? Are you crazy? A crash is coming and you expect me to accept losses. Today proves my point. I'm setting up a loan on my house to reshort that puppy. I can only be wrong so many times. Ive seen it before. REALITY ALWAYS CATCHES UP. NAZ crash here we come. Bears prepare to be rich, heavy resistance is gonna drown the market.
-Anon who used to be in trouble but richer in the future.
JUST SCALPED ebay for 5 cents ha
Trader 2006
"Think of it this way: SOMEBODY had to be selling their shares over the last 4 days"
_____________________
That's entertaining, considering you're posting this on a bear site. Ever occur to you that selling and short selling look alike?
10:32 AM
Now let's be reasonable. You can't use the argument that this rally is fueled by short-covering, then come back and say that all of the sellers in the last 2 days are short sellers!
So which is it? Short covering or short selling? You can't have it both ways. I don't know of one single short that covers his position, then reshorts immediately.
10:40 AM
======================
A.) That was my only post of the day (until now). I didn't "come back" and say anything.
The selling would be comprised of daytraders taking profits, and retail shorts who can't take a hint.
Nasdaq short interest is at an all time high. In case it's escaped your attention, everybody and his dog has shorting capability nowadays, and they sell bottoms the same way retail longs ('Mom and Pop') buy tops.
Pause and reflect on the tone of the posts on this site.
Shorts used to be considered smarter than longs, because they often did much more homework on the companies they shorted. They shorted specific companies, and for specific reasons. Shorting now is just herd behavior. (Looks like Tim Knight has failed to notice that he's part of that herd.)
Woo hoo! The PPT is back in action!
Look at those indices float back upward!! Slow and steady, just the way they like it. Turn on the faucets and let the money flowwwwwwwwwwwww!!
Anon:
Bullish technicals are there you just missed them. If you look at the Dow we broke out of two bullish patterns yesterday 1. a double bottom that formed in the last three months and 2. a bull flag that formed over the past month. I'm not saying they are going to hold only that they are there. For the bearish, there is however a potential double top but why not wait for confirmation rather than sitting short and hoping it will form.
I'm glad you brought up the subject of technical analysis. I've been reading this blog for two weeks now and except for Tim's analysis there is very little technical analysis discussion in the comments section for a blog titled Technical Analysis and Stock Charts.
Personally, I think it would be great if people discussed what they are seeing on charts rather than talking about how stupid bulls are because they do not read economic indicators the same way they do, which I think serves no purpose other than to totally screw up your mental game which I believe is the most important part of trading.
Staying bullish until a lower low and lower high is formed.
Good luck everyone! MED
Aug 18 9:50 AM Mich Sentiment-Prel. Aug - 82.5 84.0 84.7 -
tomorrow economic data
Trader 2006
some tech analysis:
Looks like IGN, IGW and IGV have broken through their upper resistance(downward trend).
am I right?
DELL goes either 25 or 19. Im thinking 19
Trader 2006
Yay! Yet another great day for the Bulls. Now the usually pullback and then a nice move up on the S&P 500 which is looking nice (for the Bulls).
Congrats to all of us Bulls that profited from this nice week. Smoke 'em if you got 'em.
=^.^=
Ok, here's my technical analysis for basically every stock in the market, INCLUDING the indices:
Major shooting star today after 2 huge white candles following a bullish reversal.
We SHOULD be in the red tomorrow across the board, as well as a very high likelihood of a follow-through red day on Monday.
If anyone with technical background can honestly look at today's action and call it bullish, then I'm calling bullshit on that.
The fact is that options expiry tomorrow will throw all that technical analysis out the window. The markets are doing whatever they want to do right now. Technicals mean absolutely nothing.
"The markets are doing whatever they want to do right now. Technicals mean absolutely nothing."
Which means your analysis previous to that statement is bullshit as well. ;-)
It'll be Green tomorrow. The Bears were wrong and will continue to be so. The market has made its turn and, sans a NORMAL pullback, the S&P/DOW will be up at the end of the year. There is no Bear market.
The Bears are wrong (as usual).
=^.^=
what is happening to the dow with 10 minutes left in the day.
Folks, I really do encourage you to pull up intraday charts (at least 5 day) and look at the price action of the indices.
Like a freight train, straight up at a 45 degree angle. No dips, no spikes, no hesitation.
Today, we saw a decline which was again, straight as an arrow at a 45 degree angle, then by MAGIC the indices started on their climb again, at that same 45 degree angle upwards.
I've been watching intraday charts forever and I can honestly say that I've never, EVER, seen action like this. Look at the typical Dow intraday spreads and action. The price action is all over the place. Spike in the morning, selloff at 11, a "noon balloon", then maybe some margin action after 2 PM, with an occasional spike or drop going into the close.
Now we see nothing but pure manipulated price action from start to finish. This is not your normal run-of-the-mill random buying action. This is pure manipulation, plain and simple.
The only hope for the bears is that people regain their senses and start selling off after the 4-5% gains in the indices this week. Or, if the shorts grow some hair on their chests and start shorting like they should be doing here up in the stratosphere.
Anon MED
"Bullish technicals are there you just missed them."
And perhaps so did 99% of everyone else.
"If you look at the Dow we broke out of two bullish patterns yesterday 1. a double bottom that formed in the last three months and 2. a bull flag that formed over the past month."
Easy to point out after the fact. How come no one brought this up before?
I'm not trashing TA - I use it a lot. Only want to say that the patterns are subject to interpretation (you see what you want to see), and do not hold when there is major market manipulation like this week.
The old axiom that the market loves
to climb a 'wall of worry'is
holding true once again,and
judging by what I'm reading today
on the blogs is that there is still
a lot of worry.In fact the higher
the DJIA goes,the higher the worry
levels are getting.I would have to think that at least until Sept.11
has passed,no major selloffs.That
date has almost become like a new
July 4th for the markets.A new high
on or around 9/11 would be symbolic of our resolve.The psych-
ology of all this is equally as
important as the technicals.
Good Luck to all ! C.H.
today neutral to bad for bulls, as the indicies are pushing higher, the volume is fading...
dell not good for bulls
Anon
obviously 99% of traders did not miss it. and the fact no one on this site brought it up is exactly why I made my comments earlier.
i'm not biased either way. when i see a higher high and higher low at potential area of support i go long. when i see a lower low at resist. i go short. if tommorrow we drop below todays low i'll go short. i've learned my lesson not waiting for confirmation and trading what i think is going to happen.
i think everything else is just noise. i may be a simpleton but i don't buy conspiracy theories or believe i'm smarter than the economists at Goldman.
MED
check out this blog post regarding recent rallies and their associated volume - very interesting
http://bigpicture.typepad.com/comments/2006/08/wanted_volume_p.html
fellow bears. nice rants. I love it.
but you KNOW things are not in favor, when we have to start saying that there is "price manipulation" that is causing this new bullish cycle.
c'mon guys.
like you, I would love to see this puppy fall like a rock, but theres no way we can just ignore what has been going on.
OF COURSE, you'll see volume get a little less, ITS BEEN THREE DAYS OF PURE GAINS! of COURSE you'll see some selling tomorrow: WE HAVE HAD THREE DAYS OF PURE GAINS!
There is a systematic selloff that will happen, but now our huge resistance (spx:1280) will now be a huge support level. and if I were anyone on here, I would appreciate when we are wrong (I TOO AM INCLUDED, because i had puts all across the board), and look at this next price action toward teh support as a time to get rid of your shorts, before the indices start moving back up.
For those of you looking for shorts, here are a few:
ESLR
F
AAPL
VOL
ESLR should drop back into the mid to low $8 range.
F needs to retrace. It's way too overextended there.
AAPL, well what can be said there. I guess the potential is there for it to go back near $70 for a double top, but I just don't see much left in the tank on that one.
I was lucky enough to get VOL at $43.75 today, but there's still a ton of downside left. It got rejected by the 50-day SMA and is right at the top of a downward trading channel. Easy $40-37 downside potential, if not more.
Good luck.
-Tony
Stockshaker: You're right about the support. I think we've gotten past the panic stage and are once again trying to make a new a bullish trend. A retest of the previous resistances would prove that.
Dow 11,250
S&P 1280
Naz 2100
Good targets to cover shorts and switch to the longside if the technicals look right.
-Tony
Hey bsi87: How are you shorting the RUT? I see you can buy puts against IWM, but is there a short ETF?
Thanks.
-Tony
There are alot of poor traders here. Some continue to refuse to acknowledge this breakout to the upside. You either learn to trade or GTFO.
Market is up 350 points since monday and we have alot of folks yapping about the coming crash. Unbelieveable!
the trader II
Your marketmakers (yeah ok Im a Brit) will now start to cover themselves by opening with prices marked down slightly and from then on it will depend on whether there is any selling across the board, or whether trades are roughly equal buy/sell or indeed whether they are more on the buy side (should be inconceivable at these levels). The VOLUME doesnt have the be high in either direction to move the market one way or another. The marketmakers will seek to balance supply and demand for shares by varying the spreads they offer in accordance with their liabilities to settle any outstanding trades, and their existing holdings of shares in relation to actual and anticipated demand patterns from buyers and sellers. They are literally like wholesale traders in an open market. They buy and sell to each other as well as buy and sell with their customers. They dont want to be left with too little stock to sell or too much. They trade 'on-credit' (by commiting to buy and sell) without actually having to always own the eact quantity of shares - any shortfall are settled within marketmakers intra trading agreements governed/approved by the NYSE. Can you see now where the sudden mark ups and mark downs come from? Sometimes the marketmakers react to absolute volume sales or purchases, other times they can in effect set the trasding pattern in motion without any meaningful volume having been traded. If they get it wron then they either have to finance selling too many shares below the final trading periods closing price and have to buy the excess at a higher price than they sold ie they make a loss. OR if they mark their prices too high, they simply wont be ble to trade....because.....there are several market makers for each companies shares, so when a buyer gets a quote to trade a share the spread reflects the most competitive buy and sell price offered from the sum total of all the market maker for that share. Often they quote the same spreads for the larger companies, but more variable spreads for the mid and small cap companies. Can you all see now, there is no conspiracy theory going on, no Fed interferance and no political agenda, other than naturally none in power intentionally wants to be in charge of a failing economy so of course they would like to paint a rosey picture when things are bad, but NOT actual seek to interfere with free market forcces. Only the NYSE interferes with market forces by having the power to suspend all trading of the DJA falls more than x number of points in any one trading session (it used to be 200 points post 87, but has now been changed I think?). So what you are seeing is market makers pushes prices UP, finding a steady amount of buyers (NOT exceptional, just average) and very little sellers of actual shares. Now after such a mindless rally, the marketmakers will start covering themselves by lowering their prices but only if and as long as, the sellers outweigh the buyers. If the two roughly match, prices stop falling, if buyers exceed sellers the prices start rising. Dont suppose anyone will actual read this post, but heck at least I tried! Do at least bear in ming - I trade only the DJA futures (I dont trade the UK markets)
"There are alot of poor traders here. Some continue to refuse to acknowledge this breakout to the upside. You either learn to trade or GTFO. "
How easy it must be for you to sit back after 4 straight days of absolutely HUGE gains and say that we're "in a breakout."
My 5-year old son can tell that much from the charts.
So other than flapping your gums, exactly what is your point?? That everyone should be BUYING right now? Or should we be selling?
Did you see this coming? Somehow, I don't recall anyone (maybe with the exception of Eddie) who was saying anything even REMOTELY bullish. Eddie actually was calling for S&P to 1300 while it was still at 1262. Great call.
You, on the other hand, are doing nothing at all, except stating the obvious. Of COURSE we're in an uptrend. The point is not to identify it AFTER THE FACT, but rather the point is to determine exactly what to DO about it right NOW.
And right now, the upside SEEMS limited. Nobody knows when the rally will end or what will happen after it does end. Will it continue sideways? Will it drop like a rock? Will it just keep going up and up and up every single day?
Since you seem to have all the answers and have the balls to call everyone here "poor traders," I am keenly interested in your outlook for tomorrow and next week.
Please enlighten us imbeciles.
-Tony
Tony, I like VOL a lot, lower highs, beauty.
but dont' you think the downside is limited to a pretty good support at 40?
Im still keeping my eye on FDG. Today, POSSIBLY could be a small breakout from its downtrending channel, but its a really disgusting candlestick today, which would not be a great bullish indicator of a breakout.
Volume is healthy, suggests buyers and sellers in reasonably equal balance based on this. Cant draw anymore than that, so not much guidance as to where its going to go now (based on volume). Based on any other measure, hell noone knows. Everyone is just saying where they would like things to go. Weve all been thrown by the lack of any dominant selling, just bugger all. Im distraught
stockshaker: It MAY have support at 40. It certainly has been a bit of a stumbling block for the shorts at that level.
But Heck, if it does get to 40, that's still a 5% decline from here. It's worth a shot, especially if you look at the poor volume on the latest "run". I plan on covering near $40 and if it does break through, reshorting as close to $40 as possible, depending on the volume and price action.
Or cover at 40, if it reverses, go long back to the top of the channel for another 5% upside. Doesn't really matter much to me. I just don't see it breaking $44 anytime soon. It reminds me a lot of TRLG, which ran from $15 to $24, only to fall all the way back to $15 again eventually.
There hasn't been any price "cover" on VOL since $30. I'm hoping it breaks $40 and continues down in through September/October.
Good luck.
-Tony
Post a Comment