
Are We Finally Turning Around?
Below is the intraday S&P 500. Does this look like a top to you? At least for the short term? I think so. I sure hope so. An honest to goodness down day was a pleasant change.
The $VIX has been ungodly low lately, and that also seems to be turning around. It sure makes put options cheap at these levels.
The Dow lost a little more than 40 points today. Looks like it's backing away from that ascending trendline.
The NASDAQ 100 bounced away from its own trendline beautifully......
On a daily basis, the S&P 500 has been quite strong medium-term, but so long as that trendline holds, we've still got a bearish disposition on this one. As always, click on the image to see a much bigger one. This chart is loaded with embellishments, which I hope make sense to the most of you.
Gold hit a medium-term high today before turning around into a loss. This could turn out to be a beautiful short, but it's going to take a couple of months to see. It's been unpleasantly strong until today.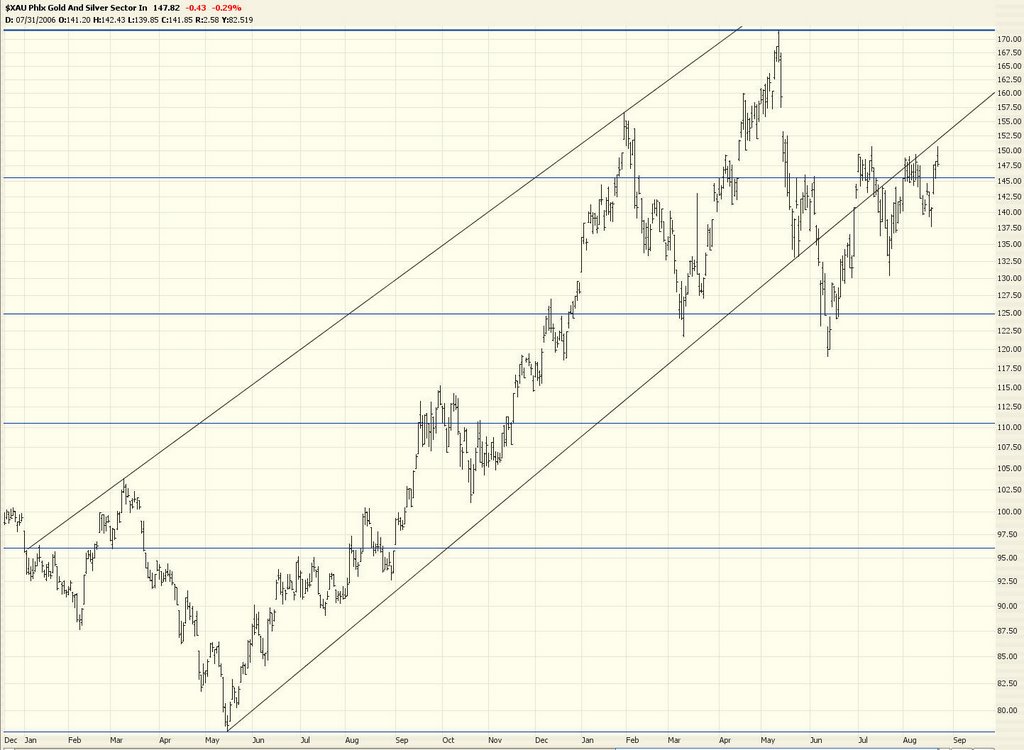
The $XMI has either hit resistance for the third time or is about to produce a marvelous breakout (for the bulls......) This could be a great cup with handle pattern, or we could simply be bouncing off that resistance line again.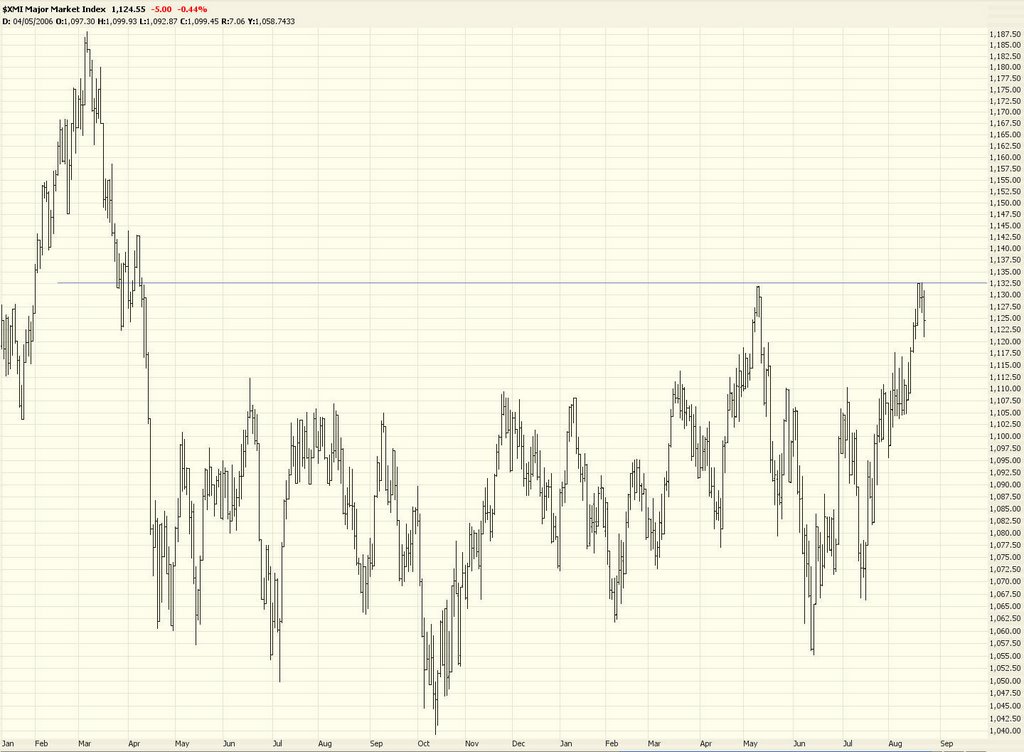
Here are positions from two of my accounts (I've got others, but I couldn't fit all the symbols on the screen.......) This time I'm using symbols to make it easy on you.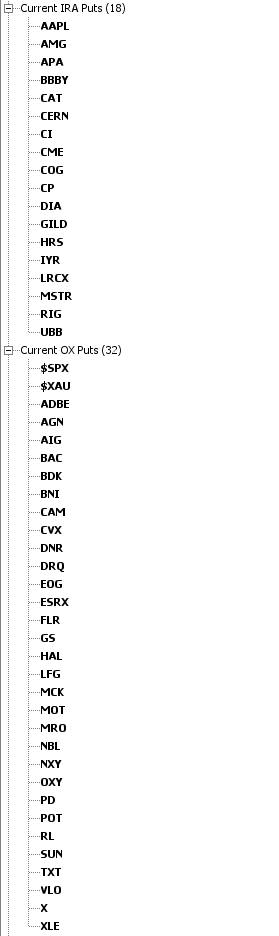
67 comments:
Anyone watch that CNBC show? Wow - not sure what I just watched, but I think this is the beginning of the end. Very unusual (don't want to slander anyone, catch the 9 / 12 shows . . . you judge. I quit the daily shows about 6-8 months ago and had some free time; what a bad time to have a free hour . . . wish I took the time to bike!).
Go down market, go!
Advertising for Cramer are we?
Wow, what is something I said? We've gone from 120 comments a day down to 3! I guess the market is boring people to death.
Kinda boring. Waiting for the fall. Think we are close. Like your posts (great job again!). Too many sloppy posts.
Watched that show . . . hmmm. Don't think it was an ad, but a travesty.
Boring til we get some more confirmed action, TK!
Personally, I'm a bit bored. Just when you think things are breaking down (Dow down -75 at one point), they get a fresh inflow of buyers at the end of the day (Dow ends up down only -41).
All the indices behaved the same way, once again.
I'm sorry, but until we see at least a 100-point loss in the Dow, a 25-30 point loss in the Naz, and a 10+ point loss in the S&P, it's all just noise and the short to mid term trend is still quite bullish.
-Tony
check this out:
http://www.sfomag.com/enewsletter/detail.asp?ID=720
Nikkei down bad, think we'll follow tomorrow.
If market trends still hold, think we'll see flow of capital pump into the market in mid Oct,Dow 11,800..12,000 likely, till then ...zig and zag movement.
I'm watching the Bloomberg channel,it's 10:35PM in Denver,Co where I am, and the Nikkei is down over 200 pts. supposedly on OUR dimal housing market projections and further indications of OUR slowing economy and it's effect on the world economy.Quite ironic.How come OUR market doesn't respond accordinglly.The futures are only down -1.20. The current logic dictates that this means tomrw should be a huge up day on the DJIA. I've been playing long enough to understand contrary indicators and what Put/Call ratios mean but this is getting bizarre ! C.H.
im with tony, makets not following thru on down days, dont know who hold its up with the buying but i dont buy the manipulation theories either. til we get some big down days with serious volume, im just sitting on puts making no $. the market is strange rigt now. cant make money, but also wont move enough to force my stops either, i dont trade these big $ account like some here appear to do , i need some movement to make it $worth it to me .
stii looks like a bull flag on the nas 100 tho,
http://finance.yahoo.com/intlindices?e=asia
Like to look at these in the AM before the open.
bsi87
tony, tubridgee and plunger - yes youre on the right track ref weak little downward moves over the last 2 sessions in the indices. This has been subjest to low volume and has more to do with the marketmakers shuffling the shares prices to ward off the risk of a high volume sell off. The trend has been up a little for the first 30 to 60 mins then sharply down, then a rally in the last 30 mins, to end nominally down. Not a bearish sign at all. in fact the end result of these last 2 sessions is a healthy normal reaction to last weeks rally. If anything, it is a sign of reinforcing a bull run ie an absence of any significant selling pressure. Market is due to open up today and whatever the 3 sets of economic data are the impact is likely to push the indices higher. One hour until start of play.........lets see
Nosey,
Weren't you the one asking for help in deciding how to get out of massive losing positions just a week or so ago?
I suppose it's ok for you to have an opinion but the DJIA for instance is where it was May 22 so one would have been at risk for 3 months with nothing to show for it if long.
On a ST chart, the DJIA is trading below last Thursday/Friday.
Sheesh. Beauty is in the eye I suppose.
bsi87
Lets have a laugh .... the GDP came out a lot worse than expected and the DOW futires are UP 11-16. When the CPI came out .01% better than expected the market the futures were up 100 in less than 5 minutes. .01% is such a fraction of a change. You can see this market is being pumped hard.
Bizzaro world.
yesterday at about 2:45-3:50 there was a pump job and it will continue till at least 10am.
I have found it amazing that every down tick is bought.
there is a collapsing market underneath that is being help up by the big money to support the elections !
1310-1312 for ES. If anyone that haven't gotten out yesterday at 1291.75 should be very carefull here.
The Trader II
I agree about the down ticks. As I stated last week, there is a very steady stream of huge money coming in on the buy side. But not just "random" buying... this is systematic, controlled, steady buying that maintains a constant upward direction. That is not "normal" market behavior.
It's almost as if someone said, "Don't let the sellers gain ANY advantage. Buy every down tick, but don't buy TOO much... just enough to keep things propped up without going haywire."
Everyone admits that the economy WILL slow down. Most are of the opinion that it will slow down dramatically, possibly even going into recession in the next 4-6 months. Yet there is big money BUYING into this market right near the top. You know we're getting close to the top when the talking heads are all cheering that we're only 2-3% off the all time highs.
Bizarro is right.
-Tony
Running the gap and trap on the Naz this morning.
Nah, don't worry. The money will come in soon enough to buy the dips.
If the housing numbers are anything but horrific, the markets will float higher. 7 minutes to go.
-Tony
Apparently nobody anywhere has noticed the HUGE Nasdaq volume after hours for over a week now. Don't think anything is being rebalanced right now (?), so a mystery as to what is causing this.
Aug 16 AH...just over 1 billion
Aug 17 AH...almost 92 million
Aug 18 AH...almost 149 million
Aug 21 AH...almost 54 million
Aug 22 AH...just about 167 million
Aug 23 AH...almost 846 million
Tim, what's that all about? This has been going on for over 6 days now. It's way out of line for 'normal' AH volume (been watching this on and off for years now, and this is way over the top.)
Ok, new home sales figures were pretty surprisingly low. And the markets definitely took a bit of a dive on the news. All of the indices nearly went into the red.
But lo and behold! The markets are perking up once again, up to their best levels of the day!!
Who could have possibly guessed that the markets would go UP on bad housing numbers AND horrible durable goods numbers?? Who'd a thunk it??
-Tony
buying some CHS (small position) at 18.90, trailing stop 2.12 below.
do your own homework.
bsi87
re: PEIX
bottom of 20 day Bollinger Band is 15 bucks. See if it gets there. If the MACD diverges and the stochastics bottom out again, it'd be another nice trade from the long side. Has to break the 20 day EMA first.
bsi87
bsi87, thank you for your many posts. I am especially pleased to have found (and annoyed that I didn't find it on my own) the Yahoo site with all the indices. Thank you for posting that small gem.
And Tim, THANK YOU FOR THIS BLOG, including your lively, fun comments.
~ Nona
Jeez, Tony, whadda you want?
Instant gratification?
Good luck trading off economic reports/numbers. Don't know what the numbers will be, whether the Feds have juiced them, and what market reaction will be by EOD.
bsi87
Thats it.... I've been patient but my screens are screaming opportunity. NVDA CFO/CEO just sold huge.... looks ready to come down.....
BEN is another one that has had quite a run and is turning....
BBBY was a nice call.... I was watching and never pulled the trigger....grrrr.
Time to start pressing...the markets are overbought and ready to come down....
No, no. All I'm referring to is the fact that the market's reaction to the various numbers is just all over the map.
I'm not "trading off economic reports," but the fact is that when the numbers show that the housing market is tanking even worse than expected, and the durable goods numbers are WAY lower than expected, it just stands to reason that people would get the hint that companies' profits just won't be going through the roof in the next few quarters. Yet the market never fails to find new money, regardless of the future outlook.
-Tony
For anyone that needs this
all the indices, futures, charts, etc...
barchart.com
explore this site, free and good
One word explains this market: Complacent
The same thing happened in 1987/2000. The markets got complacent into late august and despite bad news decided to run equity prices up.... sound familiar??? I don't think stocks will challenge their old highs.
This is greed.... no other way to put it- to explain the action this past month.
I am a believer that the markets are being propped up... I don't really care why or by who? But it will eventually stop when people come back after labour day......VOLUME.
Every piece of news is turned into bullish news and it's not. The economy is on the brink of falling apart....
This is the reason I won't go long.... I don't want the rug pulled out from under me..... I hope there are enough exits in a couple months.
But don't worry- Bob Pasani said "There is no sign of a dramatic slowdown in the economy". Liar. Its written on the wall....GDP/Home sales/ Retailers/ 5.25 interest rates/$70 oil/the mid east/ consumer spending....anymore? utter NONSENSE.
Watching the 2115 area. That's where the 20/50 DEMA converge. Russell already broke below those and I think the Naz will follow. If it closes below 2115 on volume (HA, what's volume now?), it'd open the Naz to 2025.
That'd kill a group of bulls who have stops around 2050 and get a new group of bears snorting to go short. (which would be about the place to cover shorts and consider long positions)
bsi87
TK, I think everyone is still here, but the number of comments are down because we are just waiting for the market to show some direction. Love your charts and analysis, though.
I agree with some of the posters here that (i) there seems to be systemic buying pressure on the dips, just enough to keep the markets from selling off too much - that's what is throwing the technicals out of kilter, and (ii) the AH volume in some of the stocks is suspiciously huge. Look at QCOM for the last few days. Over 4 million shares sold AH! Perhaps 'they' don't want these figures in the stats.
re:F
did my analysis. Put a short limit order at 8.11. Then read the USA Today and thought the big boys might get F up to 8.25 or so and changed my order. GRRRR.
bsi87
I would LOVE to find a good search tool taht can find cheap puts/calls with no time premium! I would think this would work with volatility/deltas of options in finding one with marketvalue <= historical prices.
In that case, maybe i've answered my own question, because I know of a site ivolatility.com, which graphs historical prices and market.
of course, I've never used it, because i don't trade based on historical prices and current market values.
But does someone here trade based on volatility?
Loved it when durables came out, way below expectations, and then markets goes up, and an article came out that said even though it was lower than expected, the trend was still up for durables. What about the trend for CPI when it came out?
re:DJIA
now trading below the early August spike. See how it closes.
bsi87
What an interesting day, a little slow. Should get interesting after 1:30. Also keep in mind Bernanke is speaking tomorrow at 10am, could be a definite market mover.
Trader 2006
As of mid-day today, my Small Cap Swing Indicator is still SHORT, at -40, with an eventual target of -70 to -80.
doesnt cnbc know volume does drop off during the summer months. THIS IS NOTHINGGGGG NEW!!!!!
Shaker,
I am a volatility trader (buy low sell high w/ OTM options before and after earnings) and vice versa, i use a few strategies based on the percentile historical IV (not HV) vs. Current IV. I-Volatility is great, so is the investools site. I also believe Larry McMillan has a screener for volatility based strategies that he mentions in his book. I'm sure there is more out there. Brokers like OX or TOS might have screeners for different strategies as well, although I haven't looked into that.
BTW, I DON"T work for any one of those websites
at holding 2 longs
PHO
RTH
If the markets do rally next week i would be entering new shorts around 11550-11650 and covering those shorts if May highs are taken out. If they are taken out which i dont think they will be taken out I would be going short everything before the next big drop.
Trader 2006
time to buy AAPL ... AAPL recall laptops 1.80m units
Wow couple of good news for AAPL, first it was options and now recall. Hopefully this should take the stock to 100+ in a week.
hey marc,
the investools website? I took a look at it a while back, and it still looked really prehistoric (not easy to use).
I really know very little on volatility trading, I had bought a book on Volatility by the same guy who ran Optionetics, found it really unhelpful - too much theory
Larry McMillan does a better job? I'll take a look at it.
Thanks brotha'
I meant that the volatility part of investools was hard to follow. thats what i meant.
Here we go. Imagine that... the same action for the last 3 days: selloff in the morning, followed by increased buying activity starting around 1-1:30 PM.
Simply amazing.
GDP and housing crashing .... LOL, I love this. The worst case for the economy is happeneing. Oil still over 70. YEAHHHHHHHHHHHH. This market is going a lot higher. LOL.
Talking heads on CNBC from the PUMP parade think everything is A OKAY.
phone rings : a: " Hey, keep the market up"
b: " how much "
a: " well dont make it look obvious"
b: "no problem, what about all the economic stuff"
a: "Don't matter we will wire you the money"
b: "you got it"
GS super banks et all. Paulson at the helm.
Here come the afternoon pumps
well guys, looking at the charts, we are at support again. You can easily see on the Dow (around 11,265). the other ones are not as easily distinguishable, because I would have said the spx has a support at 1280 (which is obvious), but I think theres one at where we are right now (around 1293)
This run up looks eerily like what happened after the two month fall in the indices in Sep/Oct 05, and the run up in beginning of Nov 05. It had a slight pullback (11/04), where it would explode higher. This is what happened in each major correction, and that is assuming that this is a correction!
re:Double down guys.
As I said, it was not time to "double down." Let the mkt do what it wishes and trade what you see. I took short positions last Friday amidst all the bulls claiming imminent destruction. THAT was the time to take short positions. With the drifting since then, there's no edge to get short.
I don't know that there's a right side to be on today.
Dbl down comments are mine.
Things feel "wobbly"
bsi87
bsi, i agree with you buddy. things do feel wobbly. But I think its wobbly in favor of the bulls - just because if this market can take up all this bad news, and still manage gains, what will happen with news actually favors the bulls?
That's what I've been struggling with for a while now. It seems that everyone is of the opinion that the economy is slowing down, so the markets naturally should come down as well.
But that's not happening. The markets are all going up in the face of absolutely HORRIBLE news and economic data. The selloffs are not "normal." Like we discussed yesterday, every minor down tick is being bought into.
New money seems to be flowing into these markets every single day.
I'm trying to keep an open mind and look for both long and short opportunities, but there is no direction whatsoever. Yesterday, the Dow was selling off, down 75 points, yet miraculously managed to find some new buyers at the end of the day. Today, the markets were selling off on the horrible economic data, yet once again miraculously managed to find another huge hoard of buyers around 1:45, bringing the indices back up into the green.
New home sales down HUGE this morning. Well, which is it, bad news or good news? First it's bad, THEN it's good. Go figure.
-Tony
Shaker,
More like a boxer who stays on his feet after a flurry of punches. He's still up but for how long?
When I need to clarify direction, I drop back one time frame. In this case, it's the weekly charts and I use a 26 week EMA to see what's what.
Naz is still downtrending, Russell is still downtrending but less so, and the others are flat to slightly up.
IOW, there's not much to get excited about long or short equities.
Bonds are doing ok. XAU/gold are both flat. VXN is flat at 19.
ZZZZZZZZZZZZ.
bsi87
This market drive bears insane!!!
dead bear
As I see it, the long term trend is still up, if you look at the 3 year charts, despite the selloff since May. Now after testing the lows twice (double bottom), we are going back up. I don't see this downtrend continuing in the charts, and the market is shrugging off all sorts of bad news. The bulls seem to want an end-of-the-year rally.
chart trader
There certainly seems to be a "directive" out there in the markets that has been put into place to serve two purposes:
1) Squeeze the shorts out of their positions (happened last week)
2) Prevent the market from dropping until the Big Boys get back from vacation.
Money is definitely being floated into these markets to make sure these two things happen.
I wouldn't be surprised to see all hell break loose next Tuesday.
bsi, Tony, very understandable comments. It is frusterating that even bad news makes the markets go up. And the only thing I have to say is maybe all this bad news, and sloweconomy is slowly being factored into the markets.
People KNOW its slowing, thats not new.
But honestly, do you think (and I know many people on here would love this), for the markets to just fall to the sh*ts? Its a slow decline, and in the longterm decline, there STILL has to be micro bullishness - like a secondary wave, in a primary bear market. That was pure Pring, thankyou.
anyways, I doubt we'll see higher highs in terms of Macro cycles, but we can still see higher highs in a micro cycle (which is what I see right now).
Theres still room up, and I wouldn't be surprised if it takes a while longer. and I would say a while longer because the markets are surprisingly upbeat as of late.
Watch this sucker fall 300 points just cuz I made the last statement.
It always happens to me ;)
The Dow will hit 11600 in September.
chart trader
chart trader
12:03 PM
IF there is a rally to 11600 in sept get ready for a really nice SELLOFF going into oct-nov. Selloff will be bigger than the last!!!
Trader 2006
September of what year?
On Wednesday Aug 23 there was 845,974,400 shares traded on the NAZ in AH. Does anyone have any clue why the AH volume has been so high lately???
http://dynamic.nasdaq.com/dynamic/afterhour5dayvolume.stm
Doug
There is no bear!!! ---- Just keep buying as it's obvious this market LOVES bad news!
Trader Fred!
anyone trade futures, YM etc...if so where can i go to to find info on how to trade?
chart trader,
I suppose it depends on your time frame. Most on this board trade much shorter than a 3 yr chart. The Naz peaked in mid April and has made a series of lower highs since then. It's due for a lower low but I think that'll be a tradeable bottom.
Also the seasonality effect (positive) usually doesn't kick in till after Oct 16. With the mkts going nowhere, I would suspect there could be some pretty good selling in late Sept/early Oct to get rid of underperformers. (Charts will rule instead of my conjecture).
The 11,600 is 2.65% above today's close. The DJIA ATR is over 100 so a day or two's trading would hit 11,600. If you'd said that at 10,700, I'd be impressed.
Shaker
"Range bound". Chant that until something happens. Looks more like the bulls are clawing to hang on IMO. But we'll know in the fullness of time.
Tony
I put a buy limit order for GLD at 60.90. Just felt right. Might only work for 3-4 pts. JMO.
bsi87
Anyone who wants to deny that low volume makes the market prone to manipulation is crazy???? Has anyone seen individual stocks today....... some are getting CRUSHED.
Someone is trying to save the market.....CRAP.
I can't think of one reason why stock prices should go higher.... Maybe its the good earnings (ya right), or the accelerating growth, Or that rates aren't at 5.25.
And I think the trouble will come from foreign mkts, whether Latin America or Far East, rather originate here.
Brazil had a massive selloff yesterday, (EWZ). Down 4% on 50% higher volume.
bsi87
bsi87: I got stopped out of my GLD long position a while ago. I'm not going to touch GLD until it either breaks down below $60 or breaks above $65. Sure, I'll miss out on some of the gains in the meantime, but I get the sense that they're holding gold down pretty firmly. Besides, the 65-week MA is the "true" trendline bottom and gold is still wayyy above that level.
I keep imagining that the markets will come down and I feel that every piece of bad news (like we had today) should help bring it down. But that just doesn't seem to be happening. The PPT is in full force this month and will likely continue to float the markets higher.
I wouldn't doubt that we see 11,600, quite frankly. But if we do, then it *should* be the mother of all shorts. I guess we'll see what happens.
You know damn well that if the Fed raises rates again next month, then the markets are finished. It could be the "wall of worry" effect until the next Fed meeting for all I know. Another 300 points higher for the Dow in 20 trading days? Why the hell not!
-Tony
bsi - you appear to be confusing me with the guy that posted a request for help on his heavy short positions on the Naz and was about to be forced out because he had reached his margin limit. I have posted many times and included by heavy losses on the DJA (sometimes realing in pain!). The theme from a number of my past posts have been repeated on latter occassions by other posters, presumably because they have reached a similar conclusion. So I fail to understand your post, as I said, I can only conclude you are confusing me with someone else
Post a Comment