
Powers of Ten
When I was a young boy, I fondly remember being transfixed by the short feature Powers of Ten shown at the National Air & Space Museum in Washington (the link shows you the same film). It's a completely mesmerizing piece to watch, even though it's about thirty years old and not exactly high tech (the cheesy post-60s spooky-synth music is a bit much).
This is the inspiration behind my posting today - to get a look at the big picture. In this case, the S&P 500 (which is a good enough proxy for the U.S. stock market in general). I'm delighted the Dow lost 120, of course, but I wanted to not make a daily report and instead remind us all what the theme behind my investing philosophy is: to take full advantage of what is likely going to be an extremely bearish market for years to come.
Let us first look at the past 75 years of the index, going back to the depths of the Great Depression. I've embellished this chart with a number of drawn objects as well as major historical themes. As always, click on any image to see a much bigger version.
In this instance, as you can see, there is plenty of room to fall. The bull market from 1982 through 2000 didn't create much in the way of a support zone anywhere, and in spite of what people might regard as a brutal bear market from 2001 to 2003, we are still at some extremely rich levels.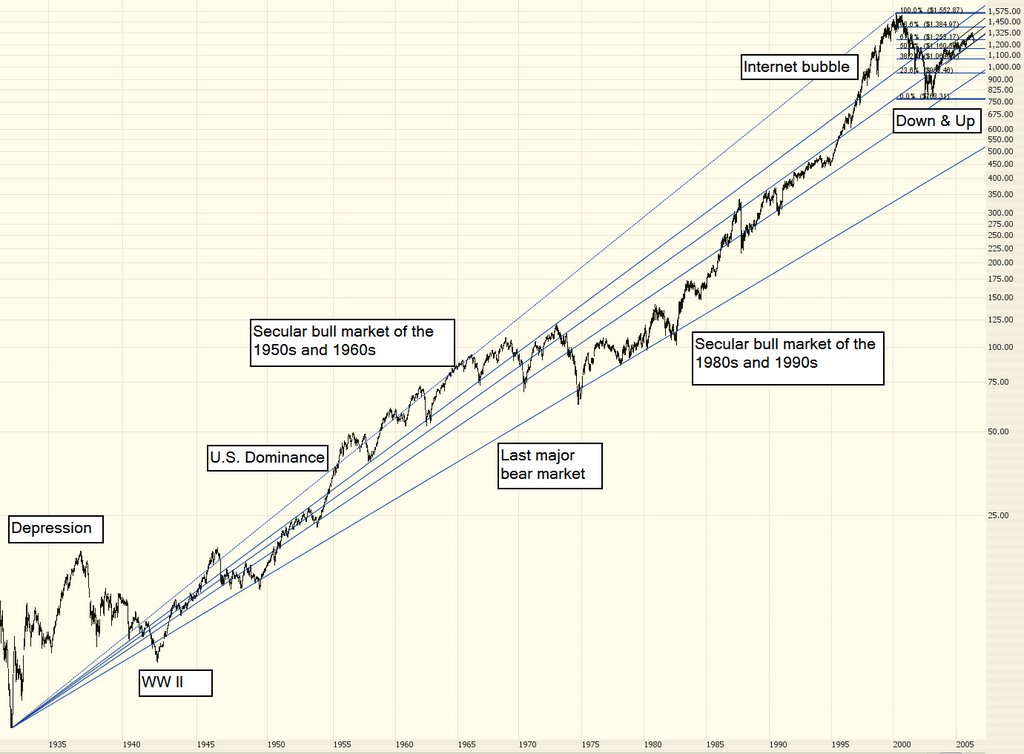
Now let's zoom in (hence the Powers of Ten theme) to the past decade or so. Here you can more plainly see the detail of the Fibonacci Fan as it relates to recent history, as well as the Fibonacci retracement levels. I've drawn an area to illustrate the likely path and speed of the market's fall for the next year or so.
Zooming closer, we see the support levels dictated by the Fibonacci lines. I've circled some likely zones to where the market will successively fall if weakness continues.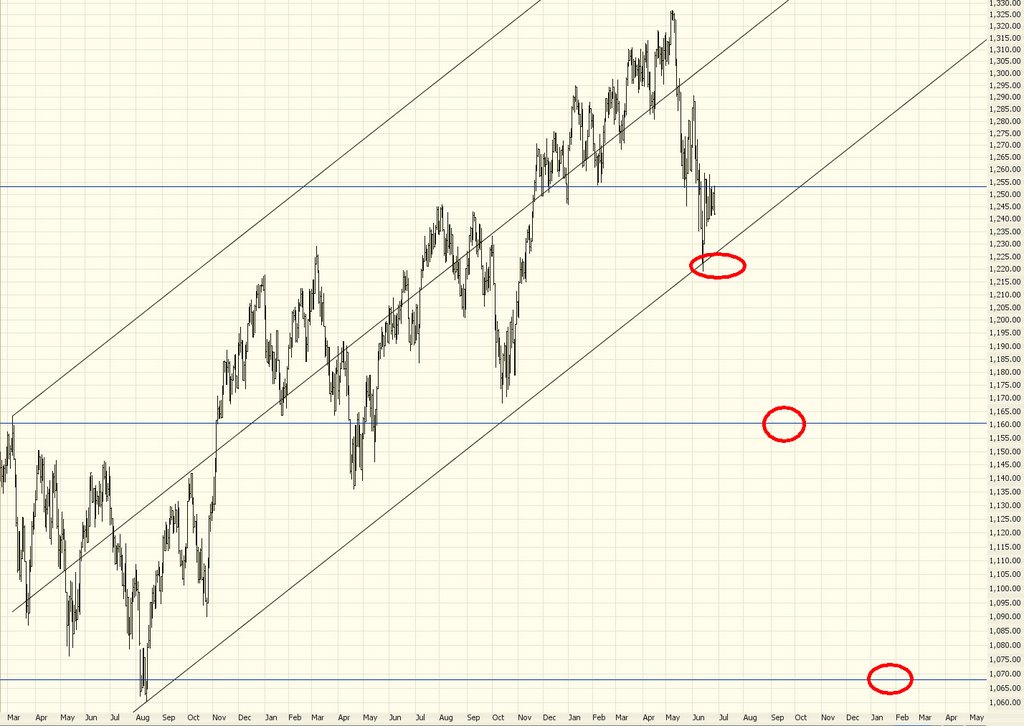
To me, the graph below is currently the most interesting, since it plainly illustrates how the index has not been able to conquer its current resistance level, and indeed, it has started to weaken. It would not takea lot of damage to the market for it to cut through that supporting trendline you see.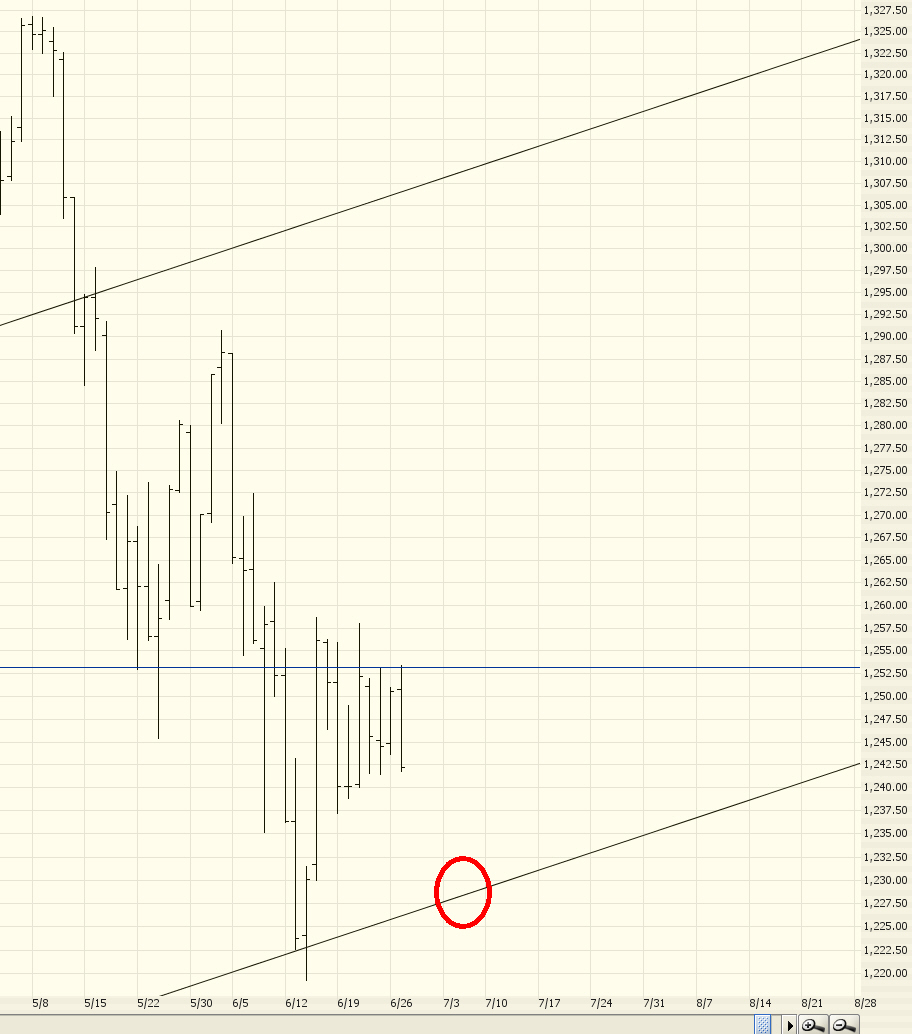
Finally, the minute-by-minute intraday graph gives us a view into the rounded top that has been forming. I've drawn a red line to illustrate the level which constitutes the top. If prices fall cleanly below this level, the odds of a continued fall are much stronger.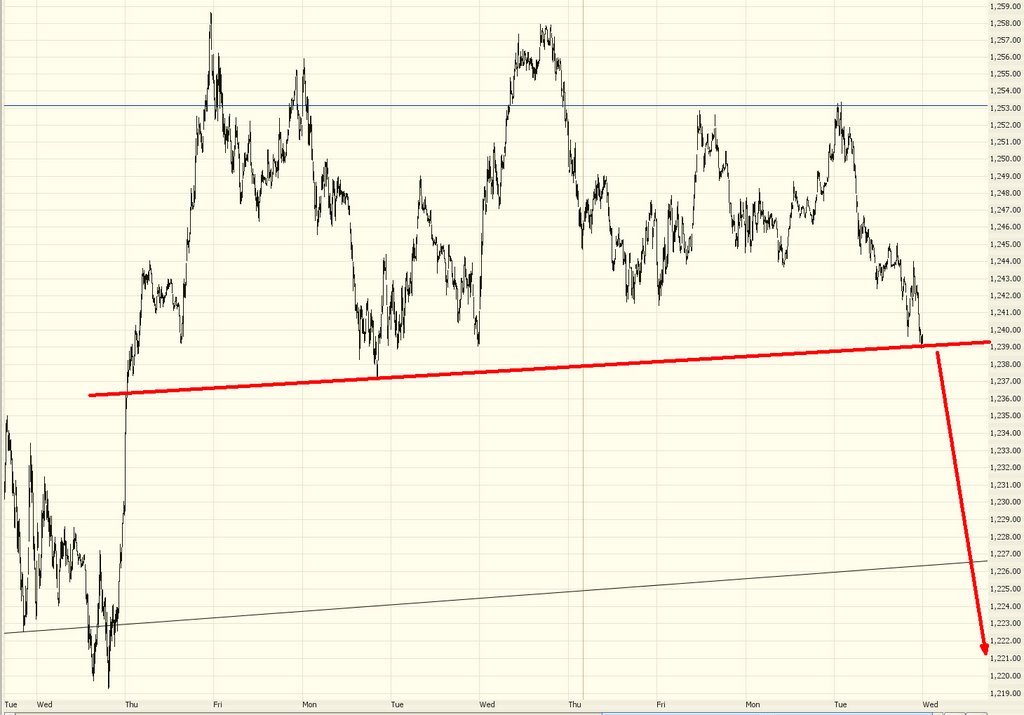
Everyone's fixated on Bernanke and Thursday's announcement. How tedious. Look, at some point, interest rate increases will stop. It won't save the market. Any more than 0% interest in Japan saved the Nikkei all through the 1990s. Expect the same, stupid spasm on Thursday after they announce that rates are up, or rates or down, or rates or unchanged, or Bernanke is going to shave off that stupid beard. It won't really matter in the end. It's just noise.
16 comments:
Tim your analysis is excellent as usual and I believe we will be having a multi-year bear market and in fact we may already be in one that began in 2000. In fact I doubt that we will get out of the current bear market until 2008. And that will be 8 years of malaise which is enough.
But I made money today as did many others and at the end of the day it really is about making money. Point is people stop waiting whether you favor the long or the short side find a position, take the position and play.
My golf match was rained out so I played all day. My luck with MRVL was outstanding. I had PSQ and TEVA and PSQ worked so well that I doubled up at the end of day. PSQ went up about 3x what TEVA went down. As I expected the gold shares just kind of sat – dropped 11 cents all told.
Then to prove how crazy I am (Dr. Brett says all good traders have a few screws loose) I took a shot at TTWO on the bad news gap down this morning. Bought a load on the second 15-minute bar and rode it up all day until 2:30 or so when it doubled back on the trailing stop. Made a good day’s pay. Yes I bought long and made money on a day when the market collapsed in despair over - who knows what - maybe Bernake's beard.
Well I’m off for keeps this time – going to the fun and sun of Atlantic City where they will comp me a luxury suite for a couple of nights and buy all my food and drinks. Then if my MaRVeLous luck holds out I might even make a couple of bucks. I’ll let you all know on Friday.
Good trading everyone.
A Fibonacci fan from the beginning of the SPX500.
What a great original idea!
I would never have thought about it.
If I had had the same idea on a retracement from the start of the index, I would have certainly mailed it to you.
Great original thought!
You are the best!
Tim, another thought I have, does your version have a Fibonacci arc? It is similar to the fan, but track the up, topping/bottoming, and down swing of a stock around a (Fib) point.
I'm also thinking it will be nice to have an arc line tool (2-3 points), or an "S" curve (3-5 points).
I'm only interested because I'm seeing DIA do a very nice arc, or even arch, over the past couple of weeks and is now on its downward leg. It would be interesting to track the chart that way too. A 4 or 5-point arc would be wonderful to track the bottom as it curves around the center on 6/22 (not quite sure the price for the center: 108.81, 108.26 or 107.92). I have about 10 lines on my chart dedicated to just drawing that same arch, and more every day trying to figure out where it will go.
Just another Fib tool to toss into the mix.
Think DIA will hit 107.92 tomorrow? Or do you tend to look more long-term?
Hurricane, would REV be interesting? It bounced off of its low Fib line (1.28 is what I have) 3 times this afternoon. I think it is ready to head back up for a week or so. I got in on it at 1.30. Wish I had some real money to toss at it. I haven't set a goal, but it will definately get over 1.50. I'll probably trail a stop-loss.
Oldsoothsayer - your comment seems sarcastic, so I must respond - - - my fan wasn't drawn from the BEGINNING of the index. It was drawn from the bottom of the Depression, as it should be. So I'm not sure what your point is. =Shrug=
Oh, and hurricane - welcome back.
hurricane, one more question. Do you know a game called JumpGate?
Hi Uncle Tim, this is Tom...Tom Knight. I just wanted to let you know that I enjoy checking your blog out from my summer job in New York. Hopefully things aren't quite as bad as you predict, otherwise I'll be out of a job; the interns are always the first to go. Talk to you soon.
I didn't put down what I thought would be the high for DIA, and I had drawn out 109.50 for it. It should be all downhill from the actual high of 109.64. I didn't anticipate such a large gap (109.48), I thought it would be more moderate (109.35)
Gotta wait to see if it hits 107.92. The bears will rule this day on DIA!
Hurricane, Tim has made me a believer in the Fib line. Today, REV will just hang out around 1.30. Maybe even tomorrow. But by the beginning of next week, it will definately be swinging up.
Out of Hurricane's 10, my month or more bull picks from a quick glance:
GOOG (Hate to buck Tim on this one, but it looks like it is on an upward trend for a while.)
SIRI
MOVI
JLG
I don't see enough of a trend with the others to think they are going up, and most look like they are going down with one going sideways and some look like they are making, or in the middle of, topping patterns.
I haven't done an in-depth analysis of these, so I could change my mind if I do.
Bears (mostly following the market - down):
NTRI
ZRAN
EBAY
ZOLT
TRID
appl breaks almost 3-year trendline today...
i think you guys are getting too far ahead of yourselves
unless the fed drops a 50 basis point hike tomorrow, i doubt we'll get a breakdown yet
if we close this week up we are most likely going to test top resistance at least once again before further downward action
Interesting comments here. ANON I tend to steer in your direction but not to a test of the previous high. But in priciple I think you are most likely correct - a firm short upwards movement maybe then followed by a downwards fall. Hurricane - always refreshing to see a full blown bull ! (meant as a friendly comment!) Who knows, after all there is about a 15% chance of the DJI ending up at year close.........ummm. Fireworks tomorrow.........
25 bp is a definite. I think 50 bp is a rumor however if the fed does 50 bp and by chance pauses the markets will most likely rally knowing the fed is done and that the uncertainty is out of the way, however this less than 3% chance of this happening.
Tomorrow is going to be an extremely volatile day and it could follow through into friday.
cowboytrader, what I see with DIA is that, the rally today was weaker than Monday. And volume is less and less per week too. Feels like a fuse going into a firecracker - whether or not the firecracker is a dud we have to wait to see. It is very possible that Thursday will look much like Tuesday, or off the wall. It will be nice to have the volume back.
I think this puppy will be less than 107.50 before the July execution date, possibly hitting under 106.
Good news is that I don't have to draw any new lines (but I did anyway, and it's starting to look worse than a spiderweb) - today's action fell about as perfect as I could hope for on three of my trace lines.
Tomorrow highs I'm looking at are 109.66 (gap-down) & 110.12 - I just don't see it going much over that. Too many lines cross there to allow it to go much higher. If it ends up there, I anticipate Friday to be nothing but down again.
Anticipated lows or pauses: 109.12, 108.55. If it closes near 107.92, I suspect another up day on Friday, which it will touch 107.73.
It doesn't look like there is going to be a very dramatic drop, just a slow easing down - but that may depend on what happens tomorrow. I'm still looking for that 107.92 that will definitely happen next week. The 3rd week of July, DIA should be solid under 109 with an open/close on that Tuesday being no more than 107.92 and going down from there.
I think that 3-month trend line will hold baring unforeseen circumstances. And I just don't see the two-month trend line being broken at all - even by a high. That puts the execution under 109. I have a lot of high trend lines on my chart converging between 108.50-109, so I'm aiming for that to be the high.
why is this market in rally mode, dont tell me they expect the federal reserve to Pause hahaha. This market could be down 1-2% in the next 6 hours....looking to take some short positions
Post a Comment