
Q&A Forum
For those of you who subscribe to Barron's, check out this article on the bear market.
Here are some recent questions (and my answers) to recent posts. Thanks for your patience!
Mike: "Based in part on your targets and some things I've read from other experts I trust I entered into some short positions toward the end of the day...not a ton but some. My question is ... is there something specific you'd look for during the day tomorrow that would change your tune? For instance if Dow jumps way above this line? Like to know if there is a point at which you would exit your shorts and change your stance to one of an intermediate term rally as a few other sites expect (3 to 6 weeks)."
At this point, I'd step aside (and be very confused) if:
+ The Dow crossed over 11,132
+ The S&P 500 crossed over 1,259
+ The NASDAQ 100 crossed over 1,586
Rob: "Hi Tim, would you please tell us what positions (other than GOOG) you are currently in and what are some on your watch list?"
My positions are listed below. As for my watch lists, you can subscribe to them for free if you use Prophet.net by going to the Shared Watch List page. My screen name is "Blue Knight"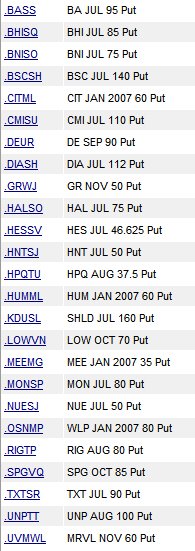
Brian: "Has BSC invalidated it's Head/Shoulders pattern by breaking up over the neckline after breaking down below it?"
I don't really consider this a head and shoulders pattern. I would say the downtrend of this stock remains intact, in spite of last week's strong performance. The price crossing above $139 would change that view.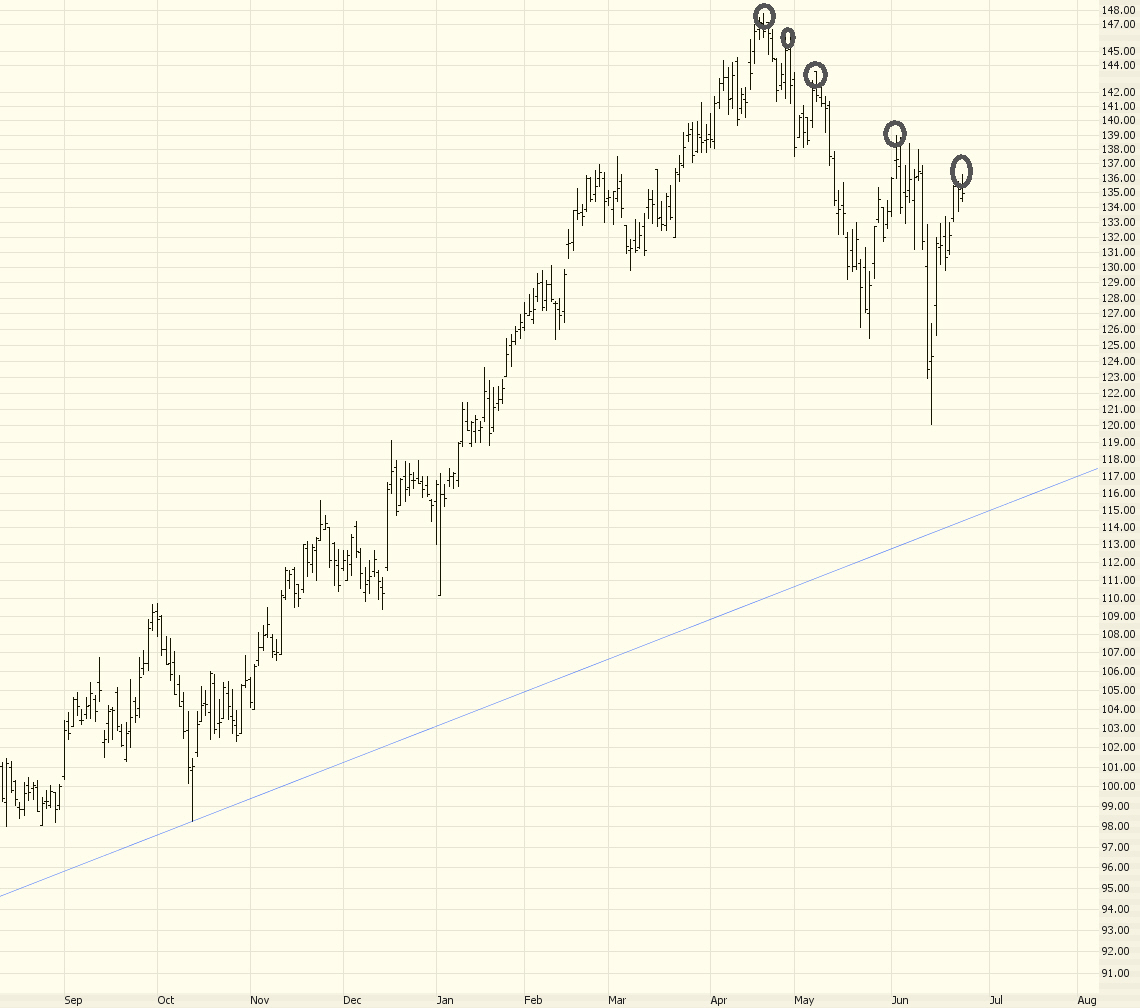
Andrew: "1. Do you have a timeline for the release of ProphetCharts?
2. looking at the Shld chart it looks lie a cup and handle. Now after what I thought was a handle it made a breakout attempt that failed. It also now may be on the verge of an island reversal(not yet confirmed). OK now the question. Can the cup an handle be considered a failure at this point because it made that higher high and then broke below or would we it still be in the handle stage?"
ProphetCharts is going to be part of the new Investor Toolbox. We're going to start slowly releasing that into general production late in the summer.
As for SHLD, yes, it's a cup and handle - - but I think it's failing. And a really shapely bullish pattern which fails often makes for an even better bearish trade!
Anonymous: "Question about shorting. When is it that you have to cover your short before you are "forced" to cover by a short squeeze. For instance if I short SHLD at at $150 and it moves to $165 what are the chances I will be squeezed out of my position and be "forced" to buy back my position at a higher price?"
I don't really think of it in terms of being forced. To my way of thinking, it's all about setting a stop order (or a contigent stop) based on the chart. Where this price is depends on the nature of the pattern. For SHLD, my stop price would be anything above 167.95, simply because crossing above that would validate the bullish saucer pattern.
Brian: "Two big questions.
1) Why do you draw trendlines touching just the price extremes? Some say trendlines should be drawn through congestion areas, ignoring the more panicky extremes. I have noticed that when I draw two trendlines on the same chart, one through price extremes, the other through closing prices, they both seem to be valid, but it creates a lot of confusion regarding proper placement of stops, and calculating my chances of better entry points.
2) I am using Prophet Java Charts through my Scottrade account. I can't save trendlines to use the next day. It would be so much easier if I didn't have to keep redrawing trendlines every day (also, would make me less susceptible to fudging trendlines to fit the current situation). Why can't this be done?"
I don't have any scientific basis for my trendline technique, but I confess to being a bit of a purist. I don't want my trendlines to go going through any price bars because, in my opinion, that invalidates the trendline. The whole point is to watch for new price action to cross beneath or above a long-term trendline. Some days have extremes, sure, but that still represents legitimate price action (assuming the data is clean!)
As for Scottrade, I believe they are using a relatively rudimentary version of the product. Some licensees of the product (such as optionsXpress) enjoy the feature that retains all your drawn objects. You could also take the approach of subscribing to Prophet.net. I agree with you - - redrawing trendlines every day would drive me nuts.
1 comment:
TIM. I love how your 100% puts. To me, it shows you "follow what you preach" What really frustrates me is when brokers say "bull bull bull", and buy puts.
But using Tech Analysis, one can see why one would choose puts, right? At this point, the market is looking for direction, and to me, with all the headlines (even though major website headlines mean absolutely squat to me), but rather the stats, all favor bear. and bear means puts. and puts mean money.
and money is all good.
Post a Comment