
Are We Done?
Today marked what I hope was the high-water mark for the recovery. A number of charts speak favorably to this possibility. First off, the $VIX finished retracing its breakout and almost perfectly touched its former resistance level. It's actually pretty uncanny.
The NASDAQ 100 opened higher but closed off its highs, and its high for the day retraced its recent fall back up to resistance.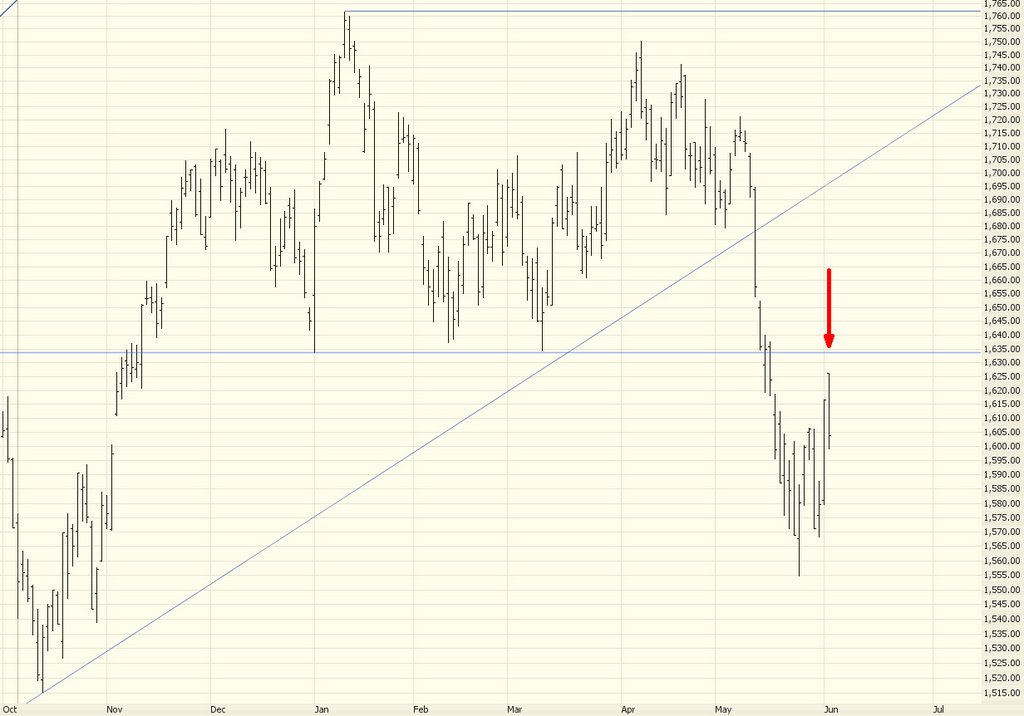
Likewise, the S&P 100 ($OEX) retraced back to its Fibonacci line.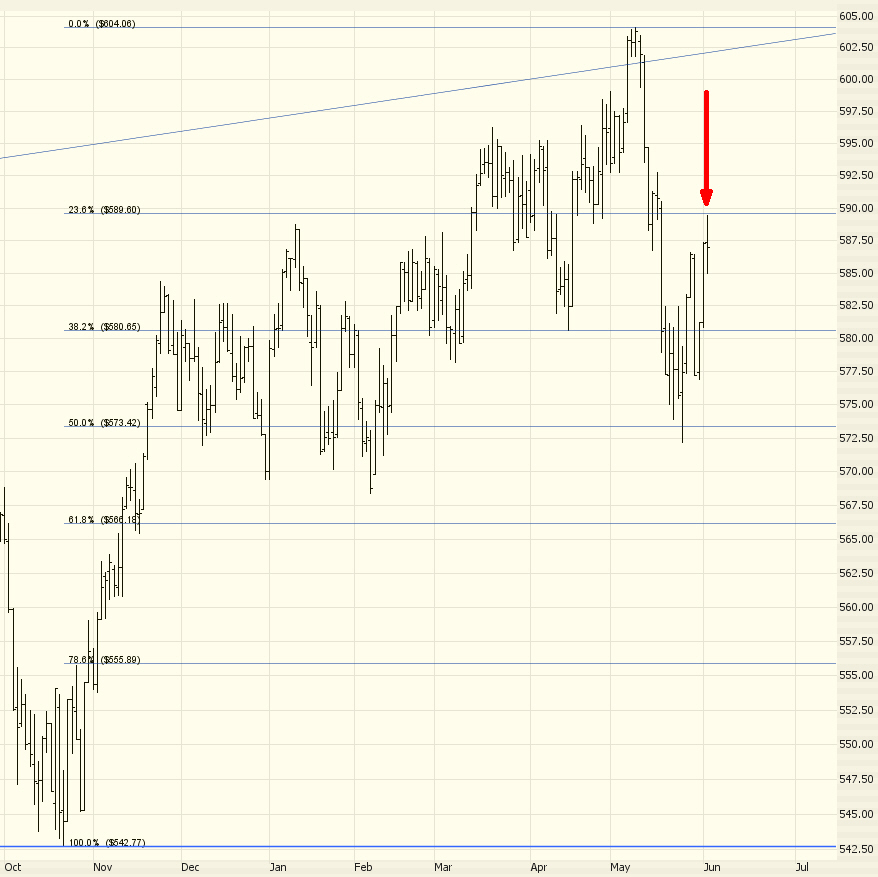
The Russell 2000 is a favorite of mine right now. Its graph shows a rounded top, to which the price has retraced to resistance. Notice how this rounded top differs from the multiple saucer patterns earlier experienced within this broad ascending channel.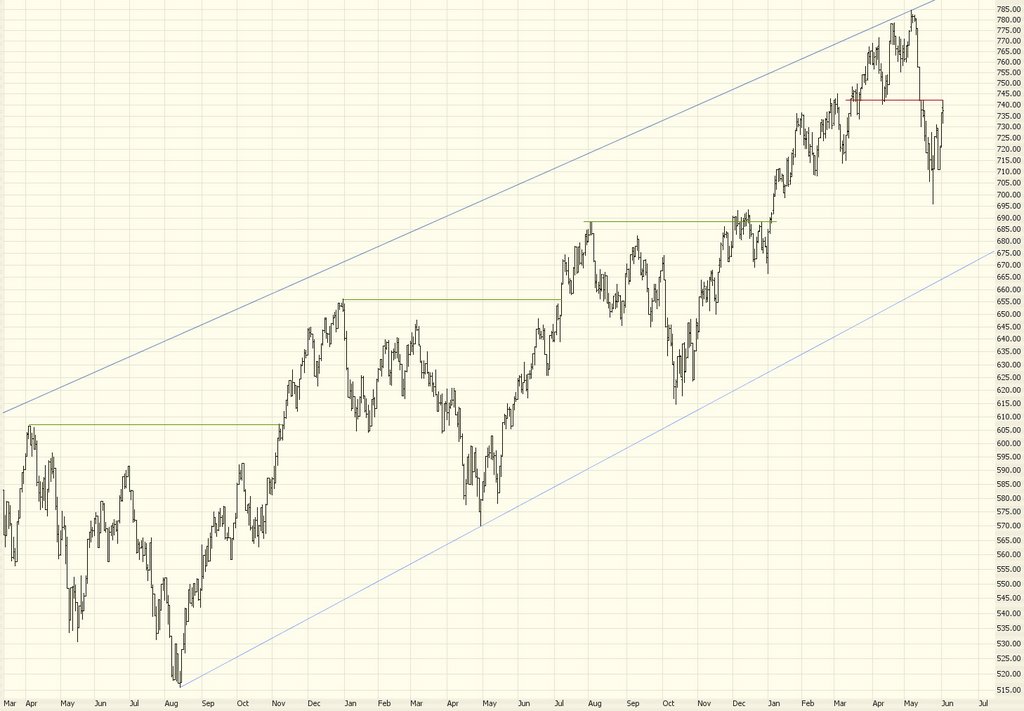
A couple of specific stock short suggestions. Here's Burlington Northern, which hasn't finished its head & shoulders pattern, but it's worth tracking.
Also there's old favorite Health Net, which had been terribly weak about a month ago and has recently been quite strong. It's getting back to a level that represents very good risk/reward. Pay close attention to the Fibonacci levels, illustrated here.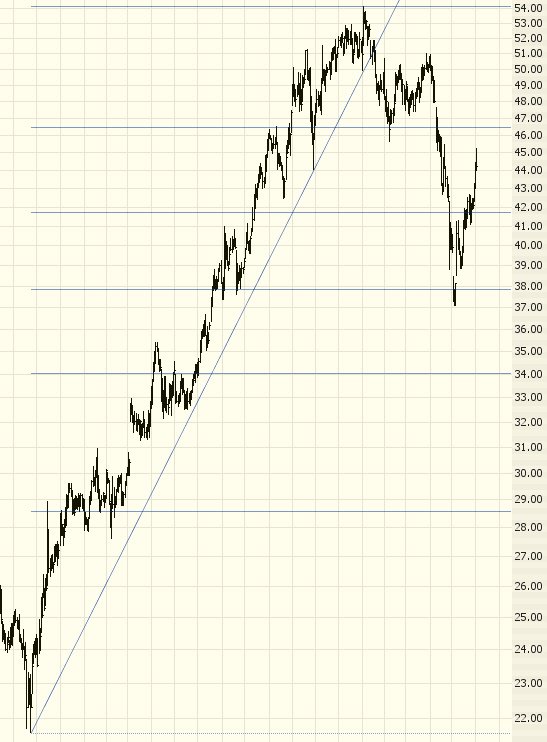
2 comments:
Ok, in the last little while, I have lost all tolerance for reading news. HOW is it that payroll numbers were so bad, and yet, it didn't crash today? Everyone is talking about if it was too high = more interest hikes. Too low = recession. Just right = we've hit some sweet spot in the economy. Is it becuase of oversold conditions, or because everyone seems to think that recession is ok that was why the markets didn't crash today?
no sense. but im betting hard on housing, at least I can see numbers, and that makes sense to me. Puts across the board.
Check out MTH - I use weekly charts for trading, even though short term, it could bounce a little bit, but its near a pretty good resistance level.
Interesting week - becoming the norm rather than the exception. The weekly candlestick on the INDU suggests the market is going to rise next week.
Looking back a little I see that we were consolidated at about 10600 after a breakout in the beginning of '05. The next breakout established a resistance at 11000 - we dropped back to 10200 (about 50% of the way to the near term low at 9800 and then reestablished basing at 10600. In October we broke the 10600 resistance and reestablished basing at 11000. In February we broke out above the 11000 resistance. In the past 3 weeks we retraced about 66% of that to 11150 or so and now we are poised to break out again. I think we will see 11600 before the end of the month. After that?????
Does that mean all you bears are going to go broke? Nope - just means it will be more difficult for traders such as myself to make a buck.
Post a Comment