
A Few Juicy Charts
Between my recent mentions of teenage sex, "juicy charts", and Abby Joseph Cohen, you may all thing I'm sex-obsessed, but it's not true. My true self returns. Here are some lovely short ideas for you.
Boeing (BA)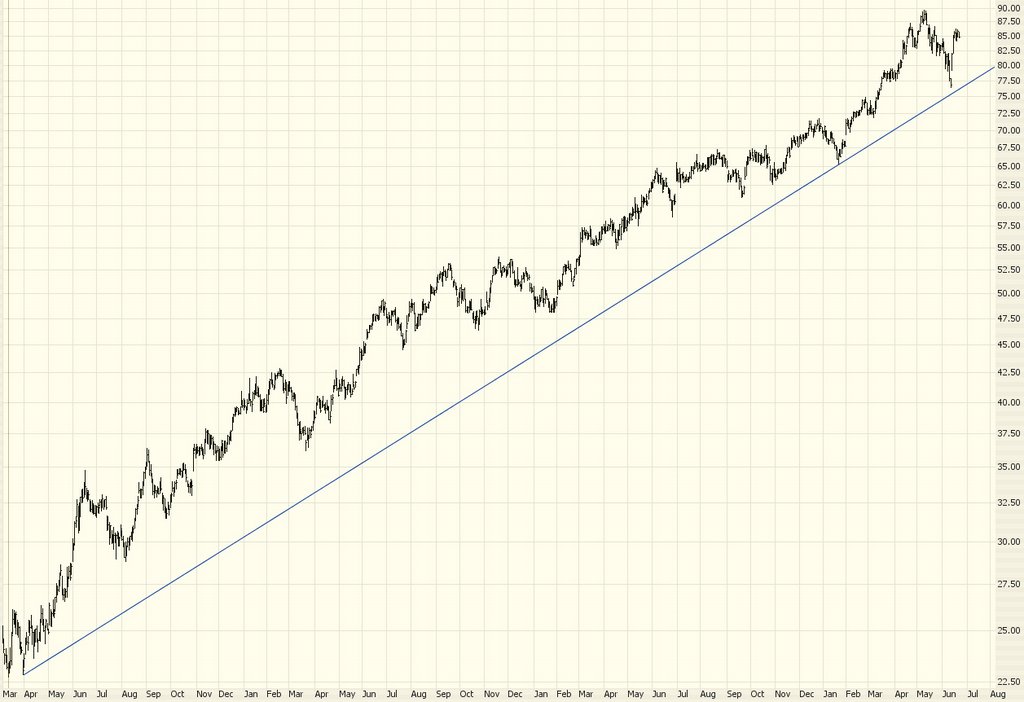
Bear Stearns (BSC)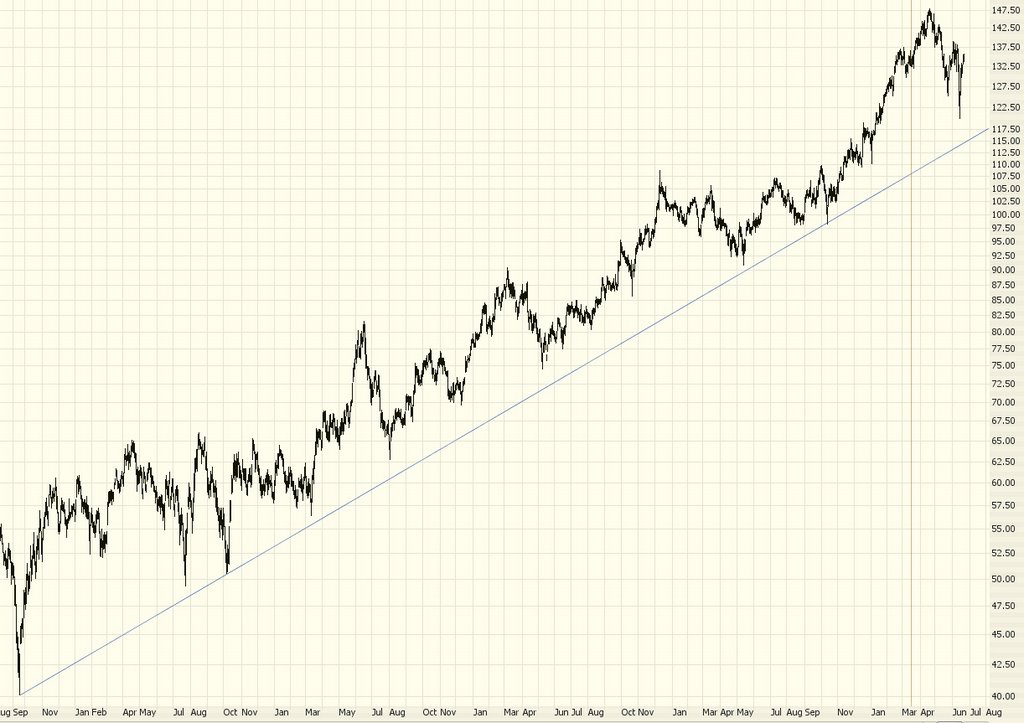
Cummins (CMI)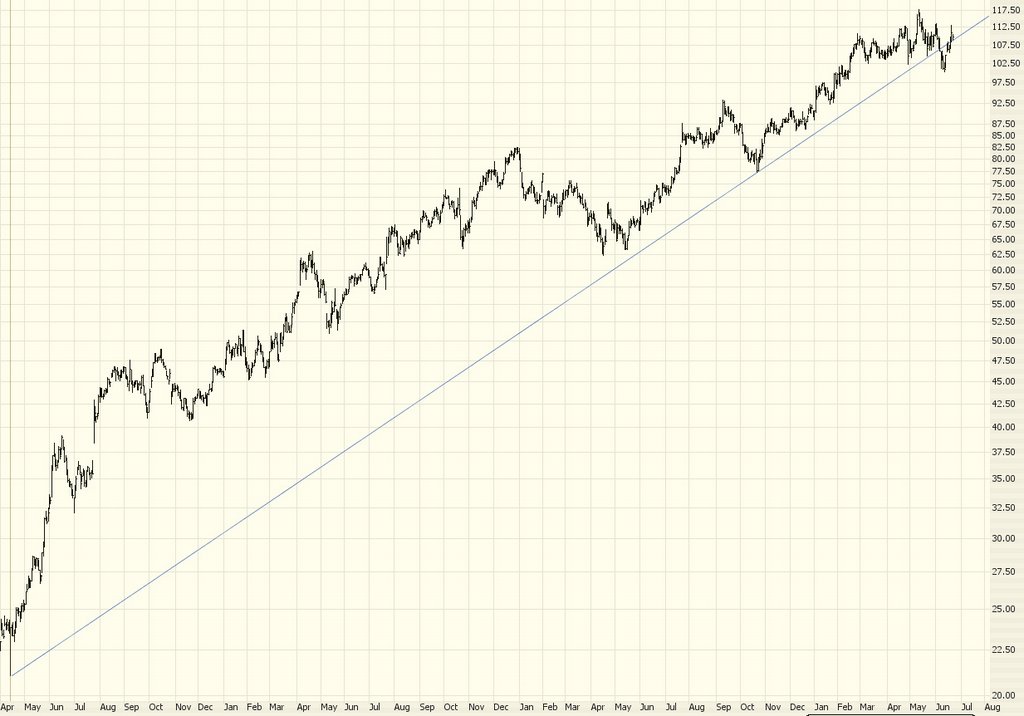
Massey Energy (MEE)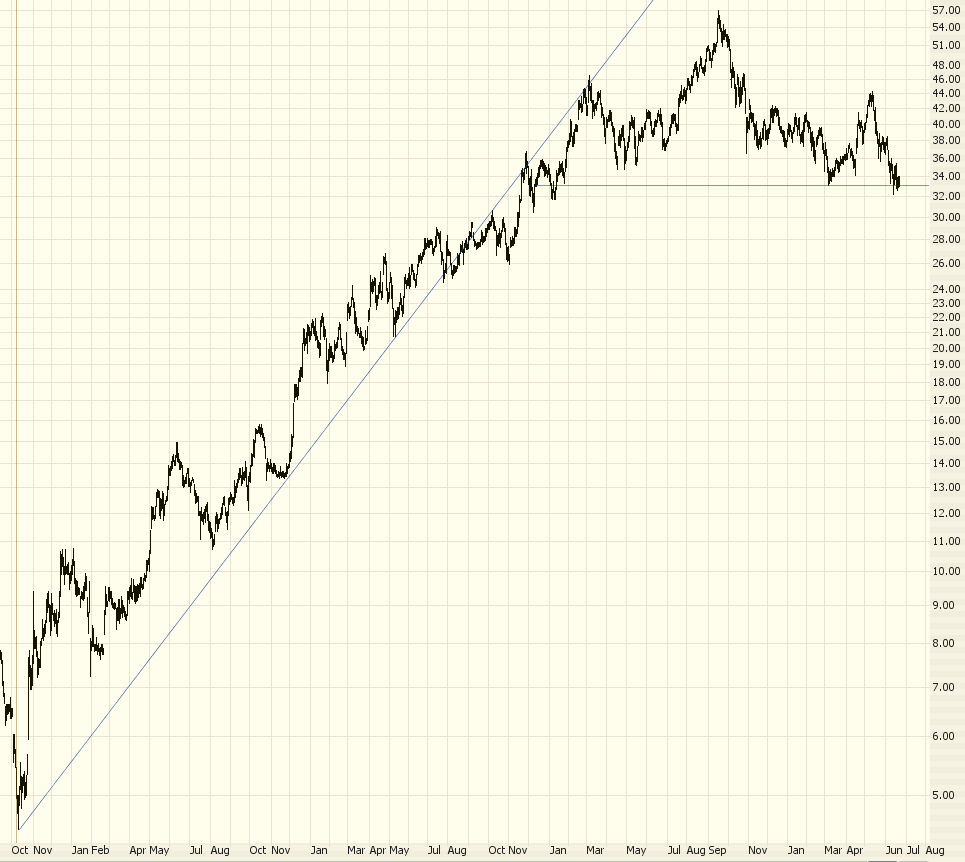
Sears Holding (SHLD)
Simon Property Group (SPG)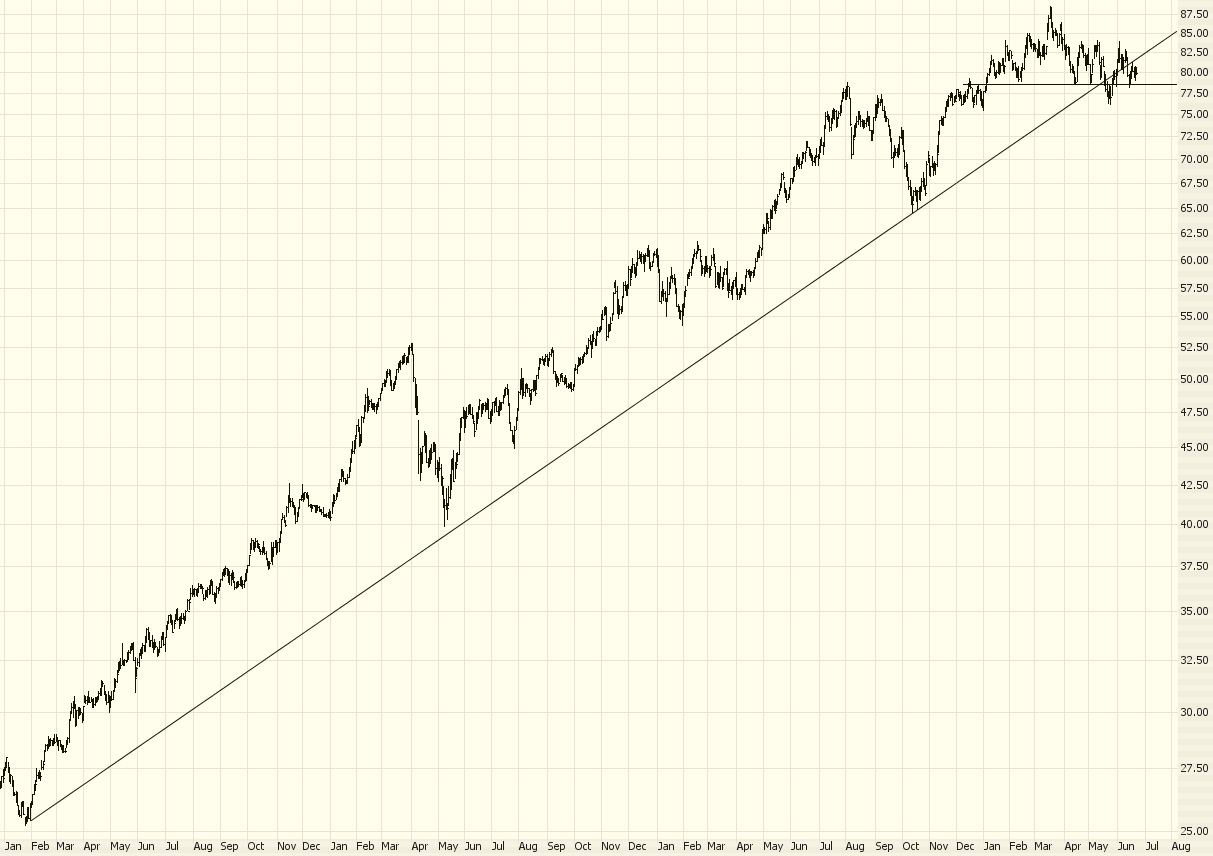
Union Pacific (UNP)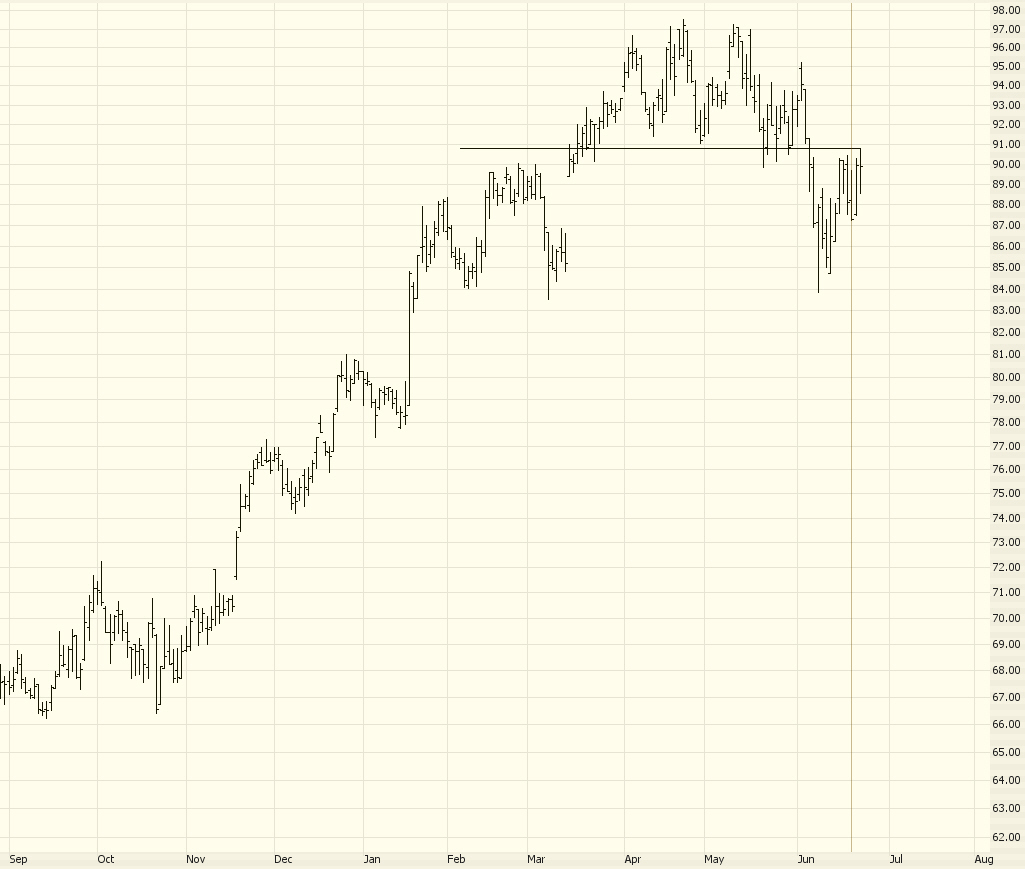
As always, click on any image to see a bigger version. Except Abby's, which will cause a recursive deletion of all your files.
42 comments:
Tim, I like your charts. What software / service do you use?
Tim is the founder of prophet.net and uses the charts on that website.
check out the new bear profund ETFs at the AMEX site, The ticker symbol for the short fund for the DOW 30 is DOG. That is hilarious! What they need is an Ultra Bear Fund for the indices that is optionable as well.
I see where I made my mistake with my drawings on the DJI - I was looking at the small (1-2 week) picture, not the bigger one (3 months or even years). Another rule that I forgot to apply in my analysis. Definately need to write them down and review them...
Look at the big picture to obtain a better understanding of the details of the small one within.
Tim: I was just now pondering about trying to make my lines more accurate, and if it could be possible. It is great to point/click to get a rough idea for me.
I was wondering if there was a way that one could input date/time/price for two points and have a line drawn out with that information with an option to be indefinate or set to a finite date/price?
Or have a pop-up ask if the user wants to go with high/low/open/close for the moment that is selected.
Hi Mark,
Well, the product I'm using (unreleased: ProphetCharts) makes drawing objects really simple, because it "attracts" the line anchor points. And you can modify the drawn objects once they are laid down. I'm a stickler for accurate trendlines (e.g. accurate to the penny, and never violated between the two points). ProphetCharts makes it really simple.
- Tim
Hi Tim
2 questions.
1. Do you have a timeline for the release of ProphetCharts?
2. looking at the Shld chart it looks lie a cup and handle. Now after what I thought was a handle it made a breakout attempt that failed. It also now may be on the verge of an island reversal(not yet confirmed). OK now the question. Can the cup an handle be considered a failure at this point because it made that higher high and then broke below or would we it still be in the handle stage?
I don't really use this pattern often so it would be nice to hear your thoughts on when we could call it a failure.
Cheers,
Andrew.
You should Put GM on that chart once it passes $29+
Tim - Do you think you could put up a note about IDCC. I'm curious what your thoughts are on it, short-term obviously. Thanks, Matthew
question about shorting. When is it that you have to cover your short before you are "forced" to cover by a short squeeze. For instance if I short SHLD at at $150 and it moves to $165 what are the chances I will be squeezed out of my position and be "forced" to buy back my position at a higher price?
Tim, thanks for the response. That is another option I thought of but wasn't sure how to word it. Magnetize the line and points! Then make it glow like a neon light! "This way folks!"
I want to thank the person who pointed me to the options training site. My head is swimming with information, but it's starting to make great sense in a rather complex, yet, "It's only as hard as you make it," way. I always did better at complex math problems than straight-up adding. I like. I like a lot!
Anon, that is probably why Tim likes option puts as opposed to shorting stocks. I just did a crash course on options and it really makes a lot of sense - especially if you have an idea the wind is going to blow down! It's even better if you know exactly when it will stop.
mark, can u mention the options training website u are talking about. I want to learn more about options as well. Thanks.
never mind, foubnd the post...thanks.
options training website: www.888options.com
try the online classes
Tim (or anyone else with an opinion)--
Two big questions.
1) Why do you draw trendlines touching just the price extremes? Some say trendlines should be drawn through congestion areas, ignoring the more panicky extremes. I have noticed that when I draw two trendlines on the same chart, one through price extremes, the other through closing prices, they both seem to be valid, but it creates a lot of confusion regarding proper placement of stops, and calculating my chances of better entry points.
2) I am using Prophet Java Charts through my Scottrade account. I can't save trendlines to use the next day. It would be so much easier if I didn't have to keep redrawing trendlines every day (also, would make me less susceptible to fudging trendlines to fit the current situation). Why can't this be done?
any reason for the sudden surge?
BTW Tim, nice calls on long plays. both DD and PCU are on the rise.
brian, are you using the JavaCharts, or the ChartStream? When you set up an account (even the free one), JavaCharts will save your information.
For papertrading options (simple long puts (bearish) and calls (bullish), but no writing options at this time - working on it though), you can go to: simulator.zacks.com
Tech stocks got a 1% rise due to some blather from Nokia and Qcom about their cost-cutting efforts.
Doesn't affect the broad market, though, as % of stocks in a downtrend still outweigh the % of stocks in an uptrend by almost 3:1.
It seems that the market is hanging on by the skin of its teeth right now, trying to lure in new money. But I see the majority of the big buyers waiting for next Thursday's news. If it's a 1/4 point hike and the commentary isn't overly hawkish, then I suspect the market will go into rally mode.
However, it is more likely that we'll get the 1/4 point hike and hear the same story about "waiting for more data" before making their decision in August.
As I predicted back in early April, the market will be "soft" until August. Plenty of long opportunities and some shorts along the way, but no REAL conviction either way. I also suspect that the preponderance of "good news" from earnings season coming up will help push the Dow up over 11,250 by end of July.
Which stocks to buy? I have no idea. But it seems that energy could be a good play, along with some healthcare stocks.
Eeek, so many questions! I'm going to try to go through recent posts and get answers to you guys........I've got to find a better way to do this, since I really do want to answer the questions people have.
is that a mini h$S forming on the qqqq 15 min intraday view?
Mark, I'm using Java Charts. But I'm using through Scottrade (it's the charting software they provide through their website). I can save charts for the short term. But if I log out they are lost, so I've just been making PDF's of charts every day (and it's getting out of hand the number of PDF's I've got). I'll give a try on the website.
John Wheatcroft--Looks like you're winning on MRVL so far, but so long as it doesn't break above 40 I'm still looking for downside. Out of curiosity, you said you were trading based on their announced split...what is your rationale for that? Is there a high probability that stocks will rise between the announcement and actual split date? I would think that in a weak market like this, and with the stock having taken a tumble, a split would just cause more excess supply, and who would be buying before that. But that's just my thought...I don't know historical stats on this.
Many stocks will rise into a split especially a 2 fer. I haven't done a study on it but the high volatility high beta stuff usually does. MRVL, despite the options backdating crap, is a pretty good company also and that helps.
I keep tight stops and if they don't I don't worry about it.
After they split you might have a session or two to unload at a little bump otherwise they most often go down for three or four sessions or so. I usually unload a day or two before but that's only because for me to hold any of this crap for more than 3 weeks is a lifetime.
Sometimes, depending on the stock, you might want to reload after the dip and catch a quickie day or two rise. Seems like after stocks split it takes them a bit to find their natural level.
Does anyone see any reason to go long or short on anything right now, if you're NOT interested in capturing 2-3% moves?
My available cash right now isn't enough to trade with to make those 2-3% moves worthwhile. And lately, it seems that my picks have been moving against me more than 1%, so my stops would have been taken out anyways.
Seems like we're stuck in the mud until the 29th.
-Tony
Next week is key, we could be back down below 10800 on the DOW and below 2050 on the nasdaq if investors do not like what the federal reserve has to say. Expect them to move rates higher by 25 basis points. This week was kind of wild especially on wednesday with the markets in rally mode. Ill admit i was nearly 100% cash this entire week and missed out on any gains, could have made anywhere between 3-5% if i had the courage to buy something in this market but instead im waiting ever so patiently for June 29th at 2:15pm when the policy statement is released. Im thinking an easy 150 swing in either direction is possible on thursday afternoon for the dow. Also earnings season is just around the corner so we will be hearing some preannouncements.
Mike
"Next 3 weeks I see a 500 point down draft."
Cristri25 - why? And if the fed does boost by .5 doesn't that pretty much mean game over for the fed? They really can't go much higher because they already have to start reducing by October.
And if we do go back to 10800 next week what does that mean for the future? Folks like me will just take that as an invitation to buy em up.
I made money today - I hope you all did too. I'm currently holding gold and oil for the weekend (I try to do that every Friday because nothing will happen over the weekend to make the world situation better but it could get a lot worse). Also my spec play in MRVL but to be honest that is getting a little boring. I expected it to go to about 55 - 56 and it seems to have found a top around 51 - 52.
I also grabbed up a small position in GM and took some XLI on board in anticipation of Monday before the Fed meeting. I'll be flat on Tuesday afternoon for the rest of the week.
Next Friday I'll reload the gold and oil.
Another bad day Friday 23 June. The live Dow movements these last 2 sessions in particular are worrying for a bear. There just isnt any real strength, but all the time there is a niggling resistance to any significant fall. Ok the index has closed down for both sessions, but it really struggled. More to the point todays bad output figure actually caused the market to RISE. Why? Because now each piece of BAD data is viewed by the bulls as increasing the liklihood that this will be the last rate increase if the economy is seen to be weakening in different ways. So while we all agree that data is bad and the market should be falling, that isnt translated into a significant downwards plunge. I reckon we could be in for a market RISE after the rate increase - I would expect it to be a great amount, but enough to say goodbye to a proper bear market........thoughts anyone? Time will be my judge
I don't know about the H+S on the QQQQ, but I do love the doji on the QQQQ taht formed today.
beauty.
macd starting to roll over, I am starting to feel like its pre-May 11 all over again.
You're right. Any bad news is treated as good news by the market, because of the lowered risk of an increased Fed Funds rate.
The irony is, if the economy is already showing signs of a slowdown, then why would businesses (or their stocks) benefit? It makes no sense to BUY stocks when companies are saying that business is slowing down.
Commodities are still the play this year. Gold and oil will continue to be volitile, but at least there's a fundamental basis behind them. When the Fed stops raising rates, then gold will move up. There really doesn't seem to be any question about that in my mind.
Use TA for stock purchases. There is no fundamental analysis anymore. It's all just smoke and mirrors. Know which sectors are grabbing the headlines and buy and sell based on TA. Right now, oil and NGas are in play. Gold is, too, but to a lesser extent and the recent pullback has kept most buyers on the sidelines in shock. For gold to really make its move, we need to get those speculators back in the game, which will take some time.
-Tony
Tony, you are wrong about gold - the funds and big guys are reloading. They see the same thing that I do the only place a spec can make any money is in a spec market.
Still don't know if any of you have gone over to trader-x's site. He and his friends do the kind of trading you guys want to do. They just play the market as it lies not waiting for some magical moment in June.
I play their way too except most of them take their profits daily and I usually ride overnight. Brett Steenbarger validated that approach the other day. Said that holding overnight is better than day trading.
We'll see what happens with gold, but it doesn't sound like you've done your homework on it, quite frankly.
The "Big Guys" aren't reloading, really. There has been some technical buying and short covering lately, along with a very small amount of physical acquisition. Gold is rising against a strong USD and a falling Euro. What does that tell you about its fundamental behavior? And don't start throwing "tensions with Iran" into the mix. Go back to 9/11/2001 and tell me what happened to gold's movement. That's right: nothing.
Anyway, I don't want to get into a debate, but I've probably read more about gold in the last year than anyone else here and my money isn't going into gold right now.
There's still another shoe or two left to drop before the REAL buying opportunity presents itself. Could I be wrong? Of course. But every technical and fundamental fact that I've seen points to a better buying opportunity down the road.
A quick bounce off the 200-day isn't the "last" buying opportunity for gold. There will be others this year.
BTW, I'm not looking to make a quick 2-3% on gold, so if that's your style, then we might be thinking differently about the situation. Good luck.
-Tony
I think if gold gets past 600 once again it could rally...however with the federal reserve raising rates next week this could push gold down the the 560-575 area. I would be a buyer of gold on anything below 545.
Watch the $HUI for 260-270 and watch $GOLD at $540 ($545 is good as the previous poster mentioned).
If those come to pass, that would be a good buying opportunity.
Keep an eye out for the BOJ liquidity situation.
No debate - you have your opinion - I buy the miners regularly. I will continue to trade them as long as they make me money. 2 or 3% a week on my basis is a comfortable living.
Other than my wedding ring and a couple of fillings I have no physical gold and never will. To me it is only a vehicle to make a few bucks every week. It doesn't matter if its gold or gas or cadilacs - just something volatile that I trade.
My only investments are my health, my wife of 40 years, my children and theirs. Beyond that everything is for sale.
My only purpose in writing these notes is to show other people that a person can make money regardless of the market. Sometimes it is harder than others but hey if it was easy everybody would be doing it.
Good enough. Thanks for your thoughts, John. I'm definitely not good (or lucky) enough to get 3% per week in this market. Most of my trades are position trades for 3-4 months, anyways. And I don't see any real opportunities opening up just yet for that length of time.
BTW, the trendline down across the peak prices in $GOLD since $720 is still intact. At this point, another close above $590-595 would break the trendline.
-Tony
John Wheatcroft
you said "2 or 3% a week on my basis is a comfortable living."
That is very hard to believe. Everyone has to have that losing trade here and there and a month or 2 where returns are down. I would say maybe a handful of people can do a constant 2-3% a week, if you can I would like to know how you trade and what you trade. You must have some trading account to add to a position that turns against you.
Who do you use for your online broker? Do you daytrade?
Joe
cristri if the fed does 50 basis points without a pause this market could fall 2-3% without a problem.
.25 is already priced in anything higher and the markets will have a tough time digesting this.
Joe
cristri
fed goes 50 bp and gold could fall 25-30 dollars in a day.....
joe
Lot of good thoughts in here - but to address some questions. Yes of course I have losers but I cut my losses very quickly. If I'm down a couple of hundred I don't go down below that. I trade in 1000 share blocks (or more) thus I only play high volatility, high beta, high volume stocks. I trade mostly in the $15 to 50 range because I get the most return for my buck there. (did you know that there are over 3400 stocks in that range). And I seldom if ever allow a trade to run to the end - if I see my profit target I take a profit target. And my profit target is often 50 cents or a buck (I don't bother with percentages - too much math). I daytrade sometimes but do more overnight trading - I.E. buy late in the day and sell the next morning on the 9:30 bump. (Brett Steenbarger did a study on this just this week and validated the approach).
I also study the arcane every day - did you know that on Friday of all stocks between $1 and $500, 3640 went up and 3635 went down. I find that fascinating. Another factoid = Friday close 3185 stocks (in the above range) were above the 200 day moving average and 4620 below. Also on 13th June the number above was 2855. If you don't know these things and you want to trade you better go find them out.
And when I first began many years ago I went stone broke several times. I've paid my dues. I have learned to watch the 10 and 15 minute charts and am capable of picking a short term bottom using candlesticks and moving averages. Anyone can do it - it just takes practice and patience.
The trend of the market is up not down. Proof - go to stockcharts and pull up a daily chart of INDU (or DIA) and overlay the bollinger bands on it.
Then switch to a weekly view. It will be clear as to the direction of the market.
If you are interested in a 3 to 4 months or so time frame that makes the job even easier. Go to Tim's commercial site (prophet.net which I use when scanning for gap-ups gap- downs) and pull up a snap chart of JNJ (for example). Use 5 years and monthly frequency. With one glance at the chart try to guess where it will be just 3 months from now. (In spite of recession etc and JNJ is selected because it probably will come in with good earnings this period - so much for fundamentals). Looking at JNJ, a stodgy old timey company that makes baby powder of all things, you will see that had you done this in July of 2003 you probably could have bought it there and even if you sold it today you would have made about 28%. You wouldn't have needed anything more than a set of bollys and some candlesticks. (Have you read Bollinger's book? You should).
If you are looking for a longer term - go buy mutual funds and go back to doing whatever it is you do normally. Of course read Tim's blog daily.
Sorry for the diatribe but I felt that my bonafides were being questioned.
And Thank you again Tim for both this great Blog and your wonderful commercial site.
I looked at xle on the weekly chart and what I see is a hammer coming out of the 50 DMA and an issue way above its 200 DMA. The MACD looks as if it is going to roll over up (look at the divergence between the MACD and its signal line). When I put bollinger bands over it I see that the last weeks tail tagged the lower band.
That said it is possible that oil will be going down but until it does don't bet against. There a lot of bad stocks out there that will be going down soon enough.
BTW HANS is going to split 4 for 1 on 7 July. That might be a good buy for a quick buck 2 or 3 days after the split.
Brought Put on RIMM friday, John, what u think of this chart
RIMM
Took a look at RIMM (I don't like RIMM nor do I trade it in either direction) -
I put it up on stockcharts sharpcharts which I prefer for this kind of analysis (sorry Tim). Look at the week of Feb 13th and see if the chart pattern you see there reminds you of anything. That's what I think is going to happen.
The MACD line is below 0 and that generally accompanies a bottoming formation. The time to have put the put on RIMM would have been when the MACD was up over 4 like in the middle of March. Look at the history - every time it goes over 4 it's like a waterfall. And every time it goes below -2 which is where it was late in May it ascends.
I wouldn't have taken that trade - it might work out but time doesn't seem to be on your side. But I hate RIMM and if it drops like a rock next week - great!
A lot of people ignore the fact that the MACD location coupled with the Bolly's is probably one of the finest methods of analyzing a future direction. I like two things - extremes and ice cream. (Well sex too) but back to the subject - Extremes always mean a stock will revert to a mean. Using the Bollys we know that the mean is the 20 SMA. So if you have an extreme such as -2 or +4 you can be pretty sure it will be dropping or rising back to the 20 period line. And as usual it will overshoot by some amount.
But what do I know - nada - Number one rule folks - Nobody knows nothing. Number two rule whether it's a putt for a $20 Nassau or a $500K bet on the market - trust your instincts. If you think it's bad - it is.
Also try to learn something new every day and keep your mind open for good ideas.
if you follow XLE check out PXE its a powershare ETF that trades nearly in step with XLE. PXE seems to always bounce off the 16-16.25 area. PXJ is another one, always seems to be a strong buy under $18.50.
Jim
Post a Comment