Indecision
For those of you who didn't read this morning's post, please check out The Chart Project, which is a little something I've been putting together. I'd love it for some of the readers here to contribute.
The market is in a pretty serious state of indecision. It could be just gathering its breath before it makes an assault on Dow 14,000. Looking at the Dow 30 over the past few months, however, it seems the technical indicators point to a reduction in prices as opposed to a fresh surge.
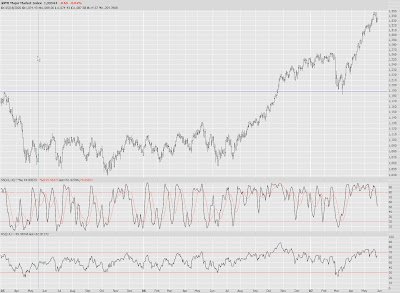
The Major Market Index ($XMI), although shaped differently, seems to present a similar argument. Especially if the old saw "Sell in May and Go Away" holds true.
The head and shoulders pattern, a favorite of mine, showtimes holds together and sometimes doesn't. Akamai (AKAM), mentioned here often recently, seems to be moving in accordance to its pattern.
Real estate stocks, on the other hand, seem to have violated their recent head and shoulders pattern across the board. Essex (ESS), shown below, is a good example - as is the much broader IYR. This doesn't necessarily mean the bearish pattern is moot. But it definitely diminishes its credibility, since prices have soared above the neckline.
Symbol ALB seems to be forming a nice trend change as well. I would say this is another head and shoulders pattern as well. They seem to be common these days.

11 comments:
Tim,
What a great internet advance with the chart project ...thanks from all of us who visit your site ..it is a real bonus for all who love the markets. Are only decision is how much and when to take profits ..we also feel like there is some indecision but the constant short interest and people doubling down on puts because they think a recession is near is just keeping the BULL STOKED !!! We went with a new portfolio and took healthy gains (10 bucks in POT) and our list of regulars that can be seen on the blog. I am worried about the next 8-12 sessions as even the best of news may not be able to get us over 1531 SPX but then again it may turn to support before we know it !!!
Thanks again for the intellectual ability to give us mortals those great CHARTS !!!!
Tom
http://www.ttthedgefund.blogspot.com
Bulls just won't quit. Every dip is bought. Can't fight this liquility. I think the best that bears can do is to short the occasional brief overvaluation and companies with accounting frauds.
I agree, but there's just no real supply here. Beats me why they're not selling, but they ain't. Very werid (at least to me ;-)
Its called a parabola, news doesn't matter, earnings won't matter...just the final straight up phase completing is all that matters...I have only seen a few in my 26 years, but somehow they complete and then the real fun begins.
Yeah, the SRS was clobbered today, but it just looks like an ABC correction of the recent rise. We'll know if that is the case very soon as the pattern appears complete. There is a massive amount of jiggery pokery with real estate, especially housing, but whatever BS the PTB concoct, the game is over, and the trend, despite days like today, is down down down..
so many H&S...doesn't that lead to the market turning? surely hope so.
I don't think today is what the bears had in mind. There is also a lot of news to hurdle this week. The bulls seem to have the upper hand. They have support of a major trend (granted it has seemed to pause in the very short-term past), if the info is weak then the market will rally on hopes of a rate cut, and if the info is good the rally will continue because the economy is in good shape and growing. The bears just haven't had the ability to swing news their way. Almost everything gets turned bullish.
There's more bears than I would have thought, according to this.
http://www.forbes.com/2007/05/29/liquidity-etf-funds-pf-etf-in_tt_0529trimtabs_inl.html?partner=email
Both funds and individual investors are bearish right now. Seems like there's more downside than upside potential right now, but using sentiment as a gauge maybe we're not due for a correction just yet. The article definitely surprised me...
thatta boy. take your shorts and shove em'. Keep shorting the greatest bull market of all time is finally here.
everybody here stopped out yet? I'll admit it, I am.
"it seems the technical indicators point to a reduction in prices as opposed to a fresh surge."
The examples you provided to back this comment up are not convincing for a broader sell off. Oh but I forgot, you are looking for a downward movement in stocks and will find any pattern/indicator to validate that.
Post a Comment