
The Voice of Reason
Another nearly 200 point rise in the Dow today. The main reason being given was a company was being bought. The ticker symbol should be BFD, but it's HCA. Honestly, what on earth does this change about the market's prospects? Pfft.
In any case, I was going to title today's entry "This is Not Good" or something like that, but once again, having looked at my charts, I'm not worried. Sorry, I'm just not. Chart after charts just screams "sucker rally" to me, and when I look at the long-term (we're talking decades, people) chart of the S&P 500 or the Dow, it's got bear written all over it.
Oh, before we go any farther, a tip of the paw to everyone's favorite perma-bull, hurricane5. One of his most fervant recommendations (the top one, I think, with a target price of a million bucks a share or something) is NTRI. It's getting slammed in after-hours trading.
Back to reality. The Dow Jones 30 has just two numbers that count right now. This is simple: if it breaks below 10,660, the bears are going to own the market. If it breaks above 11,150, that's going to cause some medium-term damage to our evil plans for world domination. I think the buying mania is just about tapped out. But I've been wrong before!
Looking at the intraday S&P 500, it didn't get above last Wednesday's high, and even if it does, there's still a bit of play before this gets worrisome.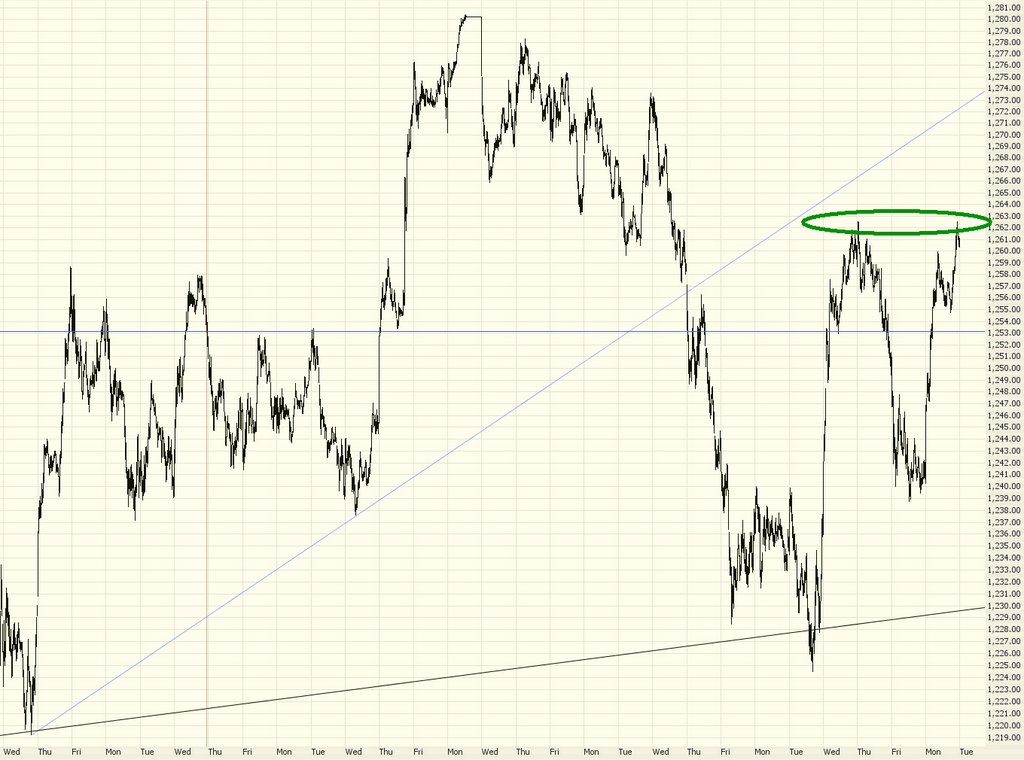
The daily chart of the S&P is the same tired channel you've seen for a while. We're still in a nice succession of lower highs and lower lows since the May 10th peak. Let's keep it that way, shall we?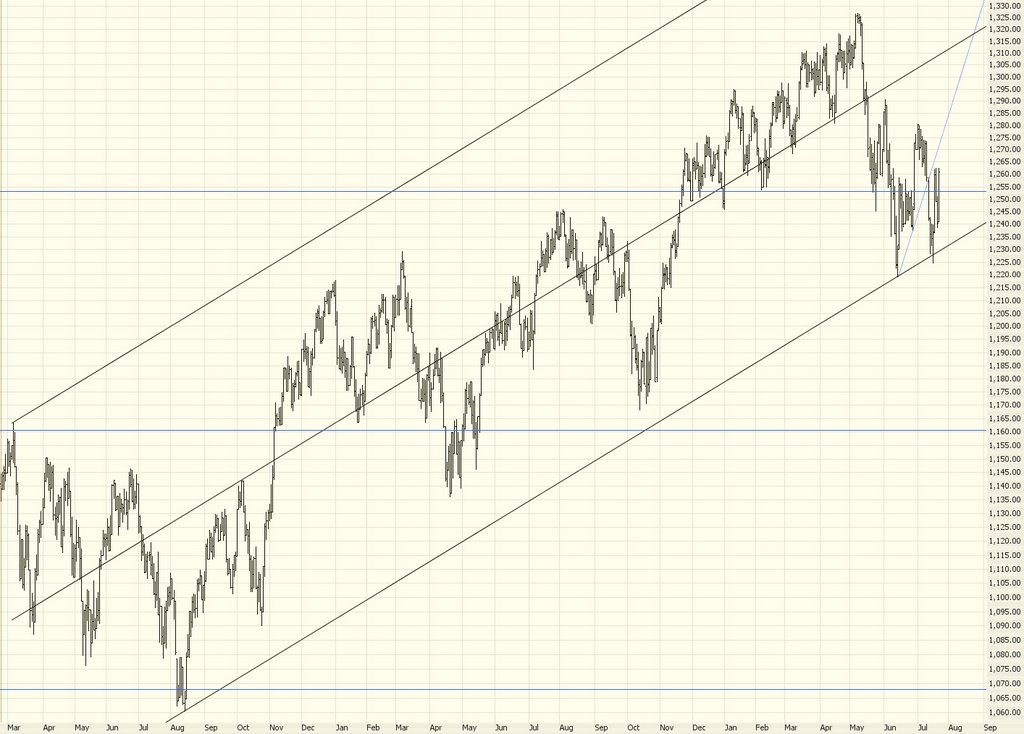
This final graph is really what I was talking about earlier - - click on it to see a bigger image, stare at it for a while, and try to convince yourself this is a graph that's going to shoot higher. Just try. You can't, because it's not going to do so. History is telling us it's time to head lower. A lot lower. Just watch.
51 comments:
but fcx staged a big reversal today..so bit worried about the upside move..
Long-term charts look bullish to me. We are at critical support in both the monthly and weekly S&P, but so far this bull is very much intact.
NB the first two charts:
http://stockcharts.com/def/servlet/Favorites.CServlet?obj=ID369857
Tim,
Here's the deal::
The sponsors stepped into the batters box today reached down and adjusted their cup..
If you've got a 100 mph fastball ..then wing that baby and the only thing you"ll be able to say is "Goodbye Mr. Spalding"!!!!!
Tell your readers not to step in front of this train because it makes better sense to collapse the market from Dow 12000 than from current levels.
A quick look at the 10yr./monthly of the Dow reveals a potential inverted Head & Shoulder and if the Dow breaks above 11,600 then the target is Dow 15,000.
I love a good short the same as the next guy but doesn't it make better sense just to take what the market gives as oppossed to many a restless night concerned about losing your ????.
As I said Friday .."I just pull into your driveway and blow the horn ..I don't get out and come to the door to meet your parents..
A word to the wise .."Don't play hot-potato with arbitrageur, cause he'll take a 1st. degree burn in the palm while looking you straight in the face and not blink an eye".
In addition he uses an abacus instead of "Big Blue"!!
We had 3 up days last week on increasing volume and this hadn't
happened sense Mid May when we had three up days on decreasing volume?
Look for more of the same upward bias tommarrow and just take what the market gives .
(Not) Always a Bear
P.S.
I am a survivor of multiple lock limit days on OJ & Beans..again just take what the market gives!
Looking at that 100 yr. chart I see one potential pattern in the making....a gargantuan double top. It may not happen, and for the sake of my parents' retirement, as well as most of this country's, I sure hope not...I'm a bear, but not because I want to see the market crushed. Because measure the price target if that pattern were actually to complete itself...You get S&P 50!! Yeah, I said 50!! And that's measuring the high as 1,500. Measure from a high of 1,575, and you actually get S&P -25. Who among us truly wants this degree of carnage?
Somebody should put together an intervention for Hurricane before he goes totally broke.
I think the dow tops off at 11250-11300 nothing higher than that, if it goes back to 6 year highs I would be buying puts and shorting every index. I do see another rally before the next big drop but no way 6 year highs. I hope many arent thinking 6 year highs. IFFFFFFFFFFFFF we do see 6 year highs the next drop from there will be harder and quicker than this last drop.
<<...You get S&P 50!! Yeah, I said 50!! And that's measuring the high as 1,500.>.
So, you're expecting a 96% drop in the S&P? That would probably put the GDP of the USA around the level of Somalia. I like to keep an open mind, but let's just say this scenario is somewhat improbable.
if the FED halts rates markets will rally big... if they cut markets will tank.
I should have listened to my gut over the weekend. It was telling me that the 2nd part to the rally we were expecting is to happen today or tomorrow.
Time for me to buy more DIA puts! :)
mark, you don't want to be long options as the market rallies, especially not puts. Implied vol will fall as will your option prices. Clearly this will have a big adverse affect on those long puts.
agree with costas unless GDP comes in really high to make the markets fear the FED or if it comes in really low prompting fears of a faster slow down,. it ALL about GDP.
OIL and GASOLINE at record highs ... THINGS are very strange right now.
The irrational gut-check -- says the market is still to go down. Yes, it may still go up a touch before going down. The DOW will hit 10450-10550 before the next options expire. Let it rise! I'll be here when it falls. Besides, it has come close to the 1-month high Fib. Where will it go now? Down.
Bouncing between the (or racing to the next) Fib's, what the stock market loves best! It will touch 10950 (or lower) tomorrow or the next day.
I have an intraday line from 7/18 that I drew Thursday that the daily high touched today. And another line from that same day that I believe the bottom will touch tomorrow or the next.
Things are strange only to those that don't understand. I still don't understand the future, but the past tends to make sense. And the future is based off of the past, only in a greater number or amount. So every day I'm grasping a better understanding of the future.
Great charts, as always, Tim! I think you're right on the money with your analysis.
But I just have to add my $.02 here. Today's rally was indicative of the huge point increases in the major indices, with very little volume support driving the prices upward. This is clearly a case where the sellers (in the absence of BAD news) just sat on the sidelines and waited for the low-volume buyers to drive up the prices. Rest assured, the MINUTE that some bad news hits the wires (or some warnings/earnings misses), the selling will resume in huge volume once again.
The real question is: what will drive the market higher, specifically to reach new highs? I mean, seriously, the true measure of the market's "health" is the P/E ratio, and what would make anyone think that the market deserves a HIGHER P/E ratio going forward than it had, say, 6 months ago??
I think it's pretty clear that the continual increase in the Fed funds rate, in addition to the persistent 0.3% core CPI readings, combined with extremely high oil prices, combined with the huge reduction in monetary liquidity over the last 2 months, makes for a market that's clearly OVERvalued at a 15 P/E. In conditions like this, you can expect to see a S&P P/E of around 10 before equities become a "screaming buy" once again. That means a 30% haircut on the major indices before the Big Boys start pumping money back into stocks again.
Sorry, but unless you're day trading (or holding positions for only a few days at most), then the short- to mid-term direction is clearly DOWN in my opinion. My intent is to play the market short, building positions SHORT (as you would LONG in a bull market) on strength in the major indices.
SDS, MZZ, QID, and DXD seem to be very safe investments at this point. Is there a downside risk of a 5% drop in these short funds? Of course. But in my opinion, there's another 15-30% upside coming in these ETFs within the next 6 months or so. There will probably be a rally in November (isn't there always?), but beyond that, the short side is looking pretty safe right now.
Good luck everyone.
-Tony
BTW, I didn't mean to say that there's a 15-30% increase in the ETFs, because some of those funds are double the indices.
So, a 15-30% haircut in the indices would be a 30-60% gain in the ETFs. Sorry for the confusion.
-Tony
'and when I look at the long-term (we're talking decades, people) chart of the S&P 500 or the Dow, it's got bear written all over it.'
Huh? Long-term chart definitely very bullish. Shorts have to realize that GDP rises with time and markets rise with it.
http://finance.yahoo.com/q/bc?s=%5EGSPC&t=my
I agree that the long term charts are bullish, but I think what Tim meant was that they're at the "decision point" where they could break down in a horrific manner and the market conditions are not currently favorable to a supportive bull run.
In other words, the market is looking at the current conditions (as I've described above) and the ultimate direction will very likely be a selloff, creating a bearish market for the next 6-12 months.
GDP is in danger of stalling, as the growth of exports in this country is falling rapidly. One thing that I've always been concerned about is the fact that the U.S. manufacuring plants in China will very soon be displaced by Chinese plants performing the very same operations with lower overhead costs, thereby eventually pushing the U.S. out of China and forcing the USA to manufacture its goods elsewhere, most probably at a higher unit cost.
Ultimately, price-inflation will dramatically outpace wage-inflation and we could quite probably see a significant recessionary period ahead. Once the cheap goods are gone, we're sunk. We've moved from a manufacturing/exporting country (1950s to 1980s) to a service-based country (1990s to present), which does not bode well for increasing GDP figures.
Again, just my opinion, but I tend to take the macro view rather than the micro view. Some people like to look at daily movements in the markets, but I think the macro trends are more telling.
Good luck out there.
-Tony
'We've moved from a manufacturing/exporting country (1950s to 1980s) to a service-based country (1990s to present), which does not bode well for increasing GDP figures.'
Tony, I think you're wrong here. Service jobs are inherently more stable than manufacturing jobs. The fact we've outsourced many of the latter will mean the labor markets and, by extension, the econmic cycle will be less volatile.
For more on this, and a fascinating head-to-head between a very eloquent bear (Marc Faber) and a very smart bull (Louis-Vincent Gave), I recommend reading the following:
http://www.financialsense.com/editorials/2006/0112.pdf
Thanks for your reply, but I continue to disagree.
Service jobs are not valuable in the global economy. They *CAN* be more stable, I will grant you that. But stability does not equal GDP growth or export strength.
I do agree that the economic cycle will be less volitile going forward, but mainly as a function of global support and strength rather than "home-grown" stability. Specifically, Japan, China, Russia, and Germany, as the largest holders of U.S. debt, cannot afford to allow the USA to decline unchecked. Notice how the general trend is to move AWAY from the U.S.-dollar denomination and also notice that the Euro is gaining strength while Russia and Iran are establishing bourses more geared towards Euro-denominated trading.
The real issue behind all of this is whether or not you feel that the "service industry" is more sustainable and more attune towards growth than a manufacturing environment. Personally, I think a service-industry-based economy (in a global market) is doomed to failure. My personal belief is that if the USA develops into a mainly-service-based industry, then the rest of the global community will simply ignore the USA, which would result in a tremendous depression from which it's very unlikely that we will recover.
I do like Marc Faber's work, and I read him often. But there are some points that I disagree with.
Thanks for your opinion. The diversity makes the board more enjoyable to read.
-Tony
Tony i bought some QID today, a little early though. I trade QID and QLD like they are going out of style. Sometimes I hold both when i start losing on one position to make up the difference, it has worked here and there, I try not to do it too often but those 2 are just tooo addicting. Looking to get into DXD at DOW 11250+ ifffff it does get there...
'The real issue behind all of this is whether or not you feel that the "service industry" is more sustainable and more attune towards growth than a manufacturing environment.'
I do. It's a very Marxist perspective, but I feel there is an inevibilty to economic history: societies move from agricultural to industrial to information econmies. As they have done so, they have created more wealth with less effort and over a shorter period of time. I forget who he was, but a venture capitalist said recently that the largest creation of wealth in the shortest possible time was a product of the information technology industry. There's no doubt in my midn that knowledge-based industries create more value with fewer people than manufacturing industries.
I've enjoyed the exchange of views also.
dash
This is not my writing, found it off of yahoo message board, found it interesting what do you think????
Dow Jones Proprietary Indicator: LONG
We have been saying from the June 14th bottom that the DOW Jones was in the process of putting a major bottom in, a bottom of intermediate term degree. It may last anywhere from 4 to 6 weeks. Continue to prepare for violent whipsaw type of action. We are in the middle of earnings season and the middle eastern crisis, all in the midst of a seasonally weak period. The swings could be large.
Lets lay the facts out there:
1. On a more intermediate term basis, the DOW has made 4 successful tests of the 10700 area which served as the high end of a 6 month trading range that the DOW was trading within over the last 6 months of 2005. Once heavy resistance areas are broken, they act as support.
2. Our proprietary indicator double bottomed. This has only occured 5 times since 1982. Incidentally, each occurance provided at least a 10% rally.
3. We are seeing all time highs in the cash flow into Rydex bear funds. This is a mega contrarian indicator and has called the last 3 major bottoms in the DOW JONES since 2003
4. Put buying has gone to extreme levels according to the CBOE put/call ratio. This is in support of the bearish sentiment we are seeing as pointed out in #3.
5. I will keep stressing this....FEAR is at extremely high levels. It is in areas where signficant rallies occur, not only intermediate term, but even Long Term bottoms. According to the AAII investor intelligence figures from decisionpoint.com, we are seeing a historic extremes of bears. Now, this is typical in bear markets and we do think we have entered into a mild, however, it can lead to sharp rallies. In this case, we would account those to short covering.
6. There are positive divergences in RSI readings on many of the major index averages with lower volume pushing down on this low versus the June lows.
While we are stating the positives, this is for the next couple of weeks only. We still expect the market to plunge lower into the October timeframe where we should see a more substantial bottom. A bottom that will ignite the impulsive bull market waiting to be unleashed. We are currently in the timeframe for a 4 year cycle bottom and an 8 year cycle bottom. To understand the implications of this and see what happened in 1998, 1990, 1982, etc. All major bottoms. Therefore, we may see some carnage into that seasonally weak timeframe.
why do i come back to this site day after day?
tim does not abandon his blog. he is there day after day willing to discuss the day's events, his thoughts, his positions. he is not out to huck (ster) us but lays his own on the line.
each of us is responsible for our own trades, but i enjoy tim's pov and his sincere confidence.
one of these days we are going to have to pay for "our" sins of excess. sooner than later reality will shock the cnbc bull jocks with their mouths full of self-serving optimism.
the m3 is no longer reported: why? because inflation is actually the excess of money which lowers the value of the dollar which means more dollars must be spent to produce a product.
the u.s. has been printing money hands over fist - inflation is far more rampant than the benign testimony of Big Ben suggests. the fed rate will rise in August. the talking heads will still scream bull.
the dow may reach 11250. i will be there to happily short it.
waiting for dow 11250-11350 to short....many thing the next few weeks we will be trending higher.
plunge protection team in action. mideast about to blow up and gold declines and dow rises nearly 200 points.
the new treasury secretary, paulson, is a pawn from goldman/sacs but they cannot prop this market up forever. gold will skyrocket and oil also within another year.
like always, the difficult part is being in the right place at the right time...
what rally is everyone talking about? about a month ago, I was on the bull side, saying the oversold condition was prime for a bounce, and did it happen? of course not. We are stalling at around 11k but no one seems to be doing anything, it just a halt before more another collapse. I find it extremely frusterating, because a nice bounce which everyone has been calling for the last two months, seems to be a short lived 2 days, before it all falls straight down the sh*ter. a little pathetic if you ask me.
to any bulls out there, i appreciate your position especially in a forum where everyone seems to be really really bearish. but its a little scary when you see some upside bounce, only to watch it dissipate into thin air a week later, even you guys must be a little annoyed. I am a bear, but even I like some nice bounces to the upside once in a while, it makes for the put spreads to kill off some time, but I haven't seen a nice bounce for some time, and infact had to take a loss, A LOSS on a put spread, because the qqqq fell too fast - this fast movement, is very unrepresentative of what has happened over the last three years of the bull market, and if you don't believe me, take a look at the charts - nice bouncy, clean higher highs, and higher lows. but now, we see ugly stall, and drops, which only means one thing:
the time is changing.
don't stay stubborn to a failing strategy. the stock market makes you have to adapt very quickly.
Written in a sunny internet cafe in Rome, Italy.
from wallstreetexaminer.com
"The Fed added liquidity on Monday, pumping a net of $6 billion back into the markets. Their strong goal line defense force a Bear fumble, which the Bulls have run back for a big return."
Could not get the whole article because I do not subscribe.
Sure is hard to trade this market if such intervention is true.
Trader Tim,
The media has recently reported that the percentage of bears versus bulls is at a very high level, but I also see that the VIX is near all-time lows. This seems totally contradictory to me and I just can't make any sense of it. Do you think that investors are just saying their bearish, but that they are still actually invested and expect the market to go up anyway? You're take on this is greatly appreciated. LS
"We're still in a nice succession of lower highs and lower lows since the May 10th peak." That's incorrect, and your own chart shows it on the $SPX with the July low being ABOVE the June low. It looks like a "W" bottom to me.
My money's where my mouth is, I was 112% long yesterday morning. This morning I'm trimming the sails to 100% long (give or take some small change in the account).
I don't know if last week was the final test of the lows, but I think it may be. I see a triangle pattern on the $SPX 6-month chart and expect to see it broken to the upside.
NTRI has lost 16% of its value so far today. How it's going to nail that $120 price target ("guaranteed" by hurricane5) is quite beyond my capacity.
You notice how the bulls on this are pointing out that it's just because the COO/CEO is leaving?
What if the stock was UP 16% and we bears were saying it was just because a hot new COO/CEO was coming in? Can you imagine the stink they'd be throwing? As well they should, since the price movement is all that matters.
Sheesh.
why is Uso down ?
"So, you're expecting a 96% drop in the S&P? That would probably put the GDP of the USA around the level of Somalia. I like to keep an open mind, but let's just say this scenario is somewhat improbable."
Sorry if I was misunderstood. I wasn't actually calling S&P 50, and I definitely agree this scenario is improbable, to say the least. I was just pointing out the technical measurements of a potential double top is still a long way from completion (if it even turns into that at all).
But I honestly don't see how the markets could lose 95% to 100% of their value, even if this huge double top were to form. But this extreme measurement illustrates the huge bearish potential of the long term market situation. We don't need to get anywhere near S&P 50 before seeing some major carnage.
But then again, the S&P did half it's value from 2000 to the end of 2002. And it lost more than 80% of it's value from 1930 to 1932. It also lost more than half it's value between 1937 and 1942. So again, I'm not calling S&P 50. Just observing this is what the technical measurement suggests...based on a pattern which is FAR from complete (and which may also evolve into something bullish, like continuation triangle).
I'm not that much of a bear anyway. But it's a sobering possibility, no matter how improbable.
Brian, you can't just look at absolute numbers and draw conclusions of percentage declines based on ONE market crash.
You have to understand that, fundamentally, the S&P was trading at a tremendously high P/E ratio in 1999. So, a decline of 50% from a level that was overvalued by 100% is only returning the index to "fair value."
The only thing keeping stocks up at current levels is market sentiment and investor confidence. Period. If confidence declines, so does the market. The P/E ratio will reflect that. In typical bear market bottoms, the P/E of the S&P was around 8-10. Now we're right around 15. So if the bears really take charge, we could see a 30% decline in the S&P (along with the other indices as well).
Bottom line is that market sentiment right now is NOT favoring a higher valuation than a multiple of 15 or so. Even if we stretch it and say that the S&P500 deserves a P/E of 16 or 17, that's only a 10% upside. But as I said, the downside is 30% or more.
-Tony
Holy crap, every index is going vertical.
Can't quite figure it out. The bulk of the day was spent in a low-volume trading range and in fact was in the red for most of the day.
One hour to go, and the market shoots up 80 points. Amazing.
markets headed higher again, another few more days in rally mode and then the sell-off begins.....
this is program buying, they are injecting a ton of money into this market to keep it floating higher. This is even better for shorts. I cant trade at the moment. Switching brokers hopefully by monday or tuesay i will be able to pick up some more shorts.
this is program buying, they are injecting a ton of money into this market to keep it floating higher. This is even better for shorts. I cant trade at the moment. Switching brokers hopefully by monday or tuesay i will be able to pick up some more shorts.
this is program buying, they are injecting a ton of money into this market to keep it floating higher. This is even better for shorts. I cant trade at the moment. Switching brokers hopefully by monday or tuesay i will be able to pick up some more shorts.
short AMZN
it was program buying all 101% of it...complete headfake....short at dow 11250+ and nasdaq 2100++
yeah program trading or not the MARKET IS HIGHER.... phuck.
i am trying to find the volume that drove it up
OMG- what am I supposed to do with these OIH and EOG puts? Holy moly. My money is going UP the tubes...
more fed money injected --> election year you know.
would not surprise me if the fed jacks this thing up another two hundred points. the problem is keeping it there.
the market has some serious issues to deal with all the money is moving to defensive names. the biggest earnings are coming from XOM, COP, anything energy and the likes .... anyone hear jack from IRAN recently ??
GDP will = big rally or big failure.
i hope for FAILURE
DIE MARKET DIE
Patience is a bear's biggest asset...
Who else is looking at AMZN after the close? Down over 11%.
Just bought a put on that one at yesterday's high :)
I'm pretty much a novice with all this stuff, and historically, a big-time bull, but it seems painfully obvious to me that there's no way the market will be moving up for at least the next few months -- there's just too much going wrong and very little going right.
Wow, what a bait that's been thrown out to the bulls today! Buy now before prices go higher. I'm guessing there is 100-150 points upsdie on the Dow before the next downleg begins. There is deterioration galore in the mkts right now. Sell if you haven't already!
- Frank the Tank
im takin detroit over 9.5, arizona +10, mets under 8, and toronto under 8, i feel better about these investments than i do about wondering which way this market is going! huricane , before you jump , try these plays ,get in where you fit in! goodluck all! Help Tim ???
Chronictown
CONGRATS to everyone who made $$$ on NTRI, AMZN....and the other 10 stocks that suffered some massive whackkage (new word) today:.
This up move is a bit ridiculous. How many companies missed today??? How many said the economy is slowing? how many guided down???
SBUX is looking expensive here, and technically it doesn't look to hot. Someone is trying to hold it up though........ They reported weaker then expected June sales and have an insanely expensive multiple. I think they will guide down on their next earnings and take a haircut for not delivering the growth that is in its PE.
The consumer is tapped out...
GOOG.... I don't think the click fraud charge is baked into Google's estimates. When they get dinged for a minimum of 100 Mil...the stock will get hammered. Plus change of trend- the 50 and 200 day are about to cross.
Good Luck!!!!
All about earnings this week and weeks ahead, S&P forcast it would be better than expected, like 1% better. short term, trendline could be broken easily, if big cap earnings continued to be good.
just look how green the earnings board
Earnings
scalping up intraday industry leader seem to work for me, got some X and RS (metal fabrication) today when touches lower bollinger band, goodluck everyone
Leaders
Post a Comment