
Perfect Fibonacci Retracement
A long time ago, I drew a Fibonacci retracement spanning from the market's peak (January 2000) to its post-bubble trough (October 2002). The 61.8% retracement level on this is 1,253.29. Today, at 11:51 a.m. EST, it hit this mark almost exactly and instantly turned around.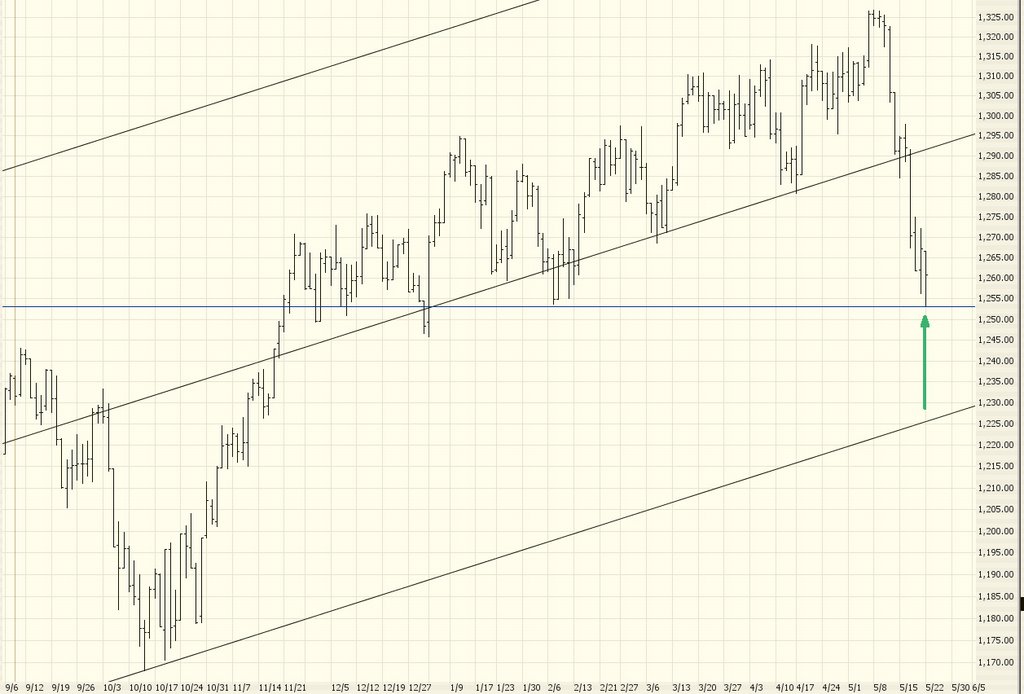
Here's a closer look at the day's action. To be fair, it didn't hit the line to the penny, but it did so with 99.999% accuracy and - forgive me - that's good enough!
A similar "buy" signal can be seen with the Russell 2000 ETF where it touched the ascending trendline perfectly.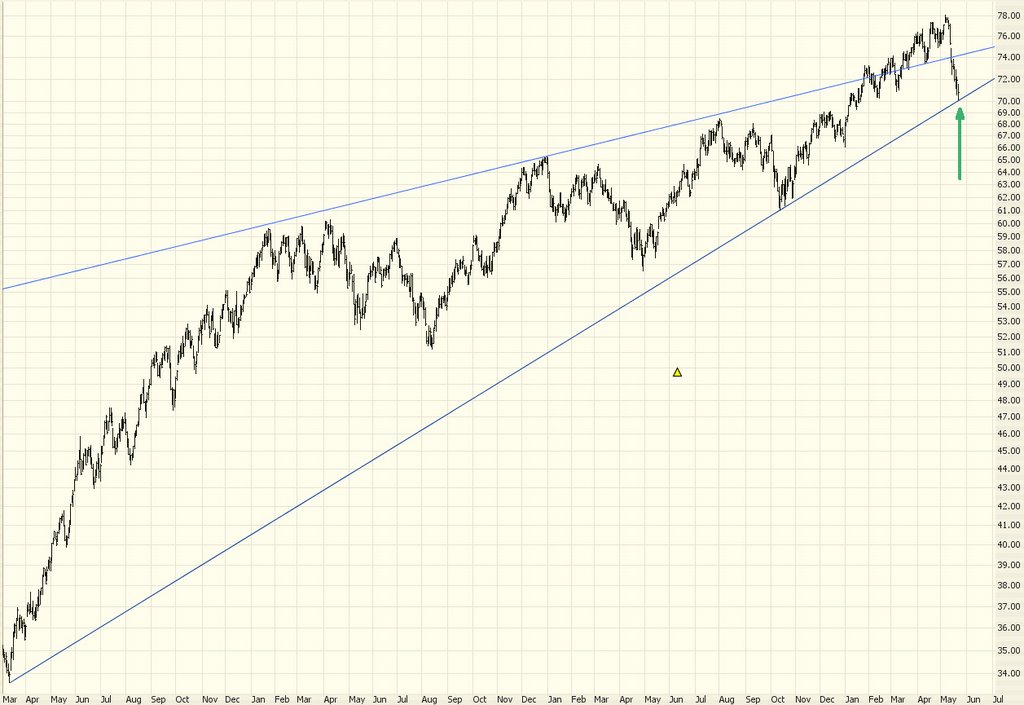
One "sell" suggestion would be for E*Trade (symbol ET), shown below. I wouldn't call this a head and shoulders, because the right shoulder is higher than the left. All the same, it looks like a nice topping pattern to me.
Readers of this blog will also note this is the first time I'm going to suggest you buy some pot. Specifically, Potash (symbol POT). It seems a relatively safe bet during what will probably be a short-lived upswing in the market.
Property stocks look ready to fall hard, and Simon Property Group looks like a particularly good play considering it has both broken its trendline and is in a nice toppy rounding pattern.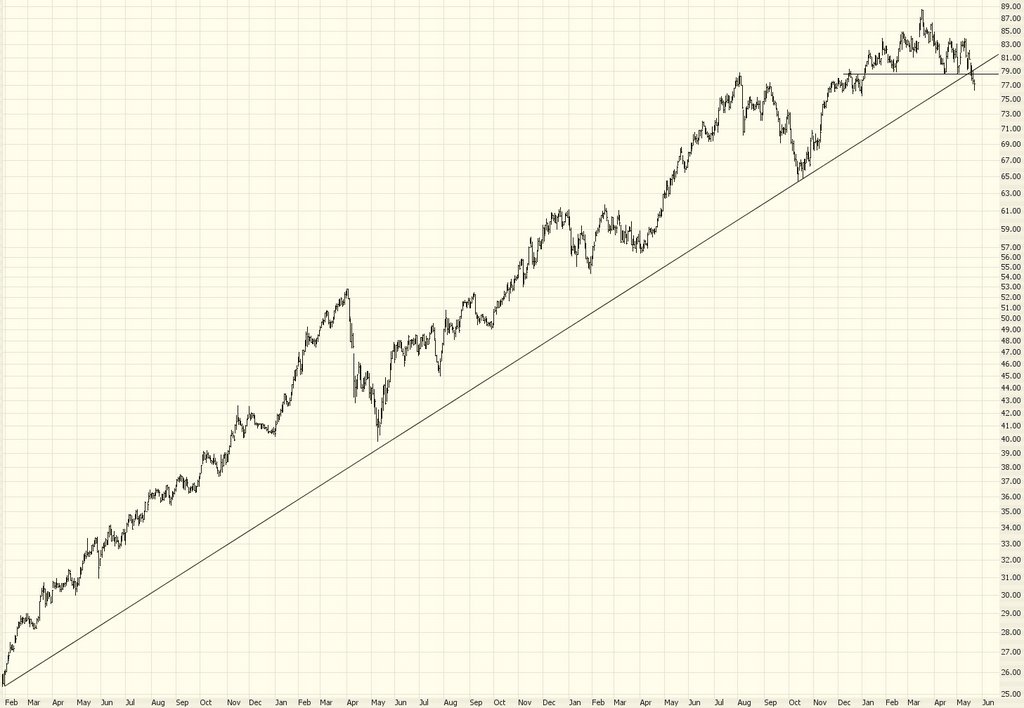
At the risk of repeating myself: I think the market's going to go up. Maybe for a day. Maybe a few. Maybe even for two or three weeks. But it's going to hit some choice resistance levels. And then I'm going to go bananas buying puts. The bull trap is set. We need to wait a while before it springs.
7 comments:
I'm not crazy about either of them, Andrew, but if I had to choose, I'd go with GOOG with an (obvious) stop price of $360.
Tim - every index today is printing a bottoming candlestick (led by Trans which printed its bottoming candlestick on Friday and rebounded today) and TLT printed a topping 'stick. This suggests a possibility for an up day tomorrow - but there are other dynamics in play.
I still think the weekly readings are long term correct and we will probably (75-25) finish the week off below today's close. As I see it Friday's close was a gift. The fact that the close on Friday on all of the indices (less trans) was a thrusting candlestick (closed higher than open but not above the middle of the previous days open-close range) suggests a secular weakness in the overall market. It is possible that tomorrow we will have an up morning followed by a decline into the close.
Hope for the bottom . . . the selloff has been pretty extreme. Have a few longs I am looking at, but have failed recently EXP, AKAM, CCJ, FAST to name a few . . . not sure what the market needs, but hearing from the "experts" they think the same money is in C, BAC, K and BUD. What is going on???
Anyway, will watch for confirmation up before I enter for a nice short term trade up . . . understanding that the bull line (currently) has been broken and down plays at resistance are SWEET!
Good luck all you playa's!!!!
Tim,
i'm completely confused - 61.8% of 1530 (the $spx high of 3/2000) gives me a value of 945.54.
But I went long after the VIX spikes. So as Bill Murray wisely opined in Caddyshack "So at least I got that going for me".
-Mike
SHLD topping/double topping here?
To respond to some of the items above.......
+ I think SHLD represents an interesting short opportunity. I bought puts on this and have a contingent stop at 163.50. This is a premature trade, I have to admit. It could bust out of that saucer pattern. My reason for this short is completely stupid, but it is as follows. This thing is sky-high and....people.....it's SEARS. I mean, SEARS. Hello? Is this 1952 again?
+ The NVR chart is pretty nice, but it's not a great head and shoulders (yes, I've seen better - BRCM back in the summer of 2000 is incredible). Also, it is not optionable.
+ Mike, the retracement isn't set with a baseline of $0. There's a minimum AND a maximum level, and the retracements are computed from there.
+ One fellow just wrote me asking what I thought of the market's inability to hang on to a bullish bounce. Well, it's a little nerve-wracking, since it would be safer to short at higher levels. But I think it's pretty heartening that the market can't seem to GET it up and then KEEP it up.
+ Oh, while I have your attention - - I mentioned URBN as a short a week or two again; wow, is THIS one working out nice! Beauty.
considering AAPL's performance for last few days, you still feel this way:
One specific 'buy' I'd suggest is Apple Computer (AAPL), my employer from many years ago. I think we've got a nice inverted head & shoulders pattern here, as well as firming at the Fib retracement level. Plus, it went up today (yes, up) which is extraordinary considering the market's action.
thanks!
Post a Comment