
Charts and Targets
As I mentioned yesterday, I felt today would probably bring some strength since the $VIX had blown skyward so fast and furious. Below is an intraday chart of the $INDU over the past 30 trading days. As you can see, it seems to be giving quite a bit of compliance to its Fibonacci levels. It needs to break through its lows earlier this month to get serious about turning bearish.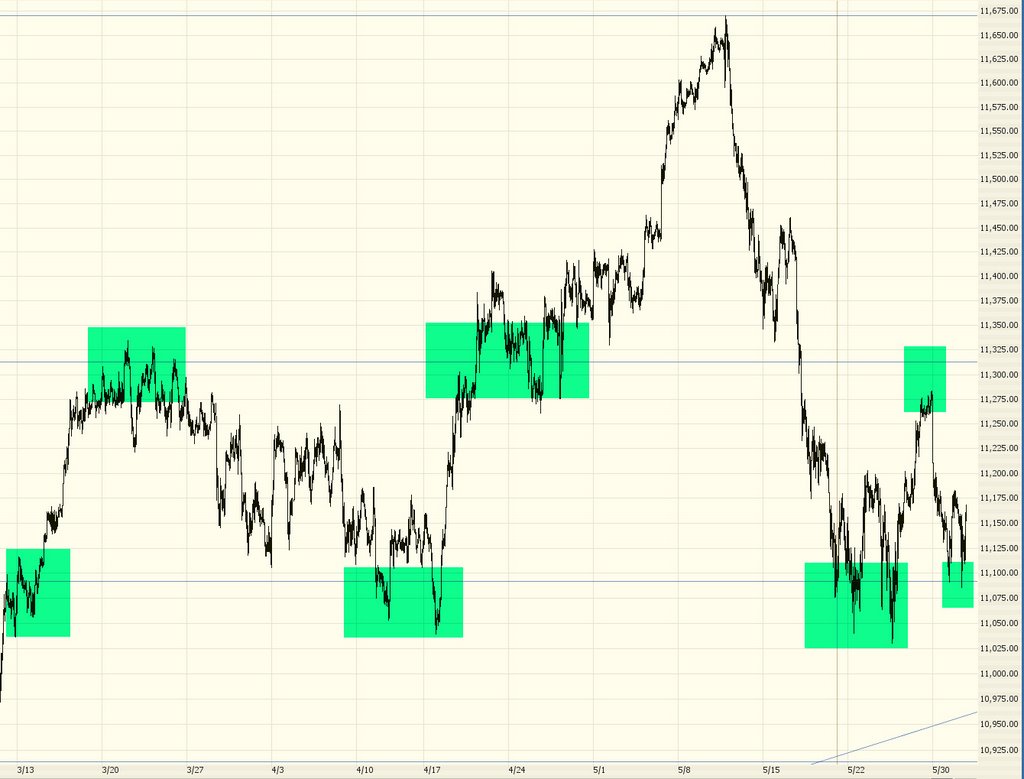
I'd like to offer up a variety of charts I think represent good opportunities for bears. These are optionable, so July slightly-in-the-money puts probably provide the best bang for your buck. You might want to wait a day or two to see if the market's strength today continues before pursuing any of these. I've marked approximate target prices with green shading.
Here's BHI: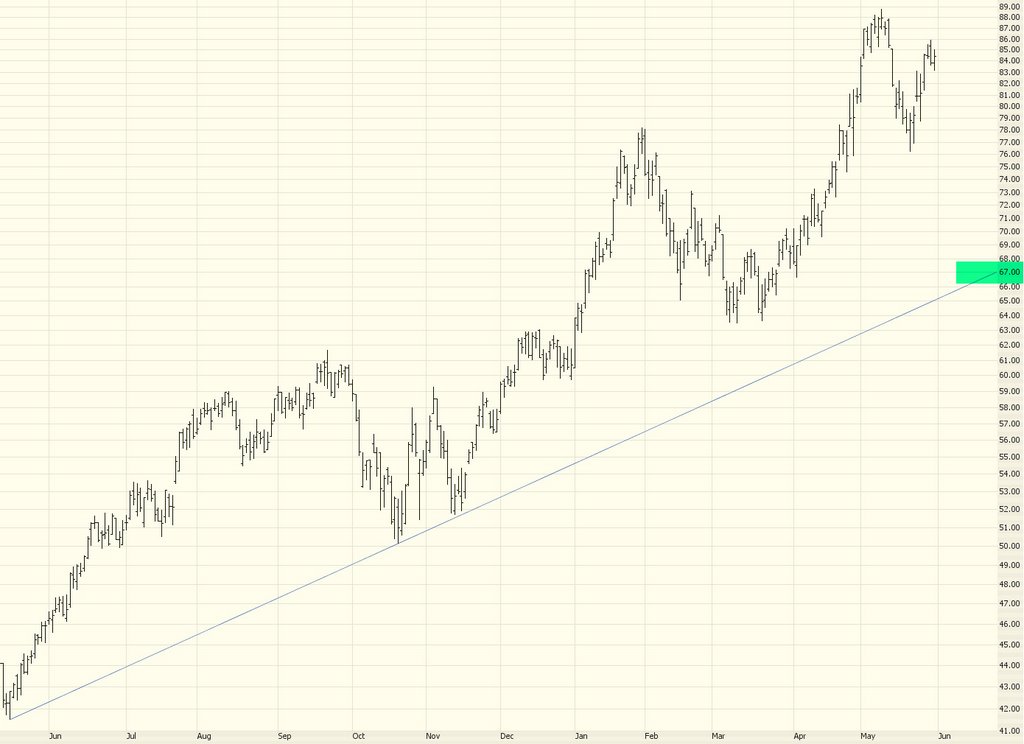
BSC: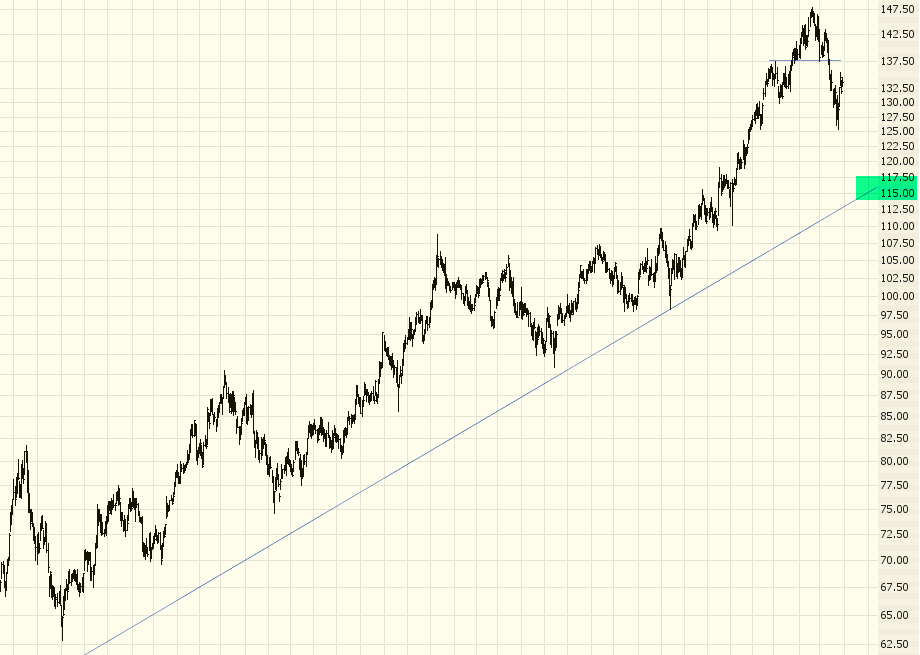
COF:
CRR:
DRIV: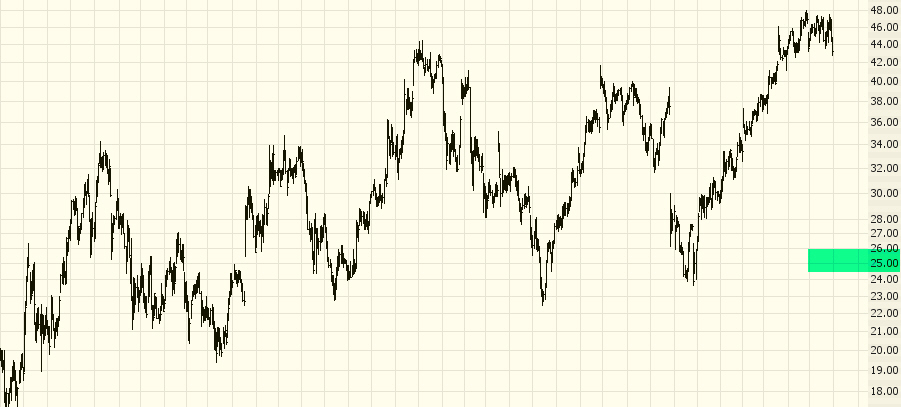
EME: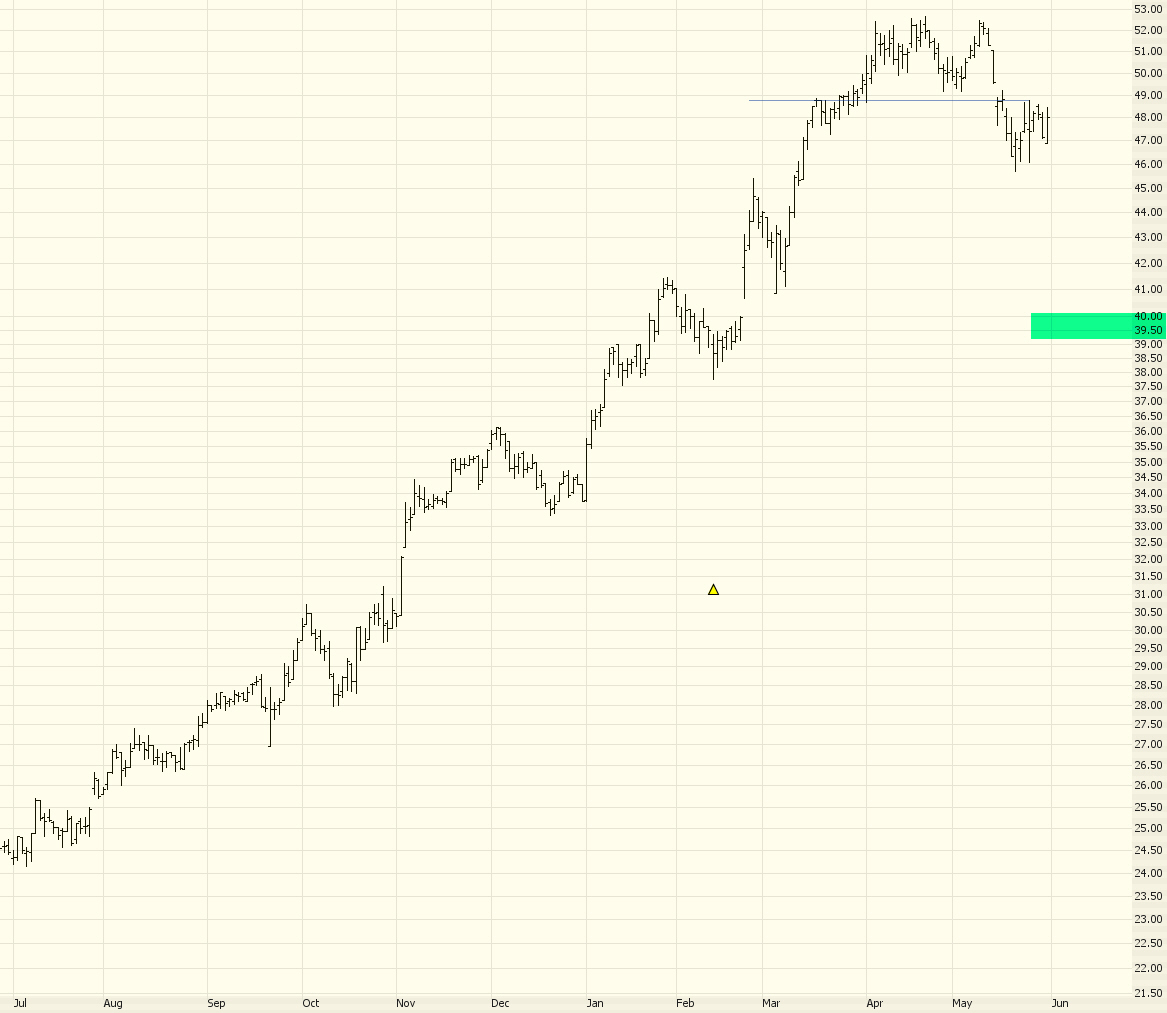
GPI: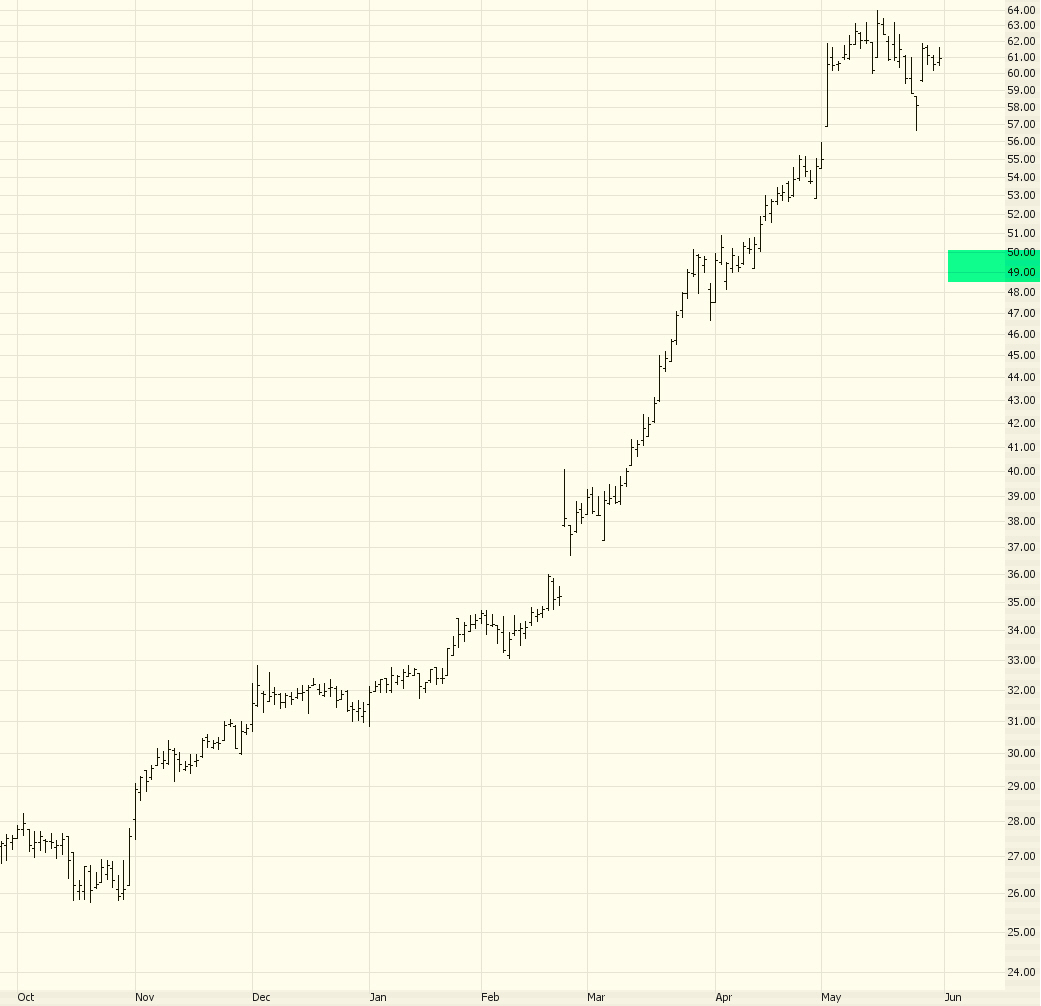
HUM: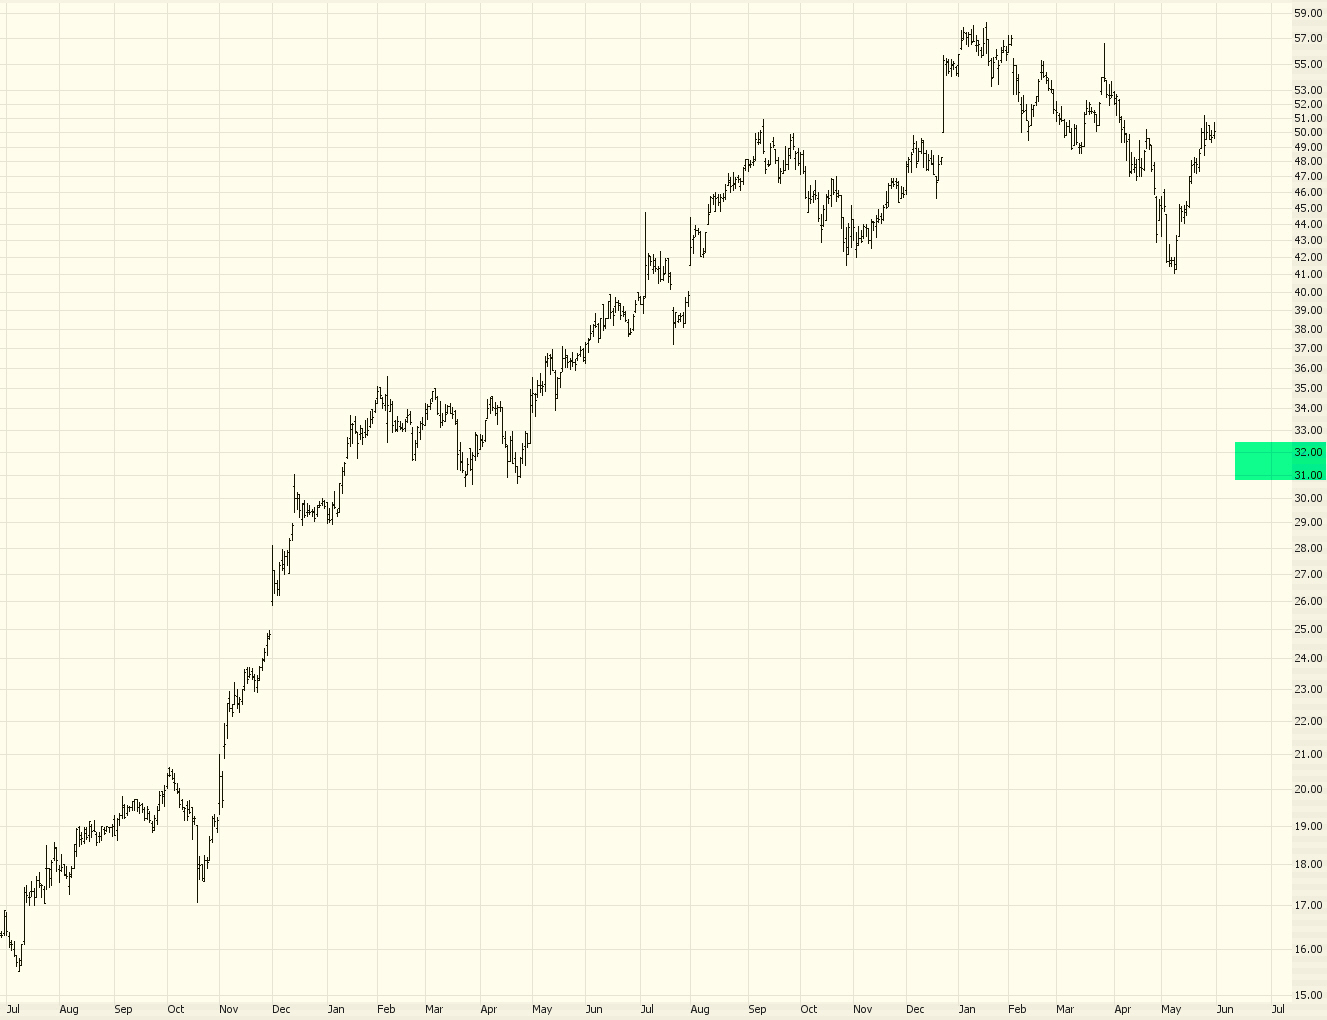
IPS:
NUE: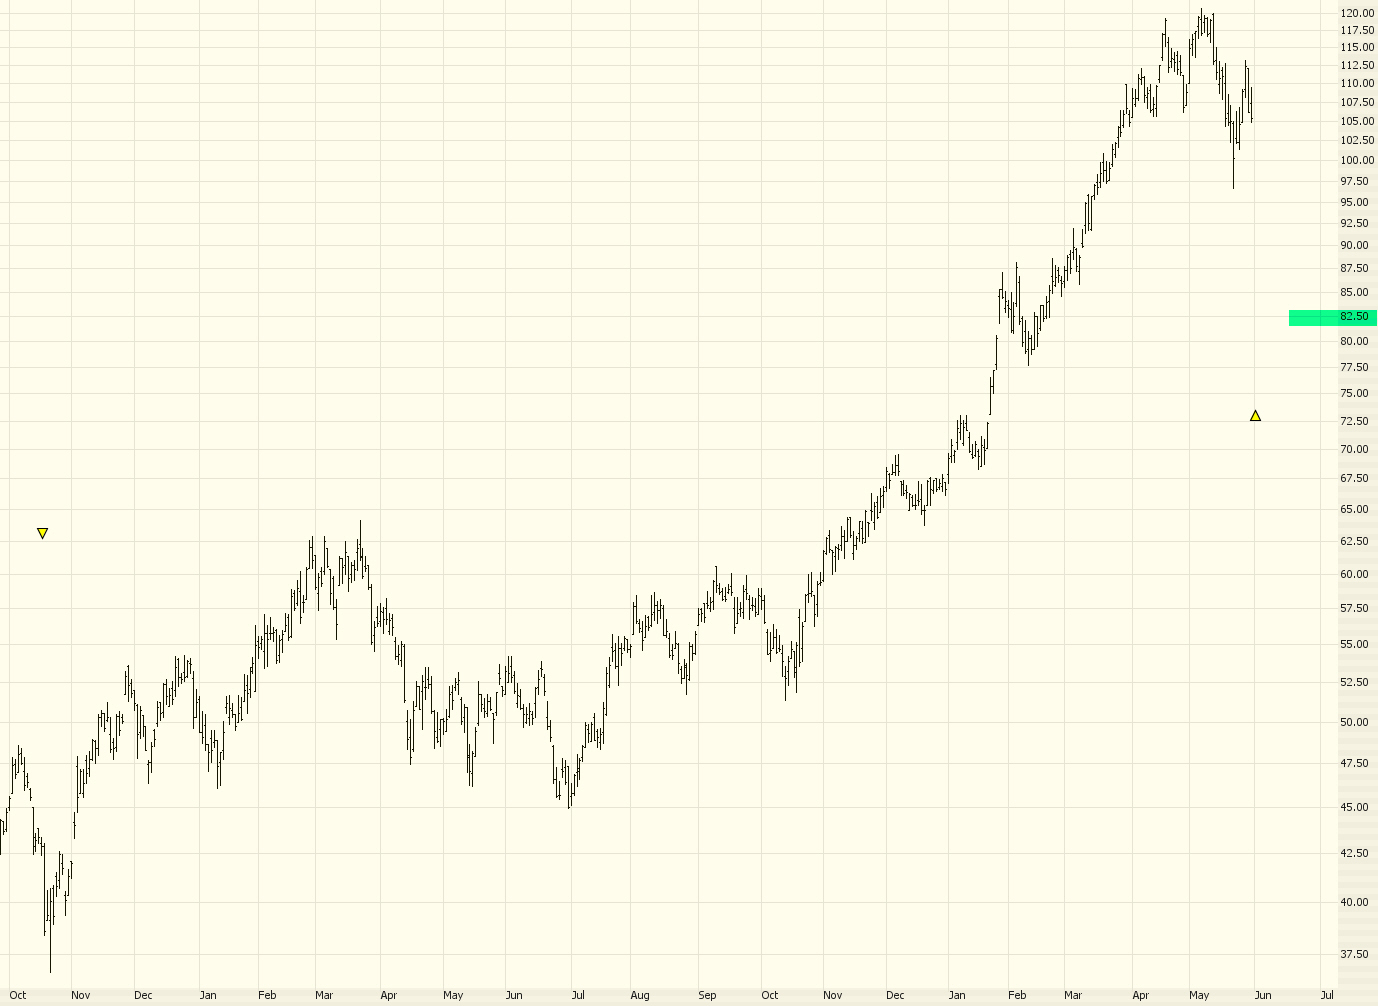
PD: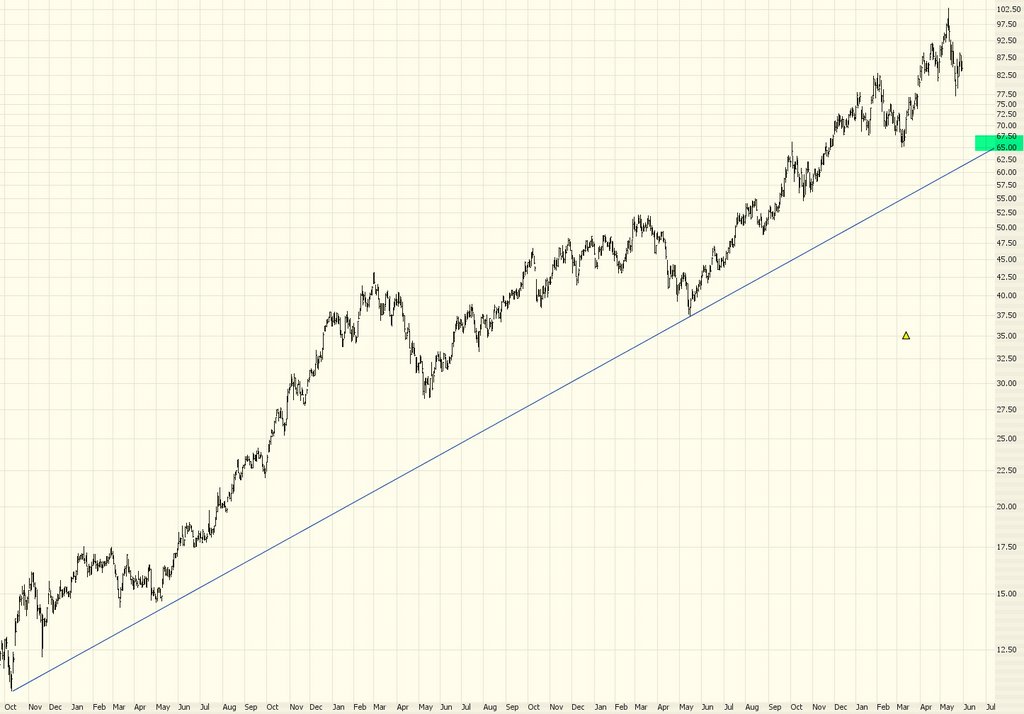
PENN: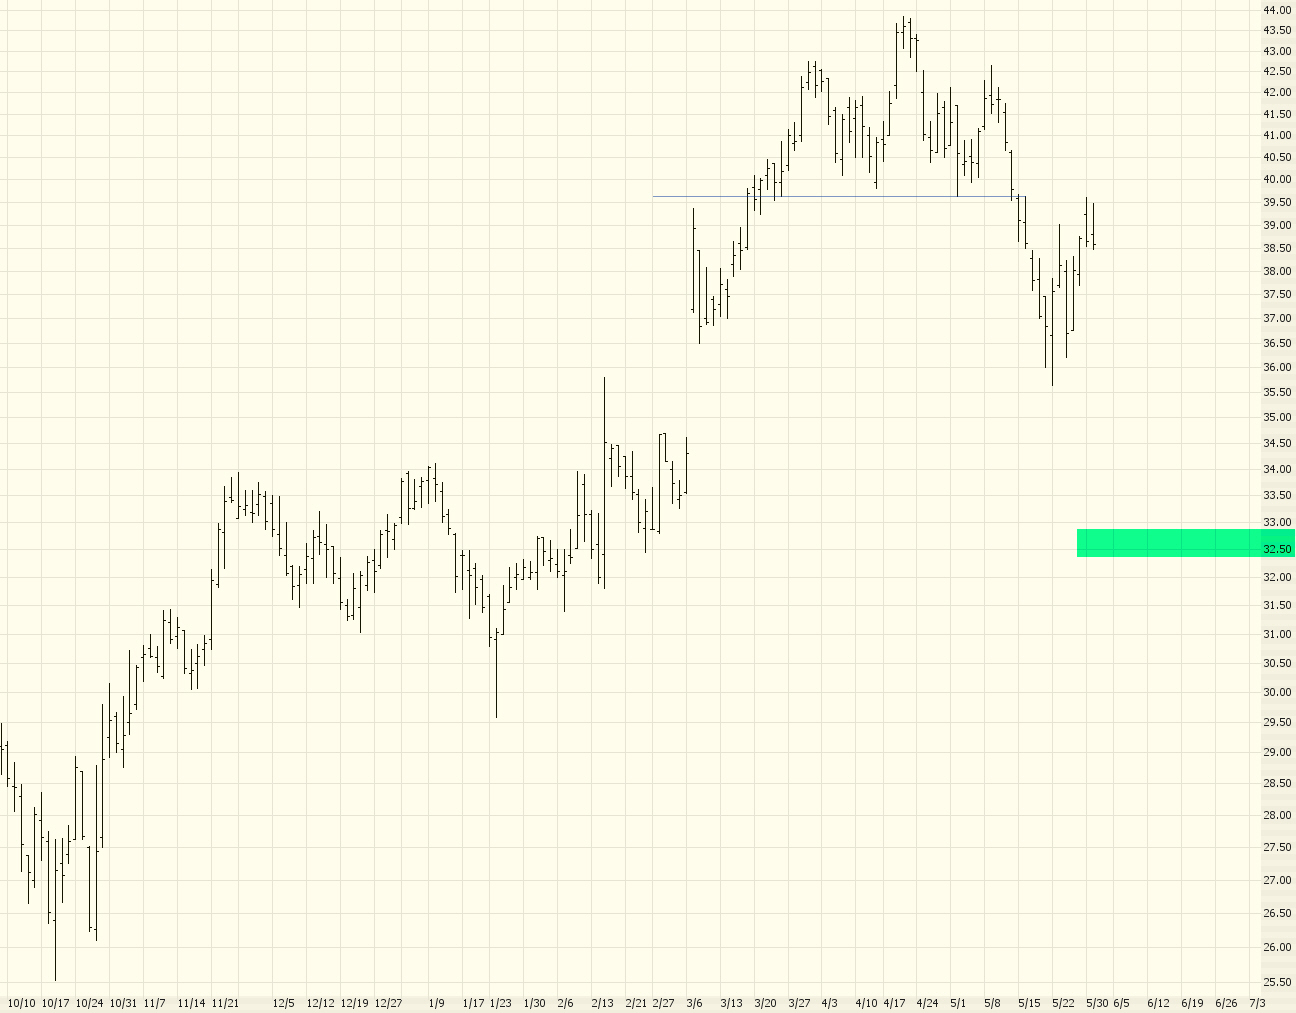
SHLD: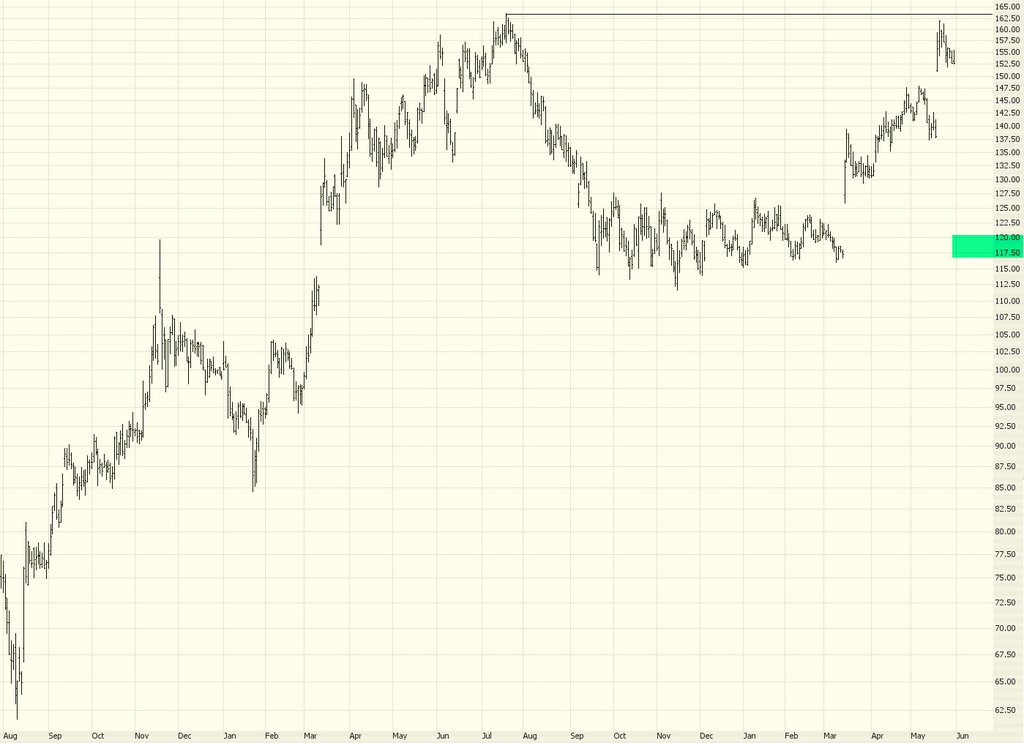
Beauties all, aren't they? Some serious, consistent strength from the Dow might wreck these patterns. It's definitely happened before. For the moment, we seem range-bound between 11,050 and 11,280.
4 comments:
Really interesting article, everybody - I recommend it.
http://moneycentral.msn.com/content/Stratlabs/Round13/P151521.asp
Another wonderful day in the choppy trading sea. I have no clue for Thursday - plan on taking the day off an going to play some golf.
I ran the "short selections" through my machine and think that BHI, BSC, CRR, HUM, and IPS are going to participate in the next rally whenever that might be - the rest - they seem to be just crap - have a happy.
Bon Chance -
I think a lot of you guys don't get what the VIX is signaling. It's telling us we're in for a 9-10% rise in the
stock market and/or a rally that lasts 2-3 weeks.
That means most of June belongs to the bulls. The triple spike in VIX (3 instances of VIX spiking over 18) is a very bullish indicator. I trade sucessfully on it (bough QQQHN at $.90 and it's at $1.25 1 day later) every time it happens.
Also, the volatility of the VIX hasn't been this high since 9/11. After 9/11 the market also took off a bit before tanking hard in October of 2002. Volatility of volatility is also a very bullish indicator that I trade on.
I trust the VIX the way Tim trusts his beloved precious Fibs!
So this rally has legs. Tim, I'm just trying to emotionally prepare you for the next two weeks ;-) I'm with you on
the intermediate term assessment of things.
BTW, everyone loves to quote Paul Desmond. I subscribe to Lowry's and I think they may have been pre-mature in calling a top - although their indicator did indeed signal a top. We may weakly break the previous highs. Also,
Desmond calls for a 40% drop. That's music to my pessismistic bear ears!!
The triple peak in VIX is a very strong indicator - 78% accuracy. Other sentiment indicators are also pointing towards a brief really. I think the "snap back" will depress a lot of bears.
The puts are gonna get cheap real soon.
such a weak advance, I think the bears will be back next week!
Post a Comment