
Stop Me If You Think You've Heard This One Before
The saturation of green on my screen from my short positions is my simplest, favorite indicator that things are clearly going the way of the bears. (Da Bears....) Lovely stuff.
Crude has double-topped. Energy stocks are completely exhausted. And hyperbolic insanity like CRS and TIE are reversing. Beautiful.
Let's take a look at a few charts.
First is the Dow. I want you to look at something interesting (particularly you, hurricane5.....) I've highlighted in green all the bullish rises over the past 18 months or so. Do you notice a trend here?
(1) The length of each rally is progressively shorter
(2) The gain of each rally is, by and large, progressively smaller.
The most recent one is just pathetic. The "rally" lasted three days. (Constant reminder: click any image to see a much larger one).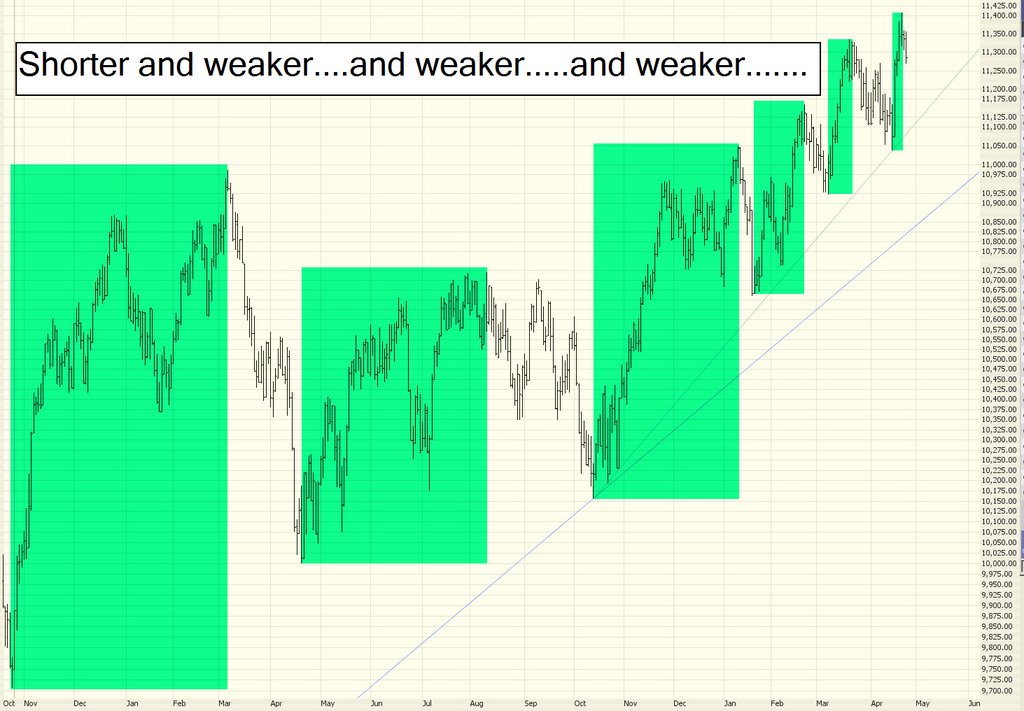
Crude oil has reached a complete saturation point in the media. Everyone is talking about the spectacular rise in crude, in gold, in copper, silver.........and, as all good contrarians know, when every flippin' schmoe on the planet is talking about how high or low something is, it's probably time to fade the position. Crude tried to push higher today, but went limp fast.....
Look at Genentech (DNA). Head & shoulders patterns do not come much cleaner than this. I could absolutely see this heading down to $60.
A similar pattern, mentioned here many times already, is Express Scripts (ESRX). I still have no clue what this company does (and I take a certain amount of pride in that, being a pure technician). It's a stupid company name - - do they write screenplays rapidly or something? No matter. It's headin' down.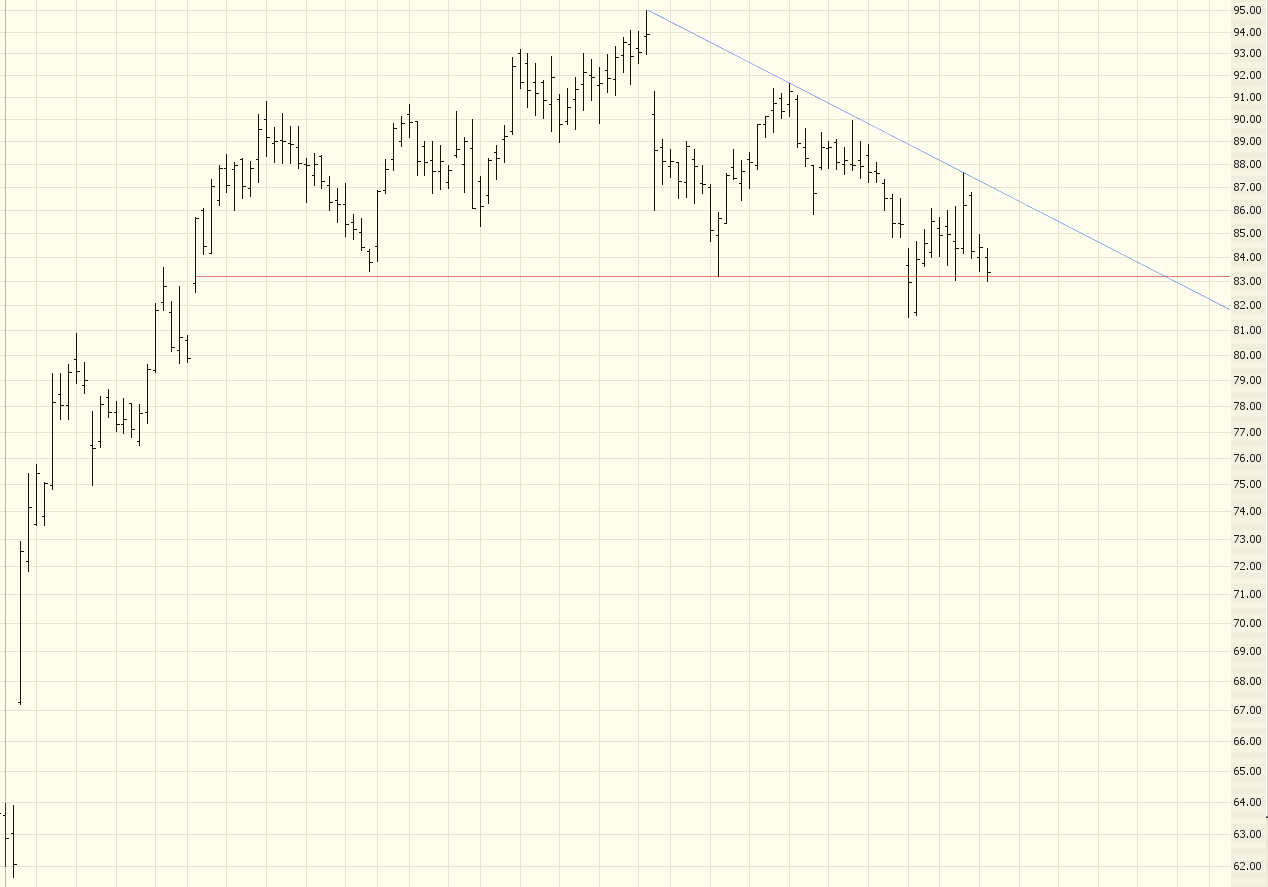
And from our Tilting At Windmills department, I humbly offer a NTRI chart once more. This dynamo rocketed higher today based on blowout earnings. I dunno; looking at the trendline, I'd like to think it's reaching its potential at this point. But I've been wrong on this one more than once before!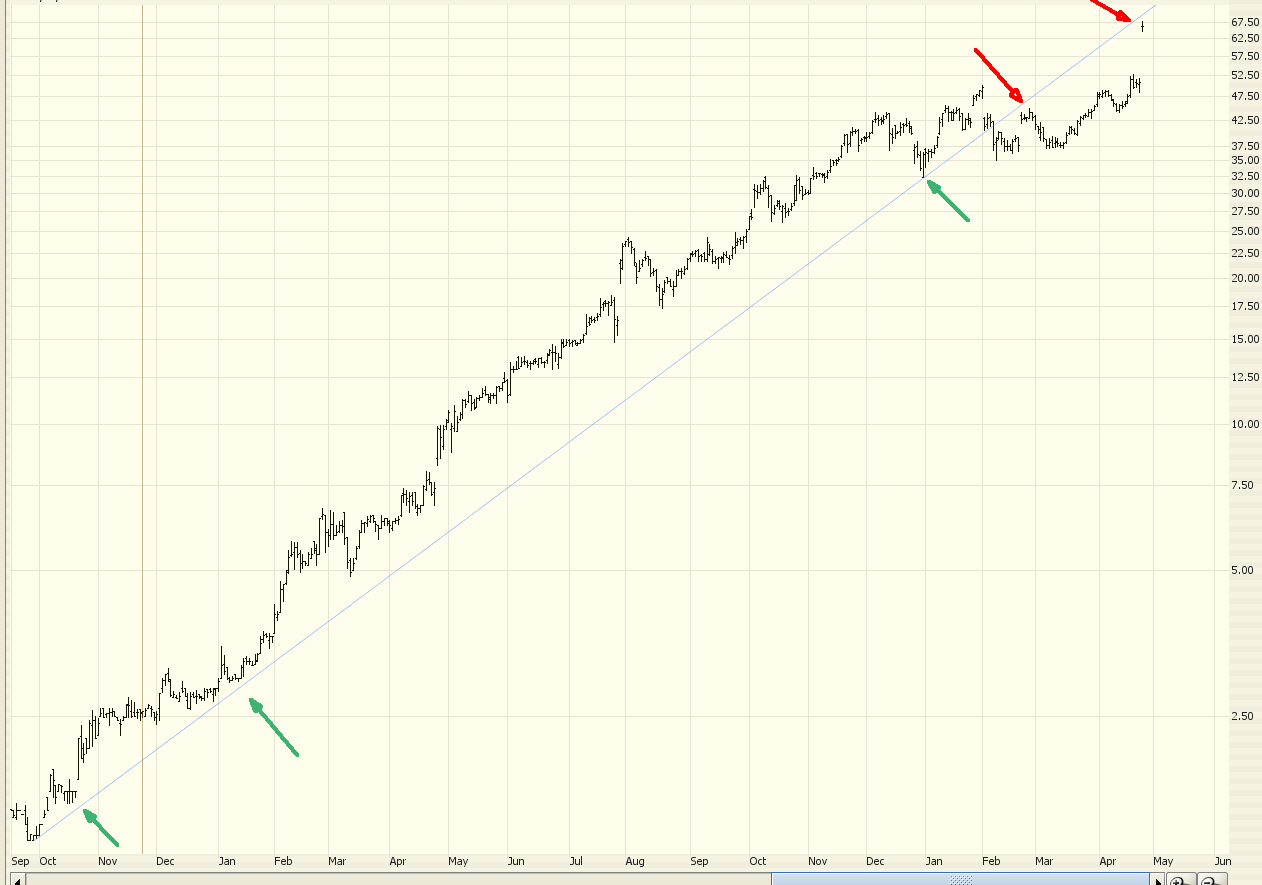
5 comments:
Talking to Andrew S. last week brought up another key point for the brears. Remember in 2000 what the popular new show was? "Who Wants To Be a Millionaire". Just by answering some questions poof you were "rich". Whats the newest popular TV Show for America... "Deal or No Deal" just by Guessing correctly you win a nice sum of money... Something to think about!
Oh well, i knew i would expect another case being made for the bearish market by Tim today.
The length of the rallies on the dow fading is an interesting observation, but not conclusive by any means. For this market to turn bearish, it needs to breach 10900. Why keep making a case for a bearish market when you can wait for the 10900 breach. Come on now, 10900 is just 4% from this level, cant you be pateint Tim?
Kapil, I agree with you. It's not a clear-cut bear market until the series of "higher highs, higher lows" is broken. I do recognize that. But, let's face it, the "oomph" is getting pretty modest. As for what level it has to breach, I'd cite two......11,039 (the low set on 4/17/06), and then after that, 10,825, which would break an over two-year old trendline. Now THAT would make the bearish case much easier to argue.
Fun to hear the bear . . . one day he will be fat and happy. Unfortunately, I expect soon.
I disagree. First you can't call a top using daily charts - you have to use weekly or monthly. Second if you look at the weekly you will see very clearly where the "bear" begins and that is about 10200. Until it drops below 10200 it is only a "dip" and dips will be bought over and over and over again by the program trading devices that the 10000 hedgefunds have at their disposal.
In other words the only way we get to 10200 is via a three day crash.
Post a Comment